4216
The ability of magnetic resonance spectroscopy to measure metabolite changes in response to ketamine in major depression at 7T1NIMH, NIH, Bethesda, MD, United States
Synopsis
This study investigates the feasibility of measuring glutamate and glutamine metabolites by 7T 1H-MRS after a ketamine infusion in a double blind placebo cross-over study in major depression. MRS data was acquired from the pre-genual anterior cingulate in 15 depressed and 13 healthy controls. Glutamate levels, but not glutamine, were found to be significantly different between groups.
Introduction
Major depressive (MD) disorder is a leading cause of global disease burden and disability. Ketamine is a glutamateric modulator that was serendipitously found to alleviate the symptoms of major depression at sub-anesthetic levels[1]. The pregenual anterior cingulate cortex (pgACC) has been found to play an important role in MD symptoms and drug response[2] and has been shown to be affected by ketamine in healthy controls[3]. In this study, we investigated the feasibility of measuring the effects of ketamine on metabolite levels in the pgACC using magnetic resonance spectroscopy (MRS) at 7T. Scans were performed at baseline and after each infusion on a cohort of unmedicated MD patients and healthy controls (HC) in a double-blind placebo cross-over study.Methods
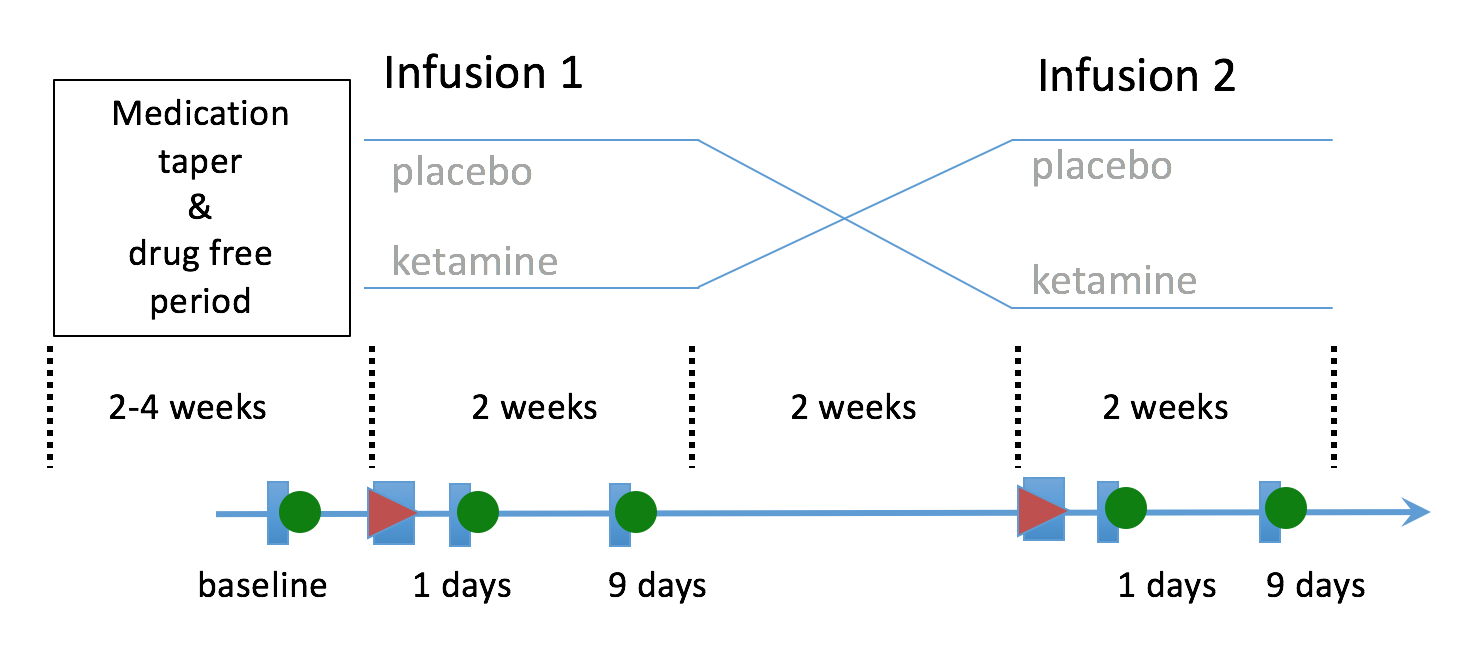
Data from 15 MD patients and 13 HC with 1H-MRS at 7T were used. After a 2-week drug-free period, subjects were given an intravenous infusion of either ketamine hydrochloride (0.5 mg/kg) or placebo (saline) on two test days, two weeks apart (see Figure 1). Montgomery–Asberg Depression Rating Scale (MADRS) scores were obtained throughout the study to monitor the change in depressive symptoms.
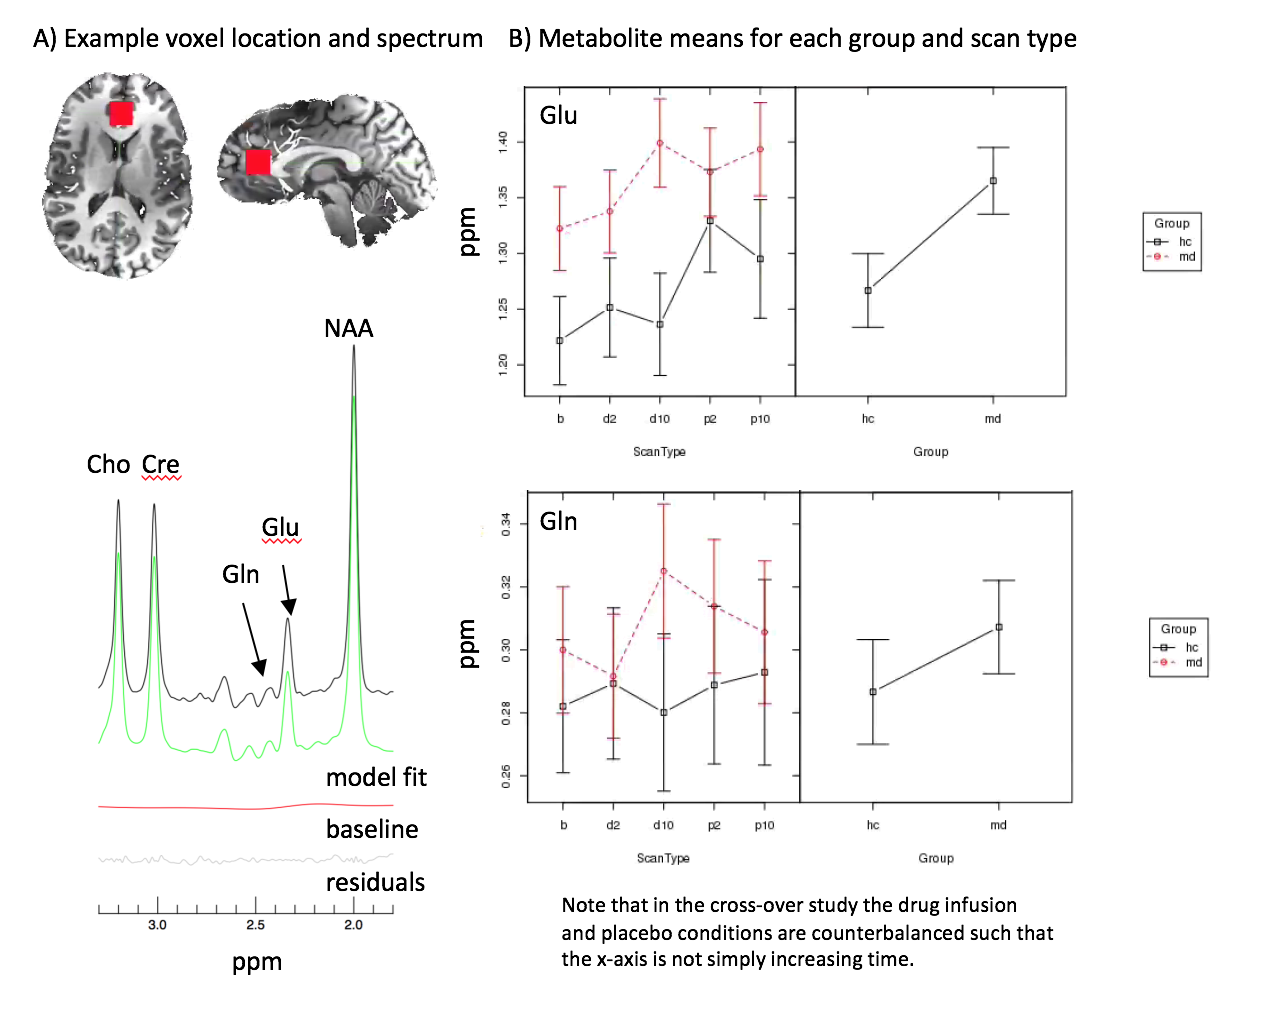
1H-MRS data was acquired from a 2mm3 voxel placed at the medial pgACC of both MD and HC subjects at day 1 and 9 post-infusion. An adapted echo time optimized point-resolved spectroscopy sequence (PRESS), modified with the addition of a J-suppression pulse to attenuate N-acetyl-aspartate multiplet signals at 2.49 ppm, was used to excite and acquire the spectra[4]. In-house software was used to model glutamate and glutamine, among other metabolites, and are shown referenced to creatine. A linear mixed effects model was run in R[5] on the metabolite levels to evaluate the group and scan effects.
Results and Discussion
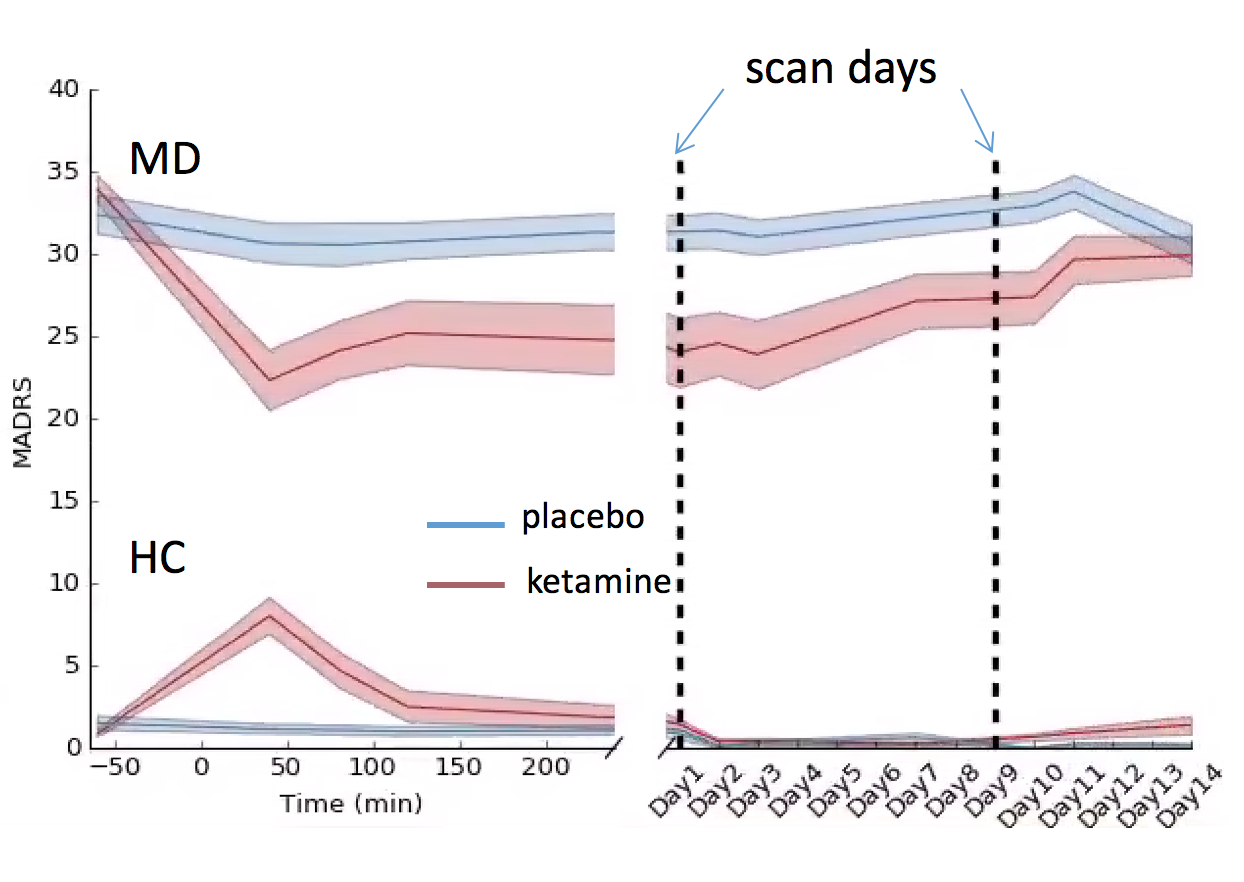
Figure 2 shows the group MADRS scores over the course of the study with the baseline scan occurring before the infusion and further imaging time points indicated by the dashed lines. The curve reproduces what has been seen in the literature[6], and the MADRS score corresponding to the first scan after the drug infusion shows the largest change, improvement in depression, compared to baseline.
The average metabolite concentrations, referenced to creatine, for glutamate (Glu) and glutamine (Gln) are shown in Figure 3 for MD, HC at each scan – adjusted for patient age. A significant difference between the groups was found for Glu, where MD subjects had greater Glu levels than HC, but not Gln. Glutamate and glutamine show a trend towards increase in depressed subjects post-ketamine infusion in comparison to baseline but not in healthy subjects. Notably, the post-placebo measurement of glutamate differs from baseline for both groups.
Reported glutamate levels in patients with severe MD in the ACC are frequently found to be lower[7],[8] than those of HC but may vary according to depression type[7] and exact location of the MRS voxel. These studies have been primarily performed at lower field strengths <3T with lower signal-to-noise, which may account for part of this difference. Also, patients with MD have been shown to have reduced grey matter volumes pregenual and subgenual ACC in some, but not all cohorts[9], which may also account for some variance. A prior validation study of the methodology used here demonstrated that the measurement should be accurate to 10%[10], thus the spread in values reported here are not likely accounted for by methodological error.
Conclusion
We found increased glutamate levels in MD subjects at baseline compared to HC. Additionally, MD subjects, but not HC, show increases over baseline several days post-ketamine infusion. However, the high levels of glutamate in the placebo (saline) condition in both groups still need to be fully explained. A refinement in the results may be obtained by accounting for the percentage of gray matter in the MRS voxel in the model. Our findings may help guide future investigations of the mechanism of action of ketamine.Acknowledgements
This research was funded by the NIMH Intramural Research ProgramReferences
[1] P. Glue, A. Gulati, M. Le Nedelec, and S. Duffull, “Dose- and Exposure-Response to Ketamine in Depression,” Biological Psychiatry, vol. 70, no. 4. pp. e9–e10, 2011.
[2] D. A. Pizzagalli, “Frontocingulate Dysfunction in Depression: Toward Biomarkers of Treatment Response,” Neuropsychopharmacology, vol. 36, no. 1, pp. 183–206, Jan. 2011.
[3] J. J. Wong, O. O’Daly, M. A. Mehta, A. H. Young, and J. M. Stone, “Ketamine modulates subgenual cingulate connectivity with the memory-related neural circuit-a mechanism of relevance to resistant depression?,” PeerJ, vol. 4, p. e1710, 2016.
[4] L. An, S. Li, J. B. Murdoch, M. F. Araneta, C. Johnson, and J. Shen, “Detection of glutamate, glutamine, and glutathione by radiofrequency suppression and echo time optimization at 7 tesla,” Magn. Reson. Med., vol. 73, no. 2, pp. 451–458, Feb. 2015.
[5] R Core Team, “R: A Language and Environment for Statistical Computing.” Vienna, Austria, 2013.
[6] C. A. Zarate, J. B. Singh, P. J. Carlson, N. E. Brutsche, R. Ameli, D. A. Luckenbaugh, D. S. Charney, and H. K. Manji, “A randomized trial of an N-methyl-D-aspartate antagonist in treatment-resistant major depression.,” Arch. Gen. Psychiatry, vol. 63, no. 8, pp. 856–64, Aug. 2006.
[7] D. I. Horn, C. Yu, J. Steiner, J. Buchmann, J. Kaufmann, A. Osoba, U. Eckert, K. C. Zierhut, K. Schiltz, H. He, B. Biswal, B. Bogerts, and M. Walter, “Glutamatergic and resting-state functional connectivity correlates of severity in major depression - the role of pregenual anterior cingulate cortex and anterior insula.,” Front. Syst. Neurosci., vol. 4, 2010.
[8] J. J. Luykx, K. G. Laban, M. P. van den Heuvel, M. P. M. Boks, R. C. W. Mandl, R. S. Kahn, and S. C. Bakker, “Region and state specific glutamate downregulation in major depressive disorder: A meta-analysis of 1H-MRS findings,” Neurosci. Biobehav. Rev., vol. 36, no. 1, pp. 198–205, 2012.
[9] W. C. Drevets, J. Savitz, and M. Trimble, “The subgenual anterior cingulate cortex in mood disorders.,” CNS Spectr., vol. 13, no. 8, pp. 663–81, Aug. 2008.
[10] N. Lally, L. An, D. Banerjee, M. J. Niciu, D. A. Luckenbaugh, E. M. Richards, J. P. Roiser, J. Shen, C. A. Zarate, and A. C. Nugent, “Reliability of 7T 1 H-MRS measured human prefrontal cortex glutamate, glutamine, and glutathione signals using an adapted echo time optimized PRESS sequence: A between- and within-sessions investigation,” J. Magn. Reson. Imaging, vol. 43, no. 1, pp. 88–98, Jan. 2016.
[11] R. Cox, “AFNI: software for analysis and visualization of functional magnetic resonance neuroimages,” Comput. Biomed. Res., vol. 29, no. 3, pp. 162–73, 1996.
[12] G. Chen, Z. S. Saad, J. C. Britton, D. S. Pine, and R. W. Cox, “Linear mixed-effects modeling approach to FMRI group analysis.,” Neuroimage, vol. 73, pp. 176–90, Jun. 2013.
Figures