4215
Localized connectivity in obsessive-compulsive disorder: An insight from univariate and multivariate pattern analyses1Department of Radiology, Huaxi MR Research Center (HMRRC), West China Hospital of Sichuan University, Chengdu, People's Republic of China, 2Department of Psychiatry, Mental Health Center, West China Hospital of Sichuan University, Chengdu, People's Republic of China
Synopsis
The current study, for the first time, integrated voxel-wise univariate analysis and multivariate pattern classification approach to evaluate the alterations of localized neural connectivity in a relatively large sample of drug-naive patients with obsessive-compulsive disorder (OCD). Our findings (i) suggested the disequilibrium between the fronto-parietal circuit and the cerebellum might be associated with the pathophysiology of OCD, (ii) indicated the translational role of the localized neural connectivity as a potential discriminative pattern to identify OCD at the individual level and (iii) highlighted the hyperactivation of the prefrontal cortex in the pathophysiologic process of OCD.
Target Audience
Those who are interested in translational research of utilizing magnetic resonance imaging techniques in mental disorders.Introduction
Resting-state fMRI (Rs-fMRI) studies investigating the pathophysiology of obsessive-compulsive disorder (OCD) have identified prominent abnormalities in the cortico-striato-limbic network [1]. However, it is unclear whether localized dysfunction of specialized brain regions contribute to network-level abnormalities. Thus, the present study aims to explore the changes of regional homogeneity (ReHo) [2], a measure of localized intraregional connectivity obtained from Rs-fMRI, in a relatively large sample of drug-naive OCD patients. Moreover, we utilize multivariate pattern analysis (MVPA) technique known as support vector machine (SVM) [3] to examine whether ReHo could be further used to distinguish OCD patients from healthy control subjects (HCS) at individual level.Methods
The study was approved by the local ethical committee and written informed consent was obtained from all subjects. A total of 88 drug-naive OCD patients and 88 age, sex, handedness and years of education well matched HCS were recruited. The diagnoses of OCD patients were determined by using the structured clinical interview patient edition according to DSM-IV. Clinical symptoms were evaluated using the Yale-Brown Obsessive-Compulsive Scale (Y-BOCS). The MRI examinations were performed via a 3-Telsa GE MRI system with an 8 channel phase array head coil. The Rs-fMRI sensitized to changes in the blood oxygen level dependent (BOLD) signal levels were obtained via a GE-EPI sequence (TR/TE=2000/30msec, flip angle=90°, slice thickness=5mm with no gap, 30 axial slices, 200 volumes in each run). Subjects were instructed to relax with their eyes closed without falling asleep during MR examination. The ReHo maps were calculated using DPARSF [4] software (http://www.restfmri.net) for each subject.
Initially, we performed a standard univariate approach to explore alterations of localized neural connectivity by comparing ReHo maps between OCD patients and HCS with the voxel-based two-sample t-test in SPM8 (http://www.fil.ion.ucl.ac.uk/spm). The statistical threshold was set at P < 0.05, corrected for multiple comparisons with family wise error (FWE) at the cluster level. Brain areas with significant ReHo differences between groups were extracted as region-of-interest for Pearson correlation analyses with symptom severity evaluated by Y-BOCS and subscale scores.
Additionally, an MVPA implemented in the PROBID software package (http://www.brainmap.co.uk/probid.htm) was used to investigate the classification accuracy of the localized connectivity in distinguishing individuals with OCD from HCS. The PROBID software takes the SVM analytical method to find a spatially distributed pattern of regions with maximal classification weights and discriminates patients from controls using leave-one-out cross-validation. The statistical significance of classification accuracy was set at P < 0.001 after permutation testing (1000 times).
Results
Relative to HCS, OCD patients showed lower ReHo in bilateral cerebellum and higher ReHo in bilateral superior frontal gyri (SFG), right supramarginal gyrus and precuneus. (P < 0.05, with FWE correction at the cluster level) (Fig A & Fig B). Meanwhile, the ReHo value in the left SFG positively correlated with Y-BOCS (r = 0.241, P = 0.024) and obsessive subscale (r = 0.224, P = 0.036) (Fig C).
The SVM classification regarding ReHo yielded an accuracy of 78.98% (sensitivity = 78.41%, specificity = 79.55%) with P< 0.001 after permutation testing. (Fig D). The most discriminating regions of ReHo mainly located in frontal, temporal, parietal regions as well as cerebellum, while the right orbital frontal gyrus (OFG) was identified with the highest discriminative power (Fig E). Across all of the patients, no significant correlation was found between the test margin (the shortest distance from the optimal hyperplane) and symptom severity (P > 0.05).
Disscussion and Conclusion
To the best of our knowledge, this is the first study to integrate voxel-wise univariate analysis and multivariate pattern classification approach to evaluate the alterations of localized neural connectivity in a relatively large sample of drug-naive OCD patients. Our findings suggested the disequilibrium between the fronto-parietal circuit and the cerebellum might be associated with the pathophysiology of OCD. Additionally, the current study indicated the translational role of the localized neural connectivity as a potential discriminative pattern to identify OCD at the individual level. Finally, the positive correlation between ReHo in the left SFG and symptom severity, together with the highest discriminative power in the right OFG highlighted the hyperactivation of the prefrontal cortex in the pathophysiologic process of OCD.Acknowledgements
This study was supported by the National Natural Science Foundation (Grant No. 81621003, 81671669, 81171488, 81227002, and 81220108013), the National Key Technologies Research and Development Program of China (Program No. 2012BAI01B03) and Program for Changjiang Scholars and Innovative Research Team in University (PCSIRT, Grant No. IRT1272) of China. Dr. Qiyong Gong would like to acknowledge his Visiting Adjunct Professor appointment in the Department of Psychiatry at the Yale School of Medicine, Yale University, USA.References
[1] Menzies, L, et al. (2008) Neurosci Biobehav Rev.32: 525-549.
[2] Zang, Y, et al. (2004) Neuroimage. 22: 394-400.
[3] Orru, G, et al. (2012) Neurosci Biobehav Rev. 36:1140-1152.
[4] Yan CG, et al. (2010) Front Syst Neurosci. 4:13.
Figures
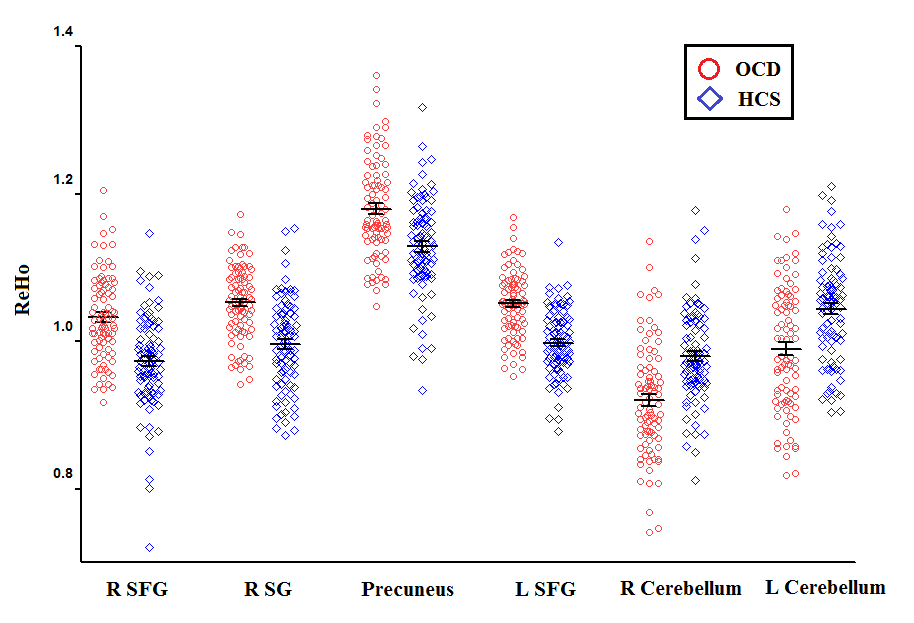
Figure (A): Eigenvalues of ReHo distribution in six brain areas with altered ReHo between patients with OCD and HCS.
Abbreviations: HCS, healthy control subjects; OCD, obsessive-compulsive disorder; ReHo, regional homogeneity; SFG, superior frontal gyrus; SG, supramarginal gyrus.
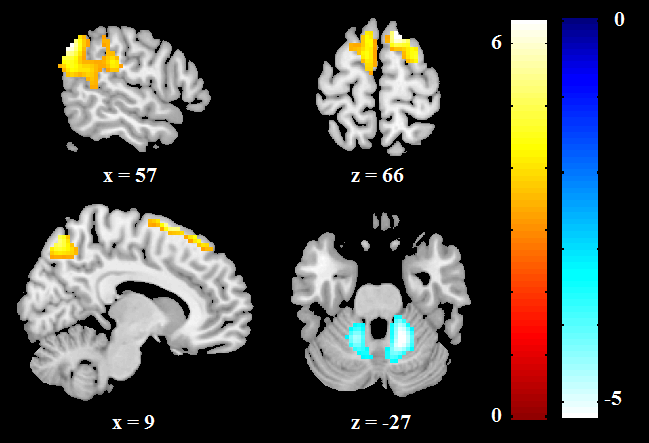
Figure (B): Altered ReHo in OCD patients compared with HCS. ReHo increases are indicated in warm colors while ReHo reductions are indicated in cool colors.
Abbreviations: HCS, healthy control subjects; OCD, obsessive-compulsive disorder; ReHo, regional homogeneity.
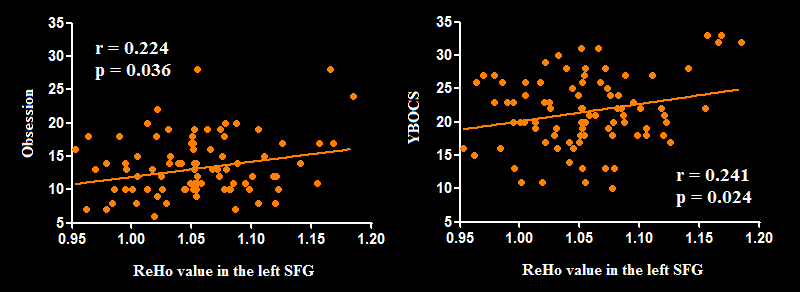
Figure (C): Pearson correlation exhibiting positive correlation between ReHo in the left SFG and YBOCS as well as obsessive subscale scores in the OCD group.
Abbreviations: OCD, obsessive-compulsive disorder; ReHo, regional homogeneity; SFG, superior frontal gyrus; YBOCS, Yale-Brown Obsessive Compulsive Scale.
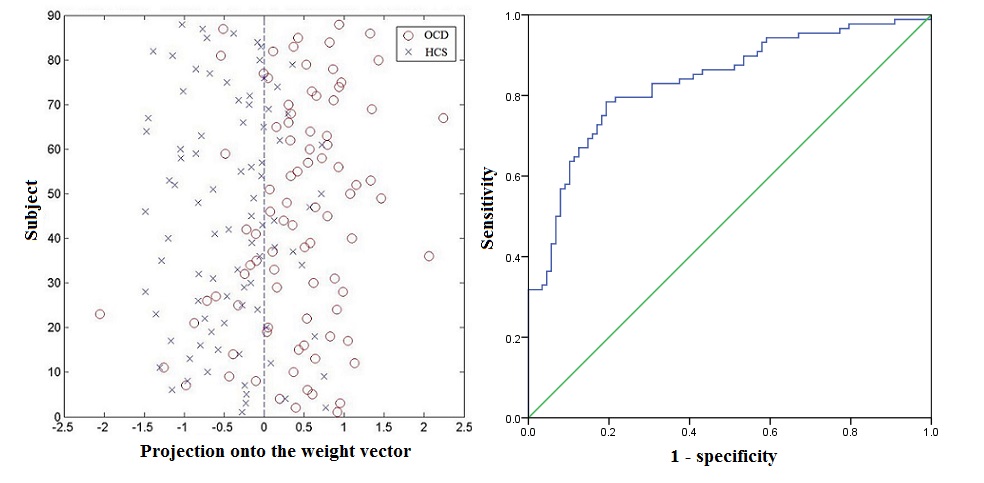
Figure (D): Classification plot (left) and receiver operating characteristic (ROC) curve (right) for the discrimination between OCD patients and HCS using ReHo maps, yielding an accuracy of 78.98% (sensitivity = 78.41%, specificity = 79.55%, P < 0.001).
Abbreviations: HCS, healthy control subjects; OCD, obsessive-compulsive disorder; ReHo, regional homogeneity.
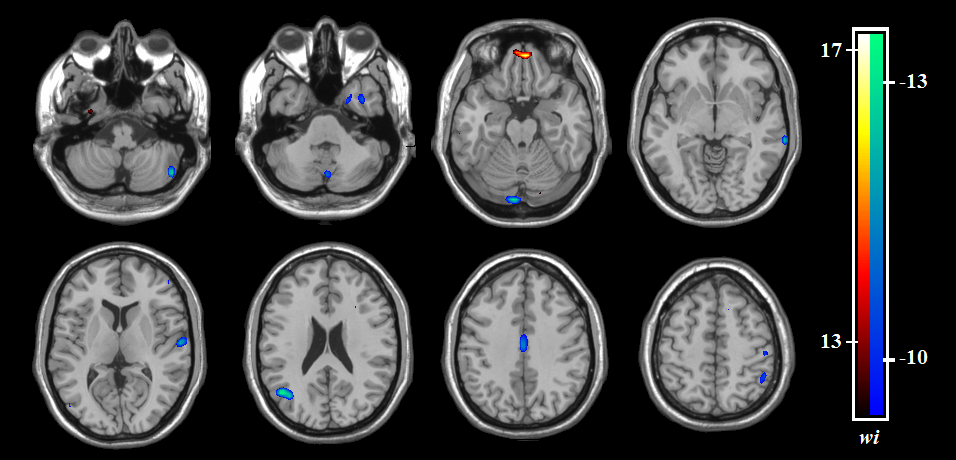
Figure (E): The discrimination maps for ReHo. These regions were identified by setting the threshold to the top 30% of the ReHo weight vector scores. Warm colors (positive weights) indicated higher discriminated values for OCD patients than HCS. Cool colors (negative weights) indicates lower discriminated values for OCD patients than HCS.
Abbreviations: HCS, healthy control subjects; OCD, obsessive-compulsive disorder; ReHo, regional homogeneity.