4211
Decreased Brain Nicotinamide Adenine Dinucleotide (NAD) Levels in Adolescent Bipolar Disorder1Brain Institute, Salt Lake City, UT, United States, 2University of Utah Department of Psychiatry, Salt Lake City, UT, United States, 3Veterans Administration Rocky Mountain MIRECC for Suicide Prevention, Salt Lake City, UT, United States
Synopsis
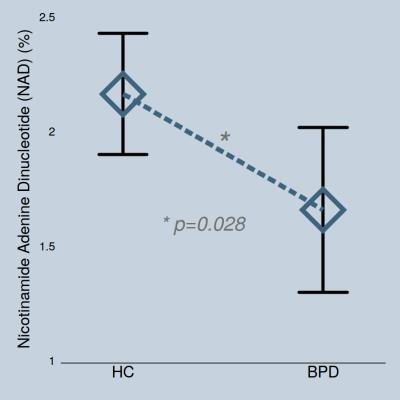
Converging evidence implicates mitochondrial dysfunction in bipolar disorder (BPD). Treatments of adolescent BPD have limited efficacy, and are associated with significant toxicity. Phosphorus magnetic spectroscopy imaging (31P MRSI) may shed light on the pathophysiology and neural markers of adolescent BPD. In the present study, nicotinamide adenine dinucleotide (NAD) levels were measured using 31P MRSI in 15 adolescents with BPD and 23 healthy controls (HC). BPD adolescents had significantly decreased NAD levels compared to HC. Clinical trials of NAD precursors are required to determine whether restoration of NAD levels is feasible, and can serve as a treatment for adolescent BPD.
Purpose
Bipolar disorder (BPD), also known as manic depressive disorder, is a devastating mental illness marked by alternating shifts in mood and energy levels. Antidepressants may trigger a manic episode in adolescents with depressive BPD who have a genetic predisposition. Also, early initiation of pharmacotherapy in children and adolescents may result in long-term side effects, noncompliance, and treatment resistance. Thus, both effective and well-tolerated pharmacologic treatments constitute an unmet need in adolescent BPD. Converging evidence indicates that BPD pathophysiology involves mitochondrial dysfunction.1 Nicotinamide adenine dinucleotide (NAD) is an important coenzyme for high energy phosphate metabolism and reductive biosynthesis in central nervous system.2,3 NAD reinforces the anti-oxidant defense of cells and also has been implicated in apoptosis and gene expression.4,5 In the present study, we have sought to measure whole-brain NAD levels in adolescents with BPD. It was hypothesized that adolescents with BPD would have decreased NAD levels as compared to healthy controls (HC).
Methods
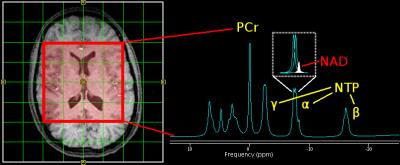
A total of 15 adolescents with BPD (age=16.1±1.2) and 23 HC adolescents (age=15.9±1.8) were enrolled in the present study and underwent phosphorus magnetic spectroscopy imaging (31P MRSI). 31P MRSI studies were performed using a 3 Tesla Siemens system. The spectra were obtained with a two-dimensional chemical shift imaging free induction decay (2D CSI FID) pulse sequence, field of view=200×200×25 mm3, TR/TE=3000/2.3 ms, vector size=1024, sampling bandwidth=2500 Hz, data collection time=17 minutes and number of averages=36, using a 31P/1H double-tuned volume head coil (Clinical MR Solutions LLC, Brookfield, WI). The proton channel was used for localization, anatomic imaging and shimming. Shimming was performed over the whole excited brain volume. NAD Spectroscopic Analysis: To reduce signal contamination from neighboring voxels, 75% Hamming filter was applied before performing 2D Fast Fourier Transform on raw data and then each data was filtered with 2 Hz line broadening. After Fourier transformation and frequency shifts correction, baseline correction with polynomial interpolation was applied. Prior to summing voxels of interest (Figure 1), zero-order and first-order phase corrections were applied. The preprocessed 31P MRSI data was fit using jMRUI software with the AMARES algorithm. NAD peak (NAD+NADH) was given a fixed linewidth offset relative to phosphocreatine (PCr). Data were expressed as a ratio (%) relative to the total phosphate pool.
Results
NAD levels in adolescents with BPD (1.66±0.69) were significantly lower than those in the healthy controls (2.16±0.6) (p=0.028, Figure 2). The statistical significance in BPD group was maintained after controlling for age (p=0.030). Inter-subject coefficient of variation of NAD was relatively high (28.8%), but this likely reflects the difference in NAD concentrations between subjects. We repeated our statistical analysis using PCr as a denominator to ensure data reliability, with findings remaining the same (i.e., decreased NAD/PCr levels in adolescent BPD, p=0.018). Also, to ensure that the total pool of phosphate are not different between groups, absolute measurements (institutional unit) of total phosphates were compared between the groups, with no group differences in total phosphate pools (p=0.415). There were no significant group differences in PCr (p=0.944) and β nucleoside triphosphate (NTP) levels (p=0.326).Discussion
These preliminary data are consistent with the mitochondrial dysfunction that has been reported in BPD.1 It is reported that during photic stimulation, the occipital lobe in BPD patients shows an abnormal response in high-energy phosphate metabolism.6 Also, current findings are in line with the prior 31P spectroscopy report of a reduced NAD/NADH ratio in schizophrenia.7 Nicotinamide and nicotinic acid (collectively termed niacin) are vitamin precursors of NAD and available as over-the-counter nutritional supplements. Clinically, niacin deficiency is associated with psychiatric symptoms including anxiety and depressive disorders, as well as psychosis.8 The exact molecular mechanism has yet to be elucidated, but decreased NAD levels may confer an increased vulnerability to oxidative insult in BPD since NAD provides neuroprotection as an antioxidant due to its free radical chain-breaking properties and prevents the initiation of free radical generation. It is reported that chronic administration of mood stabilizers such as lithium and valproate significantly increases levels of neuroprotective/neurotropic proteins such as brain-derived neurotrophic factor (BDNF) and bcl-2.9 Interestingly, niacin up-regulates BDNF.10 Also, bcl-2 positive mitochondria contain larger quantities of NAD11 and bcl-2 gene expression increases mitochondrial NAD.3 Taken together, the present 31P spectroscopic data supports future studies to develop novel treatment strategies for adolescent BPD.Conclusion
The current study provides preliminary evidence that implicates decreased NAD levels as a neural correlate of adolescent BPD. Clinical trials featuring translational measurement of NAD levels with in vivo 31P MRSI are warranted, to explore the potential of NAD precursors to serve as a novel and hypothesis-generated treatment for adolescent BPD.Acknowledgements
Supported by NIMH grant MH058681 (PFR), NARSAD Young Investigator Award (DGK), and Utah Science Technology and Research Initiative.References
1. Stork C, Renshaw PF. Mitochondrial dysfunction in bipolar disorder: evidence from magnetic resonance spectroscopy research. Mol Psychiatry. 2005;10(10):900-919.
2. Belenky P, Bogan KL, Brenner C. NAD+ metabolism in health and disease. Trends Biochem Sci. 2007;32(1):12-19.
3. Esposti MD, Hatzinisiriou I, McLennan H, Ralph S. Bcl-2 and mitochondrial oxygen radicals. New approaches with reactive oxygen species-sensitive probes. The Journal of biological chemistry. 1999;274(42):29831-29837.
4. Szabo C. Mechanisms of cell necrosis. Crit Care Med. 2005;33(12 Suppl):S530-534.
5. Zhang Q, Piston DW, Goodman RH. Regulation of corepressor function by nuclear NADH. Science. 2002;295(5561):1895-1897.
6. Yuksel C, Du F, Ravichandran C, Goldbach JR, Thida T, Lin P, Dora B, Gelda J, O'Connor L, Sehovic S, Gruber S, Ongur D, Cohen BM. Abnormal high-energy phosphate molecule metabolism during regional brain activation in patients with bipolar disorder. Mol Psychiatry. 2015;20(9):1079-1084.
7. Kim SY, Cohen BM, Chen X, Lukas SE, Shinn AK, Yuksel AC, Li T, Du F, Ongur D. Redox Dysregulation in Schizophrenia Revealed by in vivo NAD+/NADH Measurement. Schizophr Bull. 2016.
8. Prakash R, Gandotra S, Singh LK, Das B, Lakra A. Rapid resolution of delusional parasitosis in pellagra with niacin augmentation therapy. Gen Hosp Psychiatry. 2008;30(6):581-584.
9. Chen G, Zeng WZ, Yuan PX, Huang LD, Jiang YM, Zhao ZH, Manji HK. The mood-stabilizing agents lithium and valproate robustly increase the levels of the neuroprotective protein bcl-2 in the CNS. Journal of neurochemistry. 1999;72(2):879-882.
10. Fu L, Doreswamy V, Prakash R. The biochemical pathways of central nervous system neural degeneration in niacin deficiency. Neural regeneration research. 2014;9(16):1509-1513.
11. Kowaltowski AJ, Vercesi AE, Fiskum G. Bcl-2 prevents mitochondrial permeability transition and cytochrome c release via maintenance of reduced pyridine nucleotides. Cell death and differentiation. 2000;7(10):903-910.
Figures

Figure 1. (Left) Axial view of 2D 31P MRSI grid placement and voxels of interest. (Right) A representative illustration of 31P spectra, which shows a nicotinamide adenine dinucleotide (NAD) peak embedded with two J-coupled α-nucleoside triphosphate (NTP) resonance peaks. Other high-energy phosphate metabolites such as phosphocreatine (PCr) and β and γ NTP as well as phospholipid metabolism such as phosphomonoesters (PME) and phosphodiesters (PDE), and inorganic phosphate (Pi) are displayed.
