4209
Elevated Glycine and Glutamate Metabolite Levels in Patients with First-Episode Psychotic Disorders Measured by TE-averaged PRESS at 4 T1McLean Imaging Center, McLean Hospital, Harvard Medical School, Belmont, MA, United States, 2Psychotic Disorders Division, McLean Hospital, Harvard Medical School, Belmont, MA, United States, 3Translational Imaging Laboratory, McLean Hospital, Harvard Medical School, Belmont, MA, United States, 4Program for Neuropsychiatric Research, McLean Hospital, Harvard Medical School, Belmont, MA, United States, 5Laboratory for Psychiatric and Molecular Neuroscience, McLean Hospital, Harvard Medical School, Belmont, MA, United States
Synopsis
In this work, we present the advantage of TE-averaged PRESS approach to reliably quantify brain glutamate and glycine levels in vivo in patients with psychosis. Since glutamtergic dysregulation and NMDA receptor hypofunction are implicated in the pathophysiology of major psychiatric conditions, non-invasive in vivo assessments of glutamate and its NMDA receptor modulator, glycine, would be of great importance. We found significantly elevated glutamate and glycine levels in the anterior cingulate cortex and parieto-occipital cortex of patients with first-episode psychosis as compared to healthy controls, suggesting increased brain glutamatergic activity with compensatory attempts to correct for NMDA receptor hypofunction.
Purpose
A large body of evidence suggests that glutamatergic dysregulation, and NMDA receptor hypofunction in particular, are involved in the pathophysiology of major psychiatric diseases, notably including schizophrenia and bipolar disorder. Glycine (Gly) is an amino acid neurotransmitter that acts as a co-agonist of the glutamate (Glu) NMDA receptor. Therefore, it would be great of interest to simultaneously measure brain Glu and Gly levels in vivo1. To date, Glu findings in patients with psychosis measured by proton MR spectroscopy (1H-MRS) are inconsistent, possibly due to differences in acquisition methods, voxel placement, stage of illness, and medication status2-4. The reliable detection of Gly in vivo with conventional single-echo 1H-MRS is difficult due to its low concentration (0.4 – 1.0 mM) and its spectral overlap with myo-inositol. In this work, we aimed to simultaneously quantify Glu and Gly levels in patients with psychosis using TE-averaged PRESS at 4 T and assess possible correlations between Glu and/or Gly levels, diagnosis and clinical symptom severity.Methods
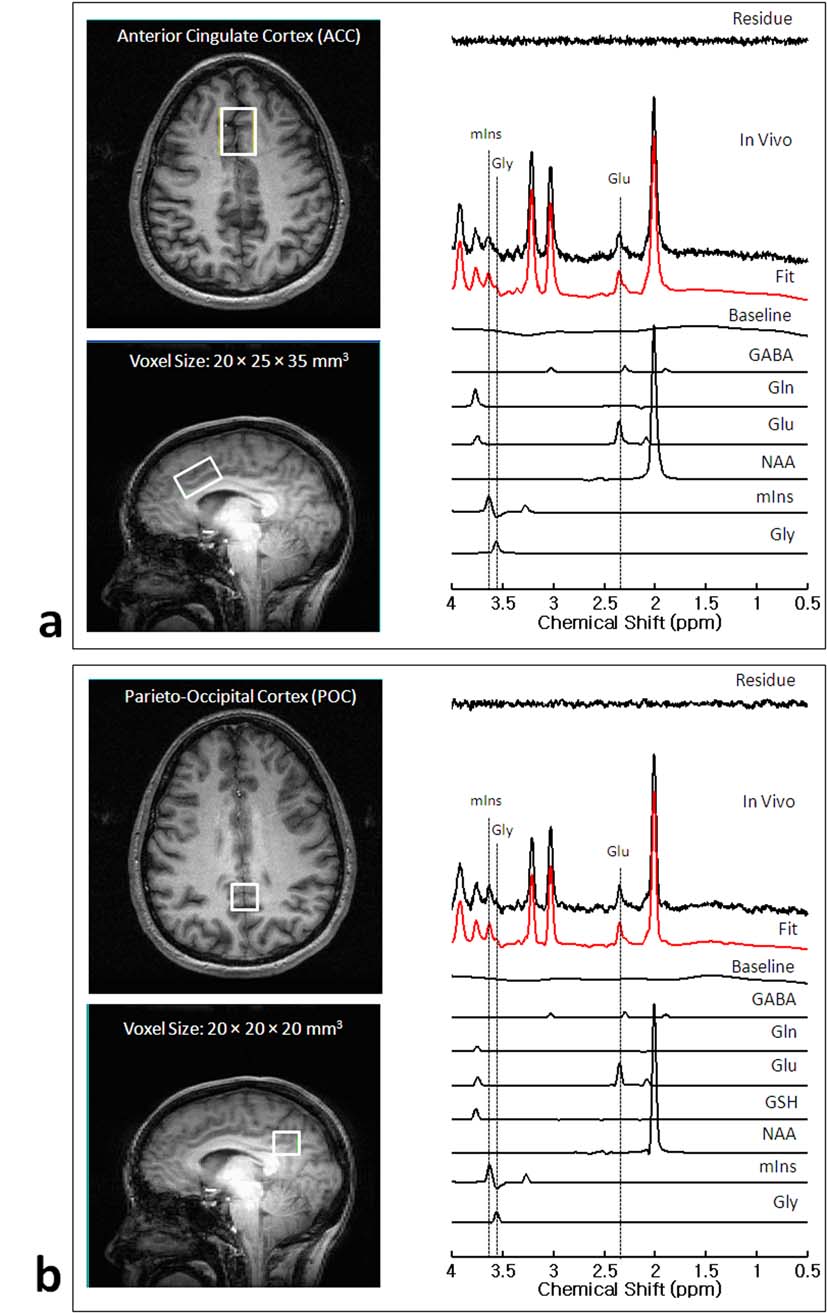
The participants included 55 healthy controls and 54 patients with first-episode psychosis (21 schizophrenia and 33 bipolar disorder). High-contrast T1-weighted axial and sagittal images (TE/TR=6.2/11.4 ms, FOV=22×22×16 cm3, readout-duration= 4 ms, receive bandwidth= ±32 kHz, matrix size=256×256×64, in-plane resolution= 0.94×0.94, slice thickness=2.5 mm, flip angle=11°) were acquired to serve as an anatomical guide to positioning MRS voxels, which were placed on anterior cingulate cortex (ACC) with voxel size of 20×25×35 mm3 and parieto-occipital cortex (POC) with voxel size of 20×20×20 mm3. A modified PRESS sequence employing four-pulse WET water suppression was used for the collection of 24 TE-stepped spectra with the echo-time ranging from 30 to 490 ms in 20 ms increments. The MRS acquisition parameters were: TR=2.0 sec, spectral width= 2kHz, NEX=16, and total scan time= 13 min. The metabolite concentrations were quantified by LCModel software, scaling to the water signal. The following metabolites were included in the simulated basis set: NAA, Cr, PCr, GPC, PCh, mIns, Tau, Glu, Gln, GSH, GABA, Gly, Glc, Asp, Ala, Lac. Any proton spectra with severe baseline distortion, low SNR or CRLB of Gly higher than 30 % were excluded from further statistical analysis.Results and Discussion
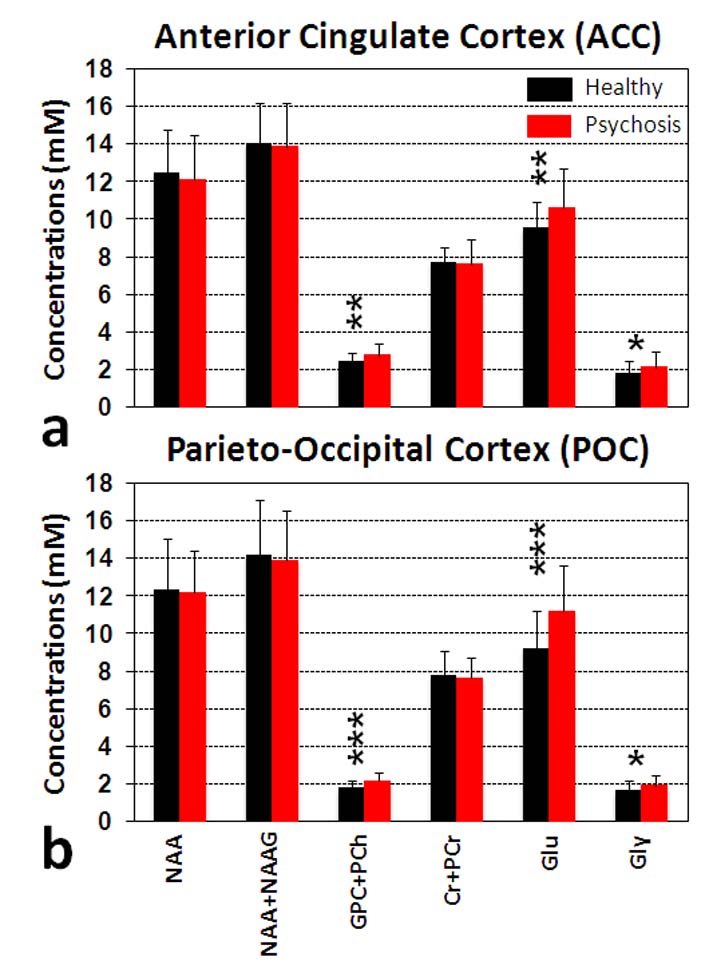
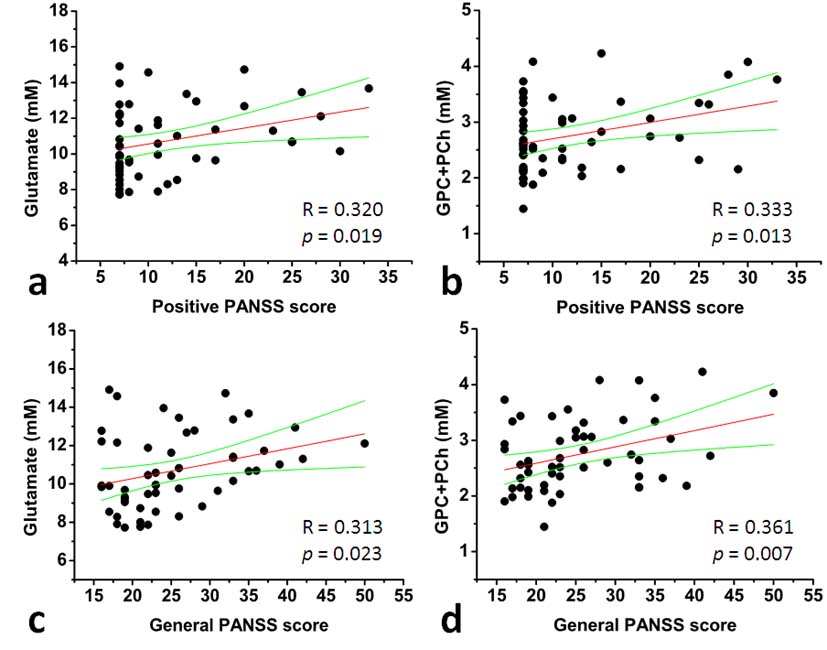
Figure 1 shows representative 1H spectra and individual fits obtained from ACC (Figure 1-a) and POC (Figure 1-b) with voxel locations noted in the anatomical images. By using a TE-averaged PRESS approach, the Glu signal at 2.35 ppm is “purely” presented as a single-line resonance not overlapping NAA, Gln, GSH or GABA signals. Furthermore, the Gly resonance at 3.55 ppm is clearly resolved with minimal contamination from the mIns resonance at 3.61 ppm. The mean CRLB for the Gly peak was 10.4 ± 2.5 % (range: 5-17%). Figure 2 shows the comparison of metabolite levels between healthy controls (N=55) and psychosis patients (N=54). We found significantly higher Glu, GPC+PCh and Gly levels in both brain regions (ACC and POC) of patients with psychosis compared to healthy controls, but no differences in NAA and Cr+PCr levels. In addition, we performed subgroup analysis by dividing the psychosis group into schizophrenia (N=21) and bipolar disorder subgroups (N=33) and found no significant differences in Glu and Gly levels between schizophrenia and bipolar disorder patients (One-Way ANOVA test with Bonferroni correction, p>0.05) (data not shown). We investigated the relationship between neurometabolite levels and Positive and Negative Syndrome Scale (PANSS) scores in patients with psychosis. As shown in Figure 3, Glu and GPC+PCh levels in ACC are positively correlated with positive (a and b) and general PANSS scores (c and d) of patients with psychosis. The most striking finding in this work is the observation of increased Gly levels in the brains of patients with psychosis. This finding is consistent with previous studies showing the elevation of Gly in cerebrospinal fluid5 and postmortem orbitofrontal cortex6 in schizophrenia patients. As Gly positively modulates Glu activation at NMDA receptor, increased Gly levels might be attributable to an endogenous compensatory mechanism to correct NMDA hypofunction in patients with psychosis – although alternative explanations are possible.Conclusion
In summary, by taking advantage of the TE-averaged PRESS approach, we reliably quantified brain Glu and Gly levels and found significantly elevated Glu and Gly levels in the ACC and POC of patients with first-episode psychosis as compared to healthy controls, suggesting altered brain glutamatergic activity and possible compensation for NMDA receptor hypofunction. Pharmacologic approaches to treat psychosis through glycine analogues have shown some promise. Further research, such as monitoring the response of brain Gly and Glu levels following administration of Gly transport inhibitors, would be of great interest.Acknowledgements
This work was supported by grants from MH094594 (D.O.); MH104449 (D.O.); Program for Neuropsychiatric Research (B.M.C.).References
1. Coyle JT et al., Psychopharmacology. 2004; 174:32– 38.
2. Theberge J et al., Am J Psychiatry. 2002; 159:1944–1946.
3. Egerton A et al., Neuropsychopharmacology. 2012a; 37:2515–2521.
4. Kegeles LS et al., Arch Gen Psychiatry. 2012; 69:449–459.
5. Reveley MA et al., Biol Psychiatry 1987;22:413–420.
6. Kurumaji A et al., Neurochem Int 1996;29:239 –245.
Figures