4208
Individual metabolic differences in murine nucleus accumbens (NAc) measured by 1H-MRS at 14.1 Tesla is associated with trait-anxiety levelsAntoine Cherix1, Thomas Larrieu2, Arantxa Duque Moreno3, Hongxia Lei4, Santiago Moléon3, Carmen Sandi2, and Rolf Gruetter1,5,6
1Laboratory for Functional and Metabolic Imaging (LIFMET), Ecole Polytechnique Fédérale de Lausanne, Lausanne, Switzerland, 2Laboratory of Behavioral Genetics (LGC), Ecole Polytechnique Fédérale de Lausanne, Lausanne, Switzerland, 3Department of Psychobiology, University of Valencia, Valencia, Spain, 4Center for Biomedical Imaging (CIBM), Ecole Polytechnique Fédérale de Lausanne, Lausanne, Switzerland, 5Department of Radiology, University of Geneva, Geneva, Switzerland, 6Department of Radiology, University of Lausanne, Lausanne, Switzerland
Synopsis
1H-MRS was used to study metabolic changes associated with basal anxiety levels in nucleus accumbens (NAc) and medial prefrontal cortex (mPFC) of naive mice. Results indicate some neuroenergetic differences specific to the NAc, which supports the idea that this structure plays a critical role in the etiology of anxiety.
Introduction
Nucleus accumbens (NAc) is a key structure that contributes to the etiology of mood and anxiety disorders1,2. Proton magnetic resonance spectroscopy (1H-MRS) is a very promising tool to study neurochemistry in vivo and has a true potential to reveal metabolic alterations associated with psychiatric disease3. Current spectroscopy studies on human lack however the power to describe the alterations of molecular and cellular mechanisms underlying the visible metabolic changes. Animal models are thus of great importance to provide a link between visible biomarkers and their biological meaning. The aim of this study was to investigate metabolic differences associated with basal anxiety in the NAc of naive mice and to compare it with medial prefrontal cortex (mPFC), a region known to be very sensitive to stress.Methods
All animal studies were performed with the approval of local animal care and use committee. We first segregated naïve C57bl/6J male mice (n=28) of around 8 weeks for their trait-anxiety using a standardized Light Dark Test (LDT)4. The time spent in the lit compartment of the LD box was used to assess anxiety-like behaviour and mice were separated into high susceptible (HS) and low susceptible (LS) based on the median5. After a resting period of a week, 1H-MRS scan was conducted and metabolites concentrations were measured in both the nuclei accumbens and mPFC of anesthetized mice at 14.1T 6. Animals under isoflurane anesthesia (1-2%) were fixed in holder with a bite piece and two ear bars and anatomical MR images were obtained using T2-weighted FSE images (15×0.4mm slices, TEeff /TR=43/2000ms, averages=2). This set of images was used to localize the volumes of interests (VOIs), i.e. mPFC (1.7x1.4x1.2 mm3) and NAc (1.4x4.1x1 mm3). After adjusting field inhomogeneity to reach a water linewidth under 24Hz on the target VOI, localized 1H MRS was applied using SPECIAL sequence (TE/TR=2.8/4000ms) 7. Full width at half maximum (FWHM) measured on the water signal was 15±1 Hz for mPFC and 18±2 Hz for NAc. Scan time was around 20 minutes for NAc and 25 minutes for mPFC, in order to reach satisfactory Signal to noise ratio (SNR) i.e. >10. The spectral data were frequency corrected and summed for quantification using LCMODEL referencing the endogenous water (80% in brain tissue) from the identical VOI. Cramér-Rao lower bounds (CRLB) > 50% were considered not reliable. Statistical comparison was done between these two groups (Student t test) as well as correlations between anxiety and metabolite levels.Results
Based on T2 images, bilateral NAc were clearly identified (Fig 1). SNR of in vivo spectra was 15±3 for PFC and 17±2 for NAc with time of acquisition of 25 and 20 minutes respectively. The resulting FWHM were 0.018 ppm (11Hz) for mPFC and 0.020 ppm (12Hz) for NAc, both of which were close to the difference between the 3.9 ppm resonance peaks of phosphocreatine (PCr) and creatine (Cr) (i.e. 0.017ppm) allowing to differentiate them. Together with the ability to visually see these two peaks, the obtained resolution indicate a robust and reliable PCr/Cr measurement. Results indicate strong regional differences in the metabolic profile, mainly in the levels of taurine and glutamate/GABA. Trait-anxiety showed a Gaussian distribution in the sample with a median of 133s regarding the time spent in lit compartment. Anxiety-related behaviour negatively correlated with the PCr/Cr ratio (p=0.01, R=0.51) and was significantly increased in the HS as compared to LS individuals (Unpaired t-test, two tailed t=2.46, p=0.02*). Finally, we also found that glutamate, glutamine (as well as the sum Glx) and taurine concentrations tend to be higher in HA than LA mice specifically in the NAc.Discussion
The high levels of GABA in NAc can be explained by the abundance of GABAergic neurons (~95% of the neurons), which is a particularity of this structure. This study showed that natural variation in trait-anxiety of a group of naïve mice was associated with metabolic changes that are visible in 1H-MRS in the NAc but not the mPFC. Increased phosphocreatine levels might reflect a higher mitochondrial activity as would be expected in a region with high energy demands. This observation was in line with previous findings suggesting a critical role of mitochondria in the NAc related to anxiety in rats7. In our knowledge, this is the first study showing a direct link between individual differences in basal anxiety and metabolic activity in the NAc of mice in vivo. Finally, this work has the potential of discovering important targets to treat behavioural dysfunctions related to neuroenergetics and will help further unravel and understand the metabolic changes associated to psychiatric conditions.Acknowledgements
This work was supported by the CIBM of the UNIL, UNIGE, HUG; CHUV, EPFL and Leenaards and Louis-Jeantet Foundations.References
1Volkow, et al. Cell (2015); 2Shirayama, et al. Curr Neuropharmacol (2006); 3Maddock and Buonocore, Curr Topics Behav Neurosci (2012) 4Campos, et al. Rev Brea Psiquiatr (2013); 5Nasca et al, Mol Psy (2015); 6Duarte et al, Neuroimage (2012); 7Mlynarik, et al. Res Med (2006); 8Hollis et al. PNAS (2015);Figures
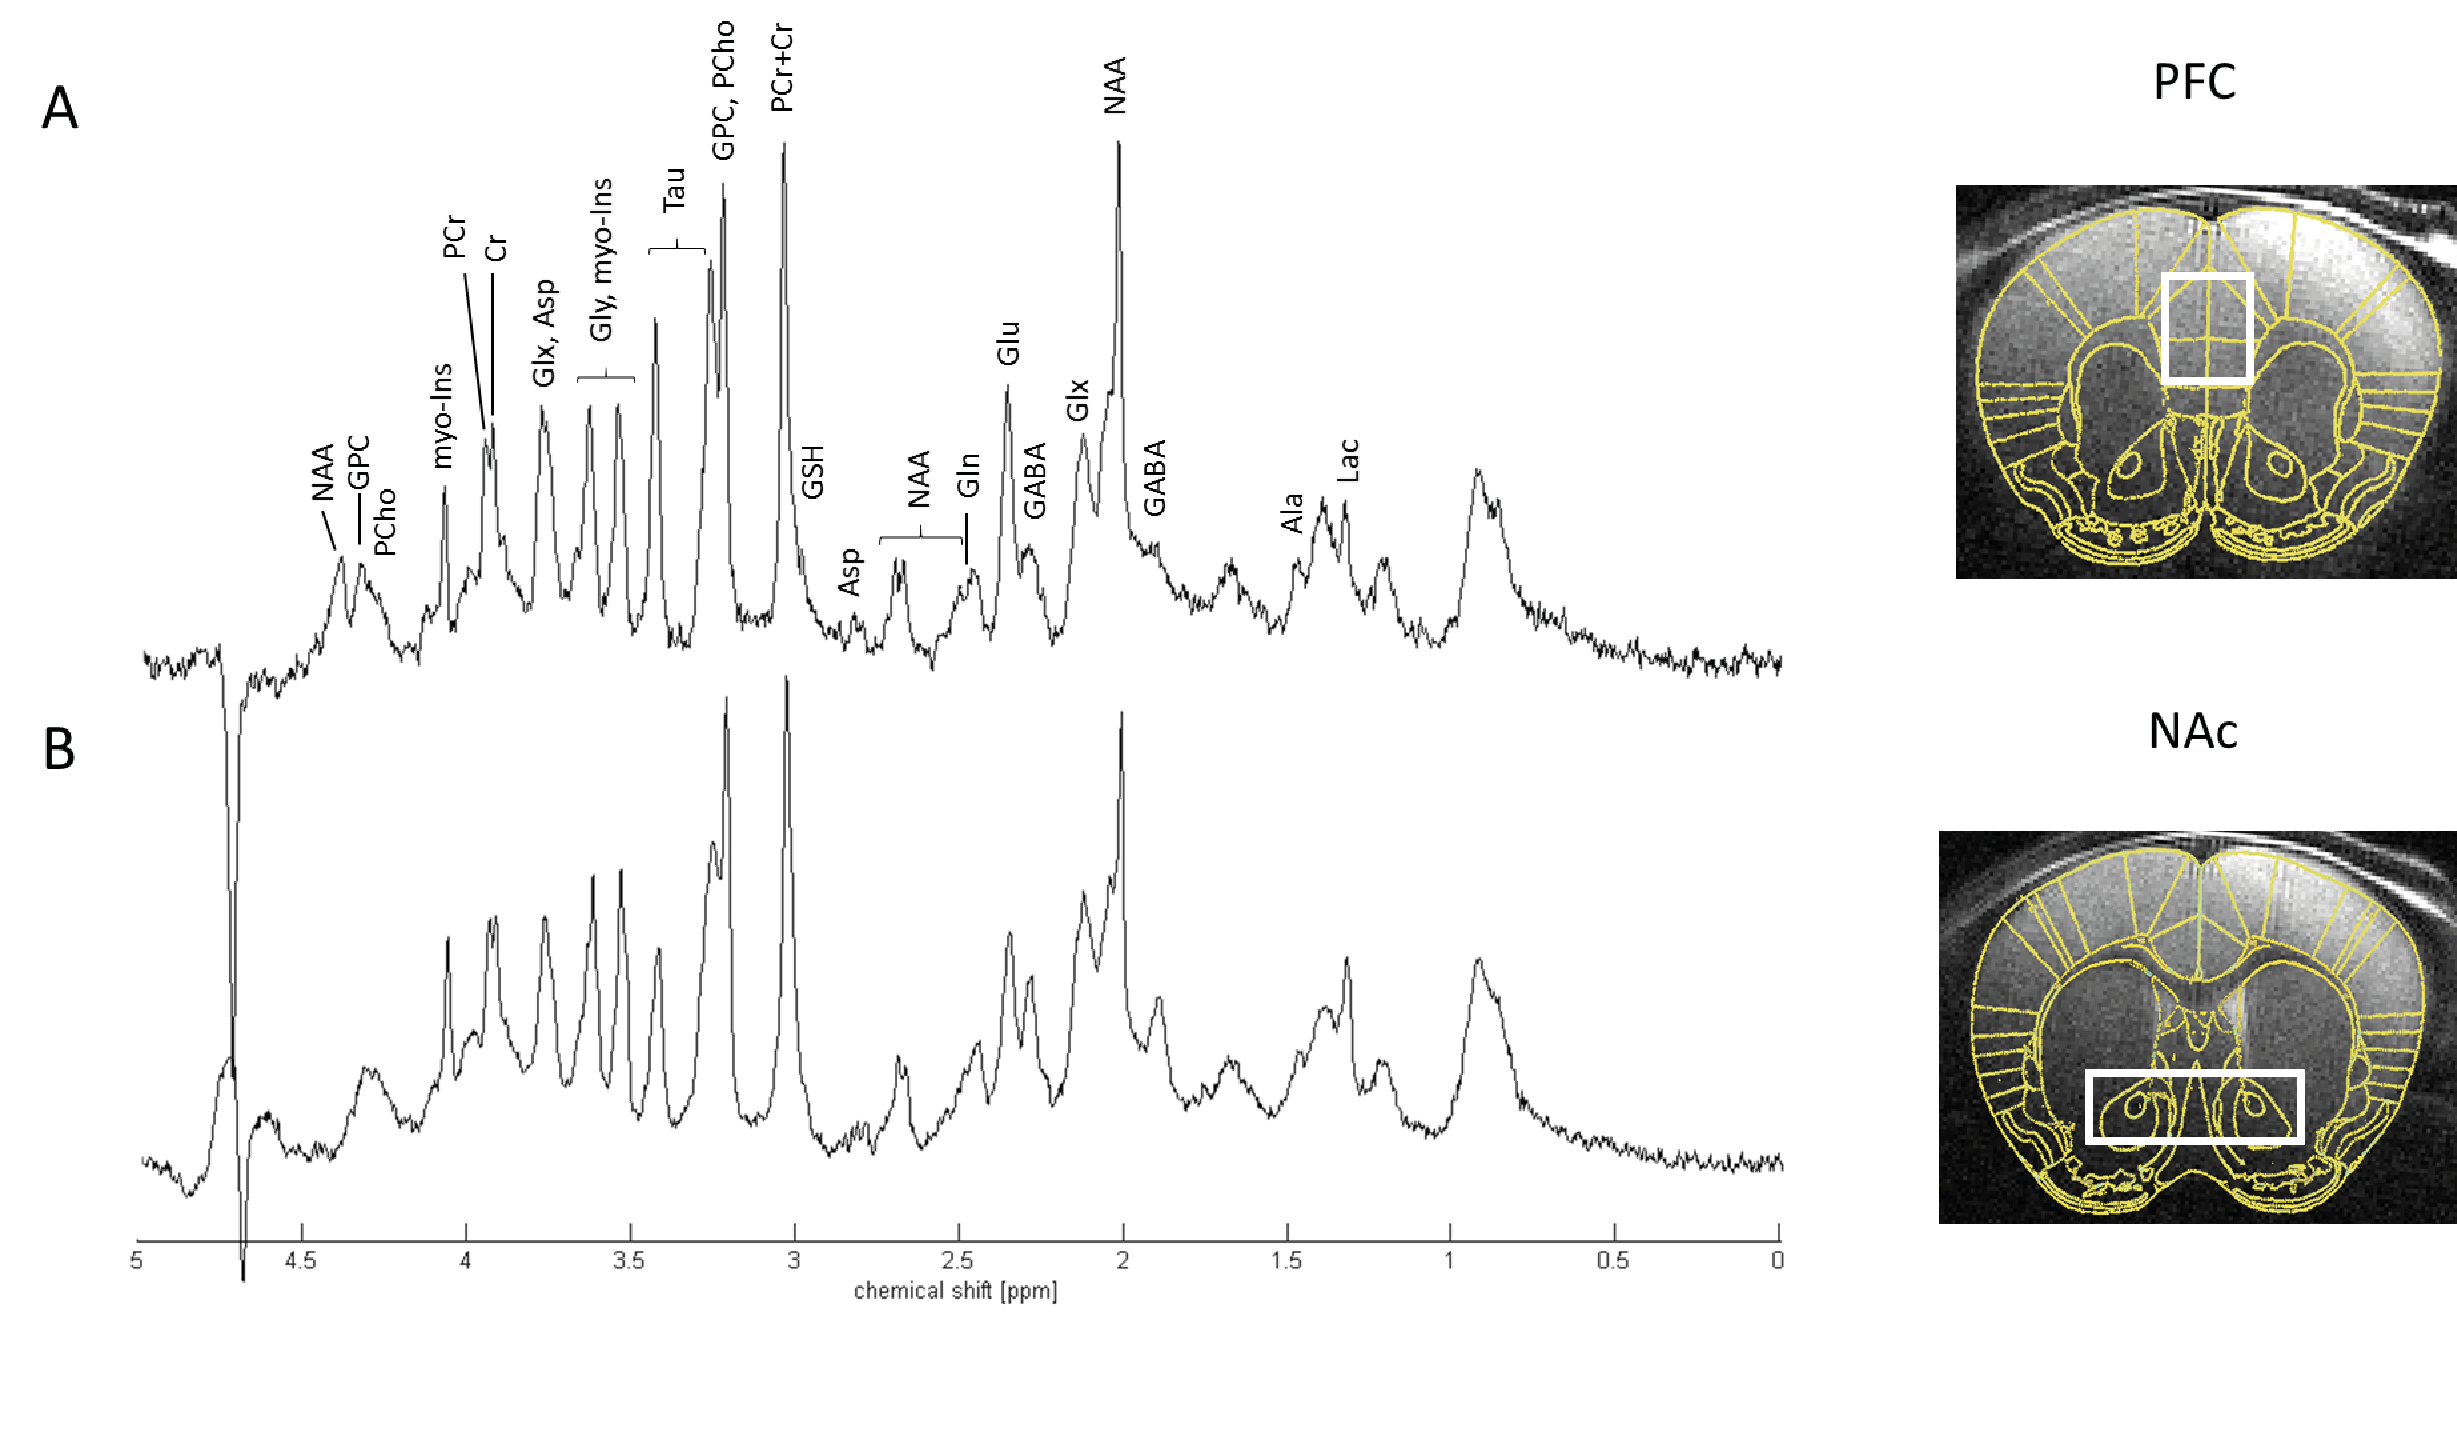
Typical spectra of
mouse A. Prefrontal Cortex (PFC) and B. Nucleus Accumbens (NAc)
with respective voxel localization. Volume of interest (VOI) was 1.7 x 1.4 x
1.2 mm3 for PFC and 1.4 x 4.1 x 1.2 mm3 for NAc. Signal to
noise ratio (SNR) was 15±3 for PFC and 17±2 for NAc with time of acquisition of
25 and 20 minutes respectively. Full width at half maximum (FWHM) measured on
the water signal was 15±1 Hz for PFC and 18±2 Hz for NAc. Spectra are shown
with 2 Hz line broadening and two spectra are from the same mouse.
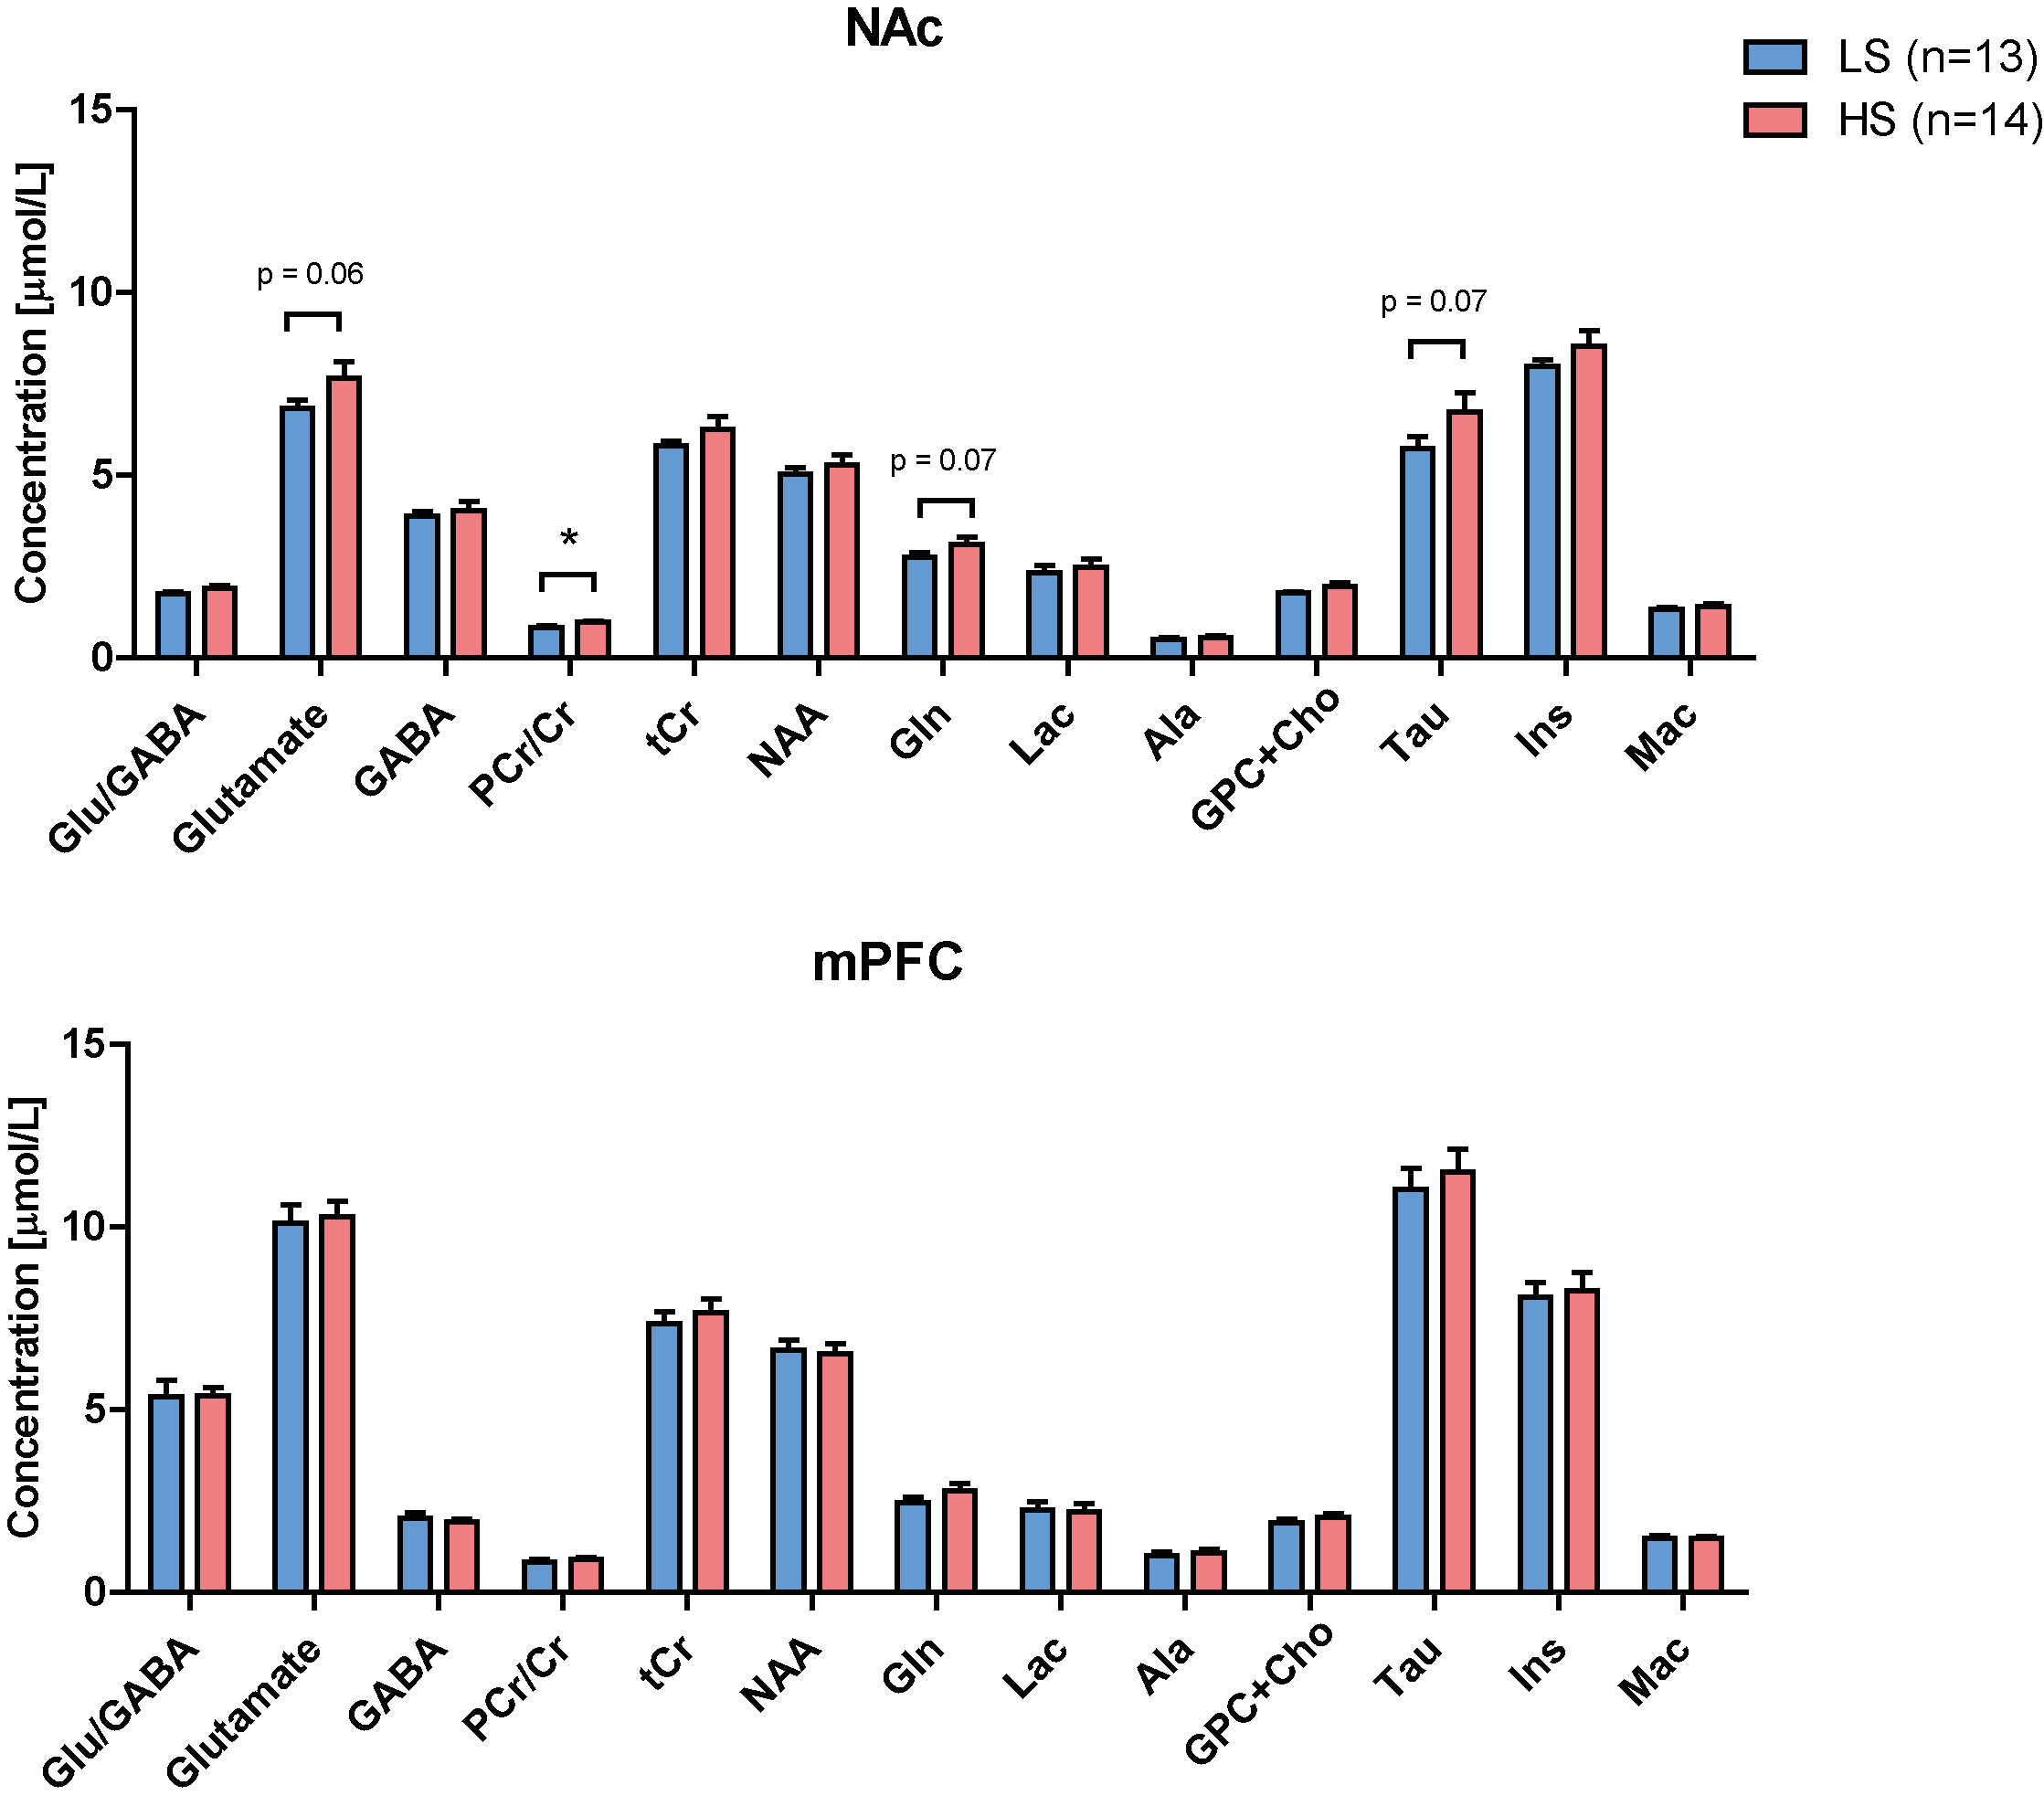
Metabolite
quantification results from LCModel in prefrontal cortex (PFC) and nucleus
accumbens (NAc). PCr: phosphocreatine; Cr: creatine; NAA: N-acetylaspartate;
Gln: glutamine; Lac: lactate; Ala: alanine; GPC+Cho:
glycerophosphocholine+choline; Tau: taurine; Ins: inositol; Mac: macromolecules.
Data is represented with mean±SEM and statistical analysis was done with
Student t-test (*p<0.05).
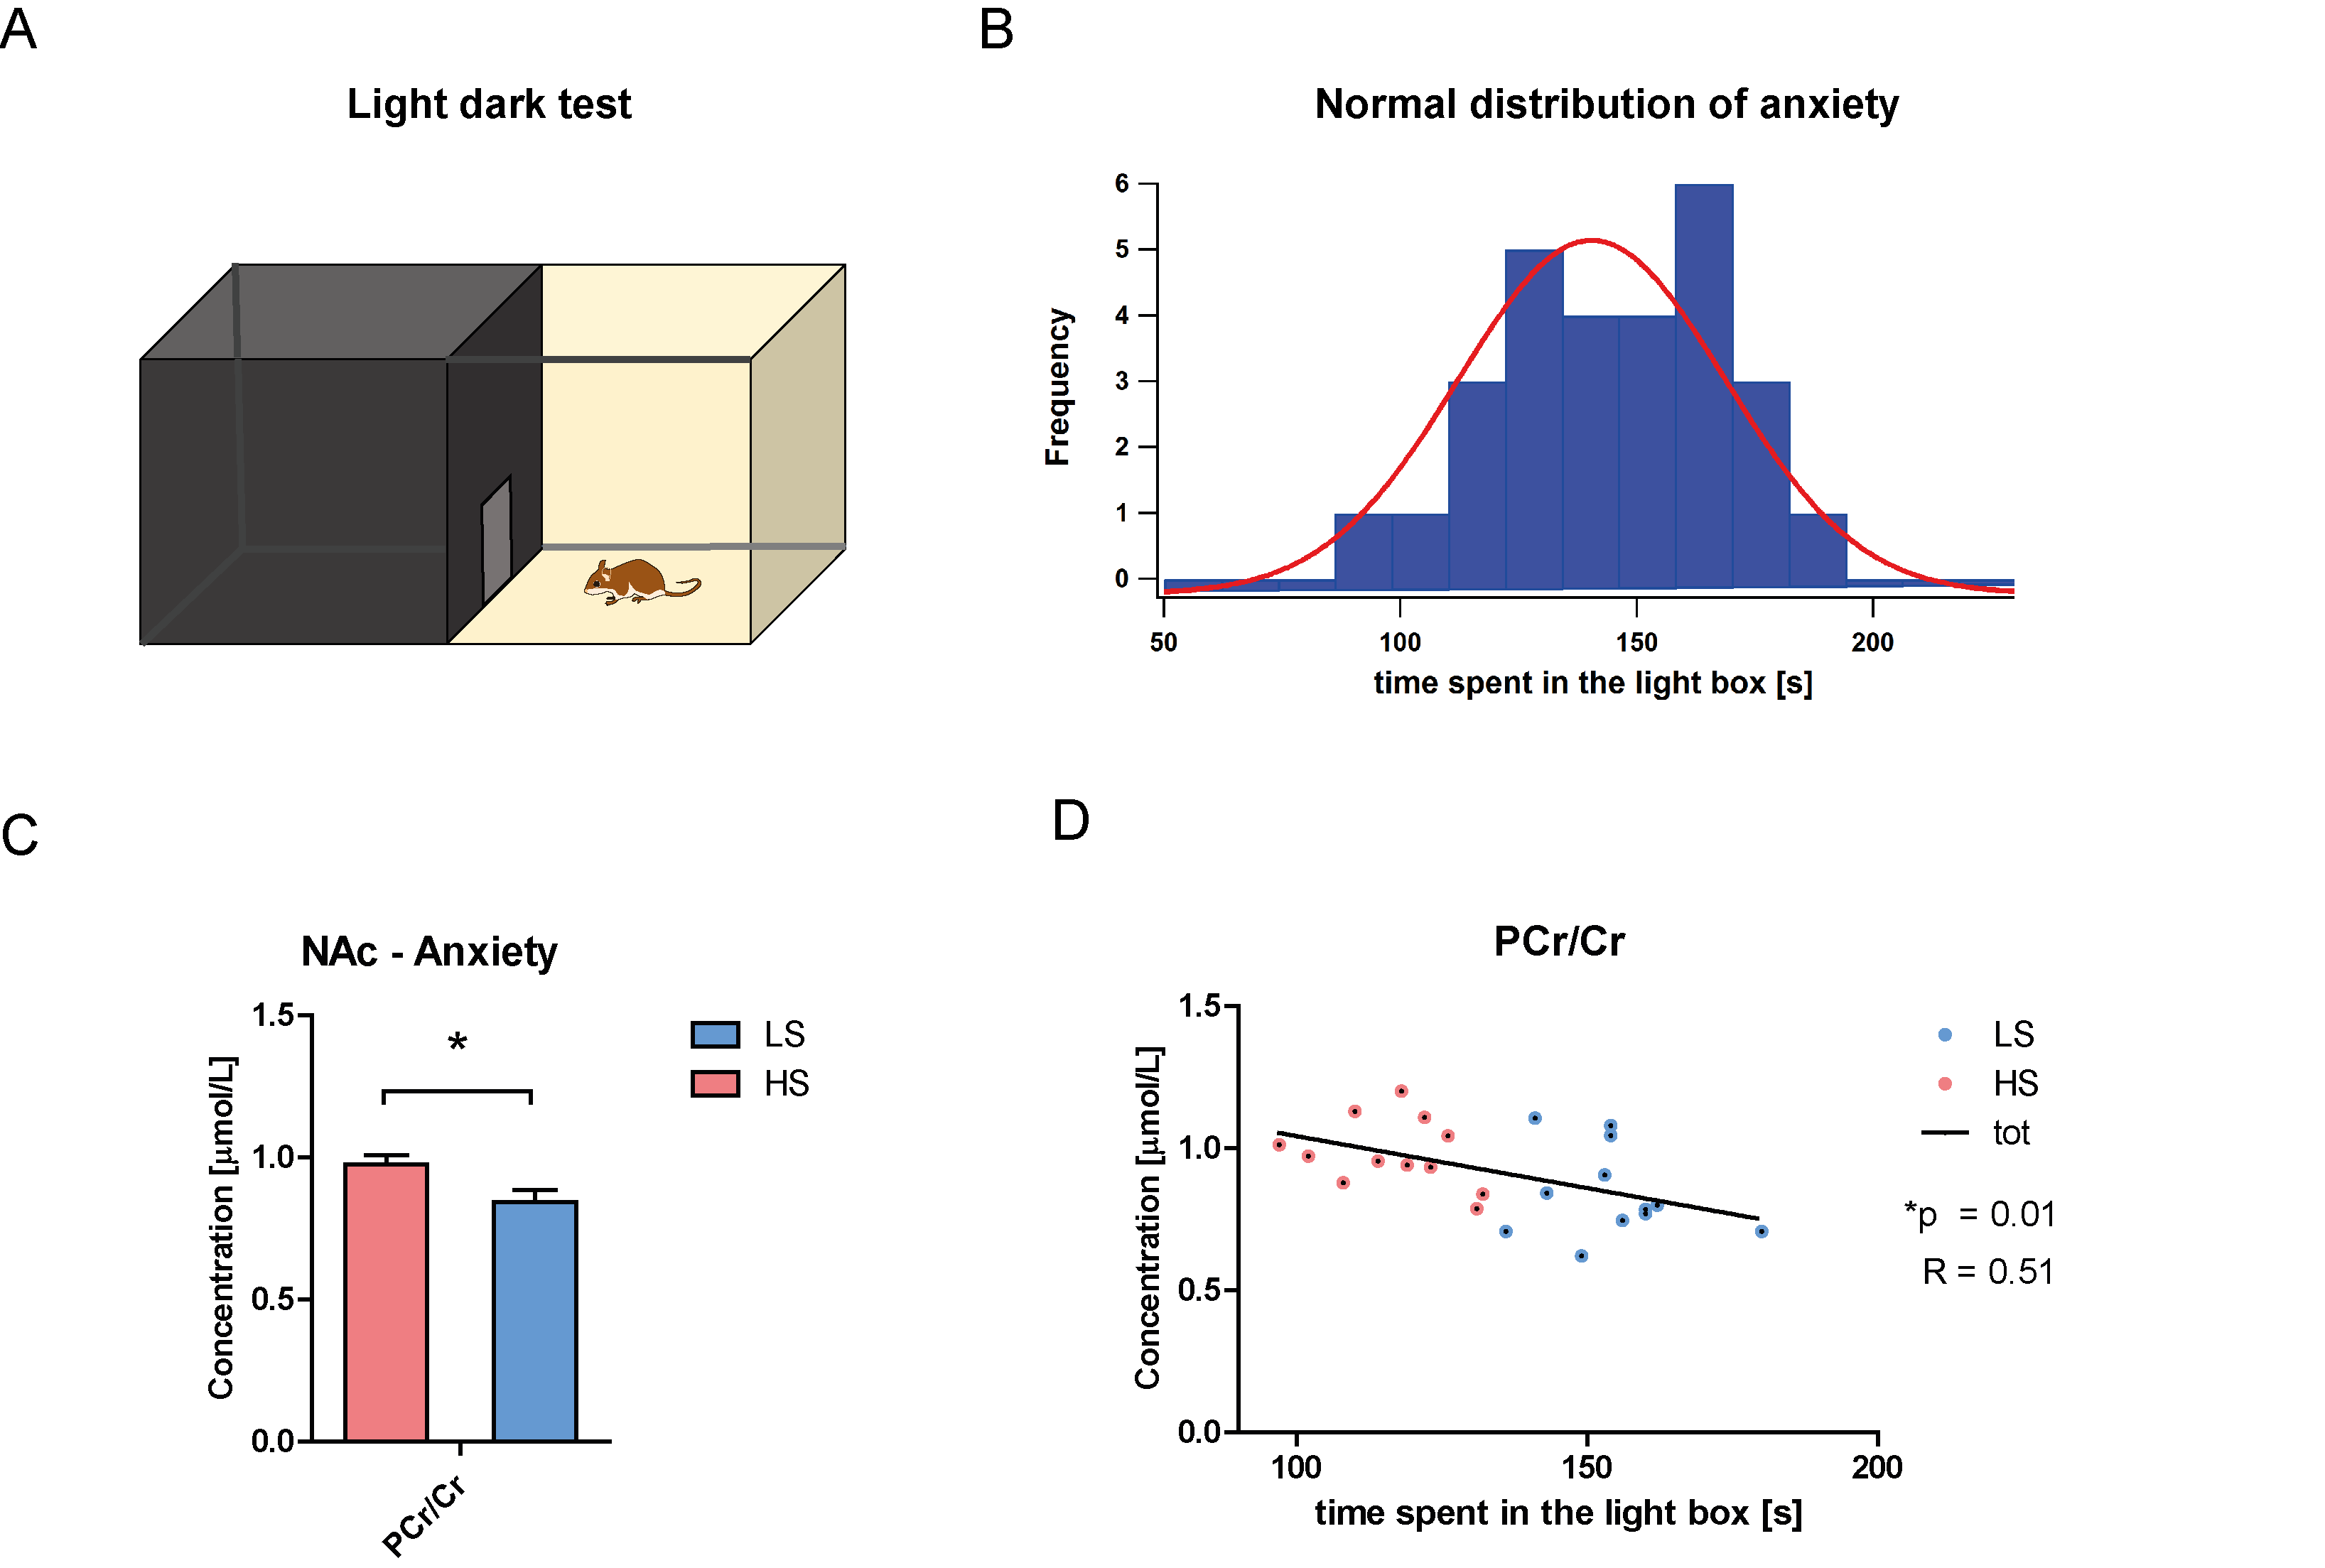
A. Scheme of the light-dark test. B. Frequency distribution of the
anxiety level in the mice sample as measured with the time spent in the light
part of the box. C. Increase of the
PCr/Cr ratio in the high anxious group, which correlated with the anxiety
intensity as shown in D. Data is
represented with mean±SEM and statistical analysis was done with Student t-test
(*p<0.05).