4205
The study of brain iron by SWI and T2 * imaging in Parkinson’s disease1Department of image center, Shanghai Xuhui central hospital,Shanghai, Shanghai, People's Republic of China
Synopsis
Both Susceptibility Weighted Imaging (SWI) and T2 star (T2*) imaging can measure the brain iron deposition. However, the two ways by which the brain iron is measured are not compared. This study measured the brain iron of healthy volunteers and Parkinson’s disease patients by SWI and T2* imaging. we found that SWI and T2* imaging could estimate the brain iron, and the SWI radiant values of SNr and RN were significance difference between healthy volunteers and Parkinson’s disease patients, suggesting the SWI had better reliability to diagnose the Parkinson’s disease than the T2* imaging.
Purpose
the purpose of this study is to measure the brain iron contents of deep gray matter nucleus using the SWI and T2* imaging, compare its differences and select a better way to diagnose the Parkinson’s disease.Methods
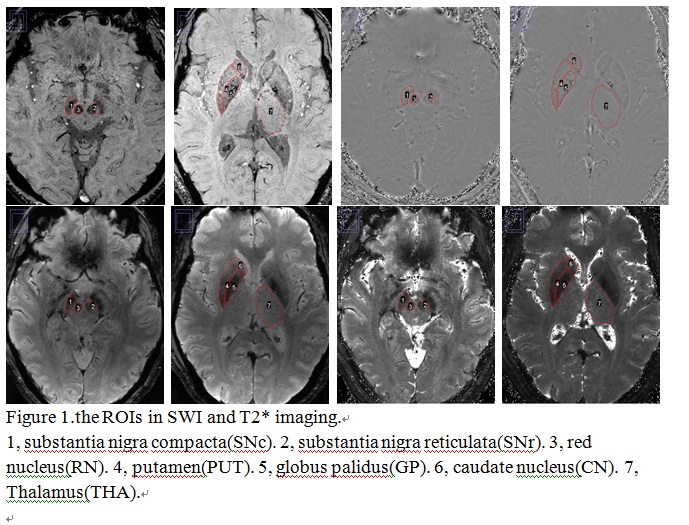
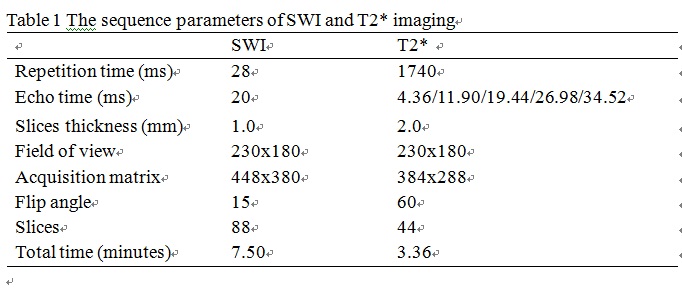
Population: In this study, sixty healthy volunteers (40 males, 20 females, mean age= 69.8±11.2 years, NC group) and thirty patients (20 males, 10 females, mean age=70.1±11.1 years, PD group) with Parkinson’s disease were recruited, the ratio between NC group and PD group was two. We conducted a prospective study approved by the local Institutional Ethics Committee. The written consent forms were obtained from all subjects before data acquisition. Image acquisition: A 3.0T MRI system scanner (Magnetom Verio Tim, Siemens, Germany) with a 32-channel head coil was used. The imaging pulse sequences included conventional MR sequences (axial T2W, T2W FLAIR, T1W FLAIR, DWI) and a axial SWI/ T2* imaging. A group of magnitude, phase, minimum intensity projection (MIP) and SWI images were automatically online reconstructed. The detailed imaging parameters were presented in Table 1. Data Analysis: Regions of interest (ROIs) were placed bilaterally in deep gray matter (GM) nucleus in putamen (PUT), globus palidus (GP), cadudate nucleus (CN), thalamus (THA), substantia nigra reticulate (SNr), substantica nigra compacta (SNr) and red nucleus (RN)(Fig 1). Image J software (National institutes of Health, Bethesda, MD, http://rsbweb.nih.gov/ij/ ) was used to evaluate the brain iron content of ROIs. First, the ROIs were recognized and manually outlined by the polygon tool of Image J software in the SWI image of SWI and T2 image of T2* imaging, and then copied to the phase image and T2* mapping image, which guaranteed that the boundaries and regions were exactly the same in both images. The phase value and T2* values of ROIs were measured in the phase image and T2* mapping image, and the radiant value were measured by the following formula, φ=π-π*ψ/2048, φ is radiant value, ψ is phase value, and the R2* value were measured by the following formula, R2*=1/T2*. During manually outlined these ROIs, we needed to avoided the cerebrospinal fluid (CSF), calcification, vessels and cerebral infarction in the selected lays.Results
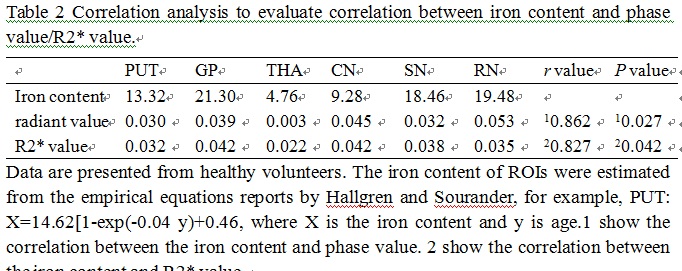
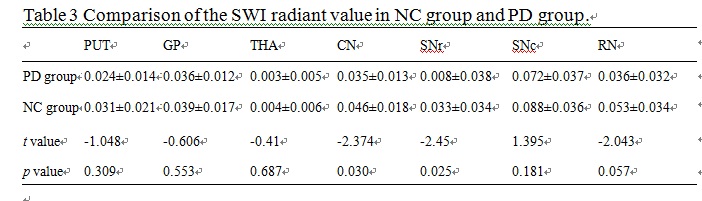
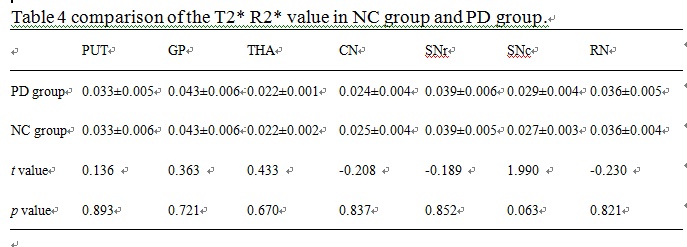
As shown in Table 2, both radiant values (r=0.862, P=0.027) and R2* values (r=0.827, P=0.042) had a significant correlation with the brain iron contents of ROIs, which were estimated from the empirical equations reports by Hallgren and Sourander 6. As shown in Table 3 and 4,there was significant difference in the radiant values of SNr (P=0.025) and RN (P=0.030) areas between the NC group and PD group.Conclusions
In this study, we found that SWI and T2* imaging could be applied to non-invasive estimate the brain iron contents for healthy volunteers. More importantly, the SWI radiant values of SNr and RN areas was significant difference between the healthy volunteers and patients with Parkinson’s disease. Thus, the non-invasion MRI, such as SWI and T2 * imaging, is a good tool for quantitative assessment of the brain iron contents, and the SWI had better reliability than the T2* imaging to diagnose the Parkinson’s disease.Synopsis
Both Susceptibility Weighted Imaging (SWI) and T2 star (T2*) imaging can measure the brain iron deposition. However, the two ways by which the brain iron is measured are not compared. This study measured the brain iron of healthy volunteers and Parkinson’s disease patients by SWI and T2* imaging. we found that SWI and T2* imaging could estimate the brain iron, and the SWI radiant values of SNr and RN were significance difference between healthy volunteers and Parkinson’s disease patients, suggesting the SWI had better reliability to diagnose the Parkinson’s disease than the T2* imaging.Acknowledgements
There was significant correlation between excessive brain iron deposition and the central nervous system degenerative diseases, especially the Parkinson’s disease. The excessive brain iron deposition was believed to participate in the pathological process of the disease 1,2. Thus, assessment of the brain iron is significant to diagnose the Parkinson’s disease in clinical practice. Brain iron which is a common para-magnetic substance can shorten the T2* relaxation time in T2* imaging. Brain iron also cause the difference in susceptibility between tissues, and accurately reflect the phase change in the SWI 3-5. However, traditional method to measure the brain iron just apply the SWI or T2* imaging. But the two ways which one would be the better to measure the brain iron contents. Thus, the purpose of this study is to measure the brain iron contents of deep gray matter nucleus using the SWI and T2* imaging, compare its differences and select a better way to diagnose the Parkinson’s disease.References
[1] Lorraine V Kalia, Anthony E Lang. Lancet. 2015, 386(9996): 896-912.
[2] QuyenQ. Hoang. PNAS, 2014.111(7): 2402-2403.
[3] Barbosa JH, Santos AC, et al . Magn Reson Imaging. 2015, 33 (5): 559-565.
[4] Haacke EM, AyazM, KhanA. JMRI 2007,26:256-264
[5] Kurz FT, Freitag M, Schlemmer HP, et al. Radiology.2016,56(2):124-136. [6] Hallgren B, Sourander P. 1958,3(1):41-51.
Figures