4199
Clinical Application of Synthetic MRI: Benefits and Pitfalls1Radiology, Juntendo University, Tokyo, Japan, 2Radiology, The University of Tokyo Graduate School of Medicine, Tokyo, Japan, 3Radiological Sciences, Tokyo Metropolitan University Graduate School of Human Health Sciences, Tokyo, Japan
Synopsis
Synthetic MRI is a method of imaging based on the quantification of T1, T2, PD and B1 field by a single scan. The features of synthetic MRI such as; quantitative maps, tailored contrast-weighted imaging, brain tissue and myelin segmentation and volumetry show some advantages in the evaluation of brain disorders. However, some limitations were also noted.
Purpose
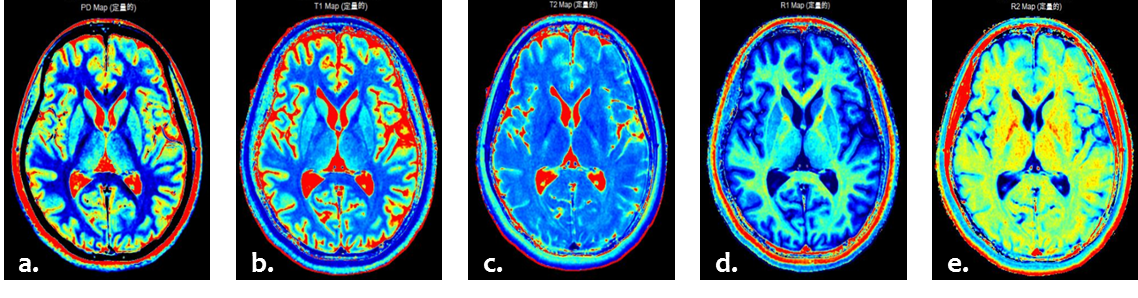
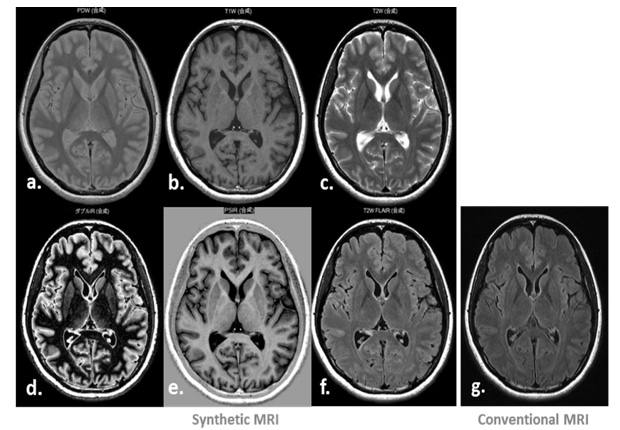
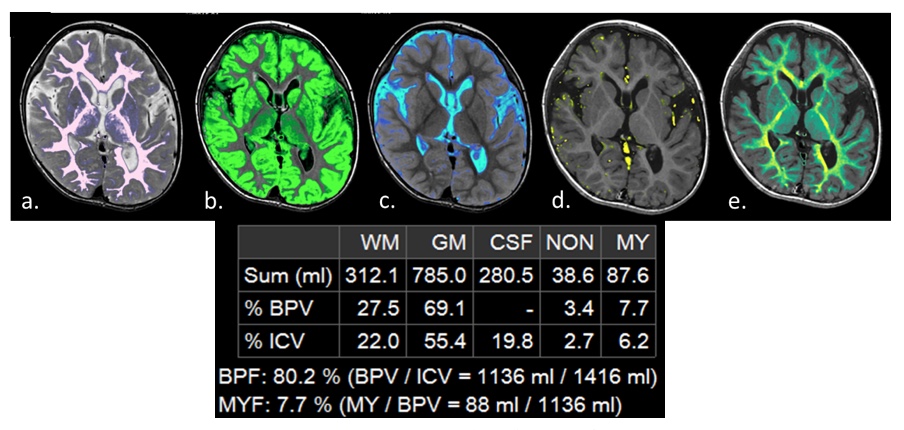
Synthetic MRI enables quantitative measurement of the T1 relaxation time, the T2 relaxation time, the proton density (PD) and the B1 field by a single scan. From the quantitative data, contrast-weighted image with any combination of echo time (TE), repetition time (TR), and inversion time (TI), brain volumetry and myelin map can be obtained in a short time. This exhibit will show the features of synthetic MRI that useful in clinical settings and also the limitations and the pitfalls of synthetic MRI.Outline of content
1. The features of Synthetic MRI, that included:
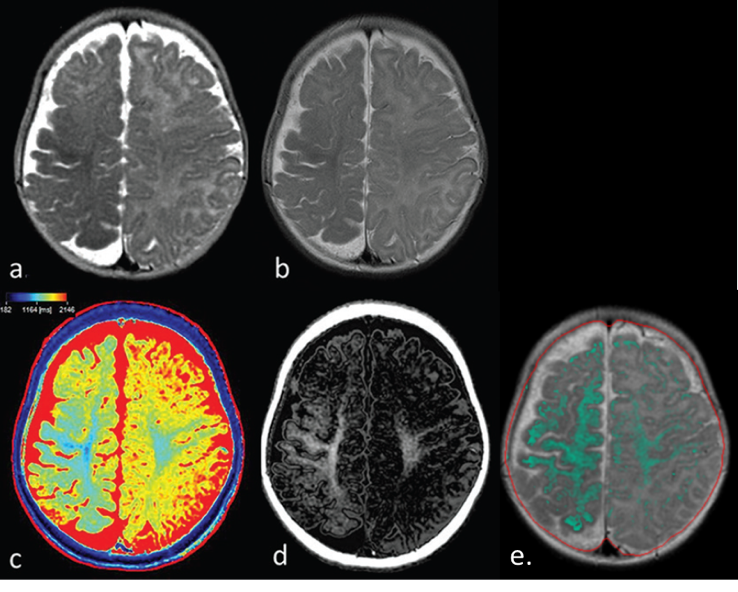
a. Quantitative maps
b. Tailored contrast-weighted imaging
c. Automated brain segmentation and volumetry
d. Myelin map
2. The usefulness of synthetic MRI in imaging of the brain diseases, such as:
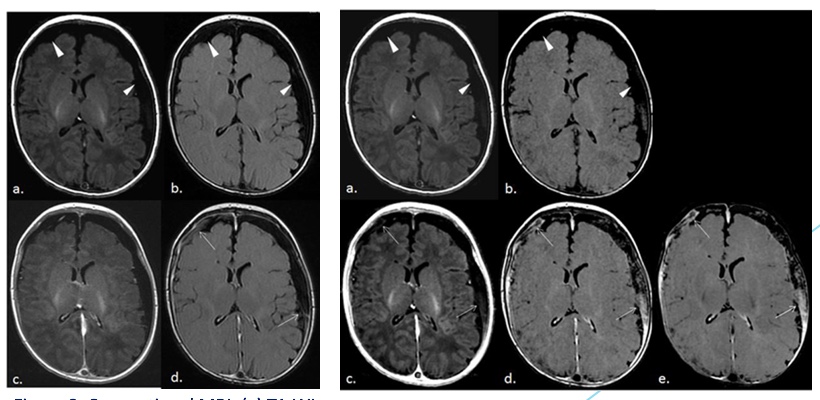
a. Meningeal pathologies:
i. Meningeal enhancement in Sturge-Weber syndrome
ii. Bacterial meningitis
b. Brain metastases
c. Multiple sclerosis
d. Evaluation of myelin especially in the developing brain:
i. “Accelerated myelination” in Sturge-Weber syndrome
3. The limitations and pitfalls of Synthetic MRI, such as partial volume effect.
Summary
The features of Synthetic MRI that based on the quantitative measurement of brain tissue physical parameters, such as T1, T2, PD, and B1 field show some advantages in clinical settings. However, synthetic MRI still has a few limitations and pitfalls that have to be aware.Acknowledgements
the authors declare no conflict of interestReferences
1. Warntjes JB, et al. Rapid Magnetic Resonance Quantification on the Brain: Optimization for Clinical Usage. Magn Reson Med 2008;60:320-9.
2. West J, et al. Novel Whole Brain Segmentation and Volume Estimation Using Quantitative MRI. Eur Radiol 2012;22(5):998-1007.
3. Warntjes M, et al. Modelling the Presence of Myelin and Edema in the Brain Based on Multi-parametric Quantitative MRI. Front Neurol 2016;7:16.
4. Nelson F, et al. Improved Identification of Intracortical Lesions in Multiple Sclerosis with Phase-Sensitive Inversion Recovery in Combination with Fast Double Inversion Recovery MR Imaging. AJNR Am J Neuroradiol 2007;28:1645-49.
5. Hagiwara A, et al. Synthetic MRI in the Detection of Multiple Sclerosis Plaques. AJNR (in press)
6. Hagiwara A, et al. Contrast-enhanced synthetic MRI for the detection of brain metastases. Acta Radiol Open 2015;5(2):1-6.
7. Hagiwara A, et al. Dural Enhancement in a Patient with Sturge-Weber Syndrome Revealed by Double Inversion Recovery Contrast Using Synthetic MRI. Magn Reson Med Sci 2016;15(2):151-152.
8. Andica C, et al. Synthetic MR Imgages in the Diagnosis of Bacterial Meningitis. Magn Reson Med Sci 2016 (In press).
9. Andica C, et al. The Advantage of Synthetic MRI for the Visualization of Early White Matter Change in an Infant with Sturge-Weber Syndrome. Magn Reson Med Sci 2016;15(4):347-348.
Figures