4190
The pitfalls of MR fiber g-ratio mapping in neurological disease patients.1Radiology, Juntendo University School of Medicine, Tokyo, Japan, 2Radiology, The University of Tokyo Hospital, Tokyo, Japan, 3Radiology, Tokyo Medical Clinic, Tokyo, Japan, 4Health Science, Tokyo Metropolitan University, Tokyo, Japan
Synopsis
The purpose of this exhibit is to present the pitfalls of generating MR fiber g-ratio mapping in neurological disease patients, and to propose possible solutions. While the g-ratio maps can help to make comprehensive diagnosis together with clinical information (i.e. symptoms), probable differential diagnosis and conventional MR imaging findings can help to avoid the misuse of MR fiber g-ratio maps in the clinical setting.
Target audience
Researchers and clinicians who investigate the brain and spinal cord by using quantitative MRI.Purpose
Magnetic resonance (MR) fiber g-ratio mapping has been introduced as a new and promising technique for the evaluation of brain and spinal cord in vivo because it can provide quantitative information of microstructure of neuronal tissue, which is not available from conventional MR imaging. The fiber g-ratio is defined as the ratio of the diameter of the axon to the diameter of the neuronal fiber (axon plus myelin) 1. To perform quantitative g-ratio mapping, two MR measurements, myelin volume fraction (MVF) and axon volume fraction (AVF), are needed. The reported results of MR fiber g-ratio in healthy white matter and in aging studies agrees with literature2. However, MVF and AVF may show unexpected abnormal values in patients with neurological diseases. The artifacts are amplified by imperfect registration of the MVF and AVF maps to generate fiber g-ratio maps. We have encountered several clinical cases, in which MVF or AVF seemed to be incorrect and therefore the generated fiber g-ratio maps suffered from these effect and may result in inadequate clinical diagnosis.
The purpose of this presentation is to present the pitfalls of generating MR fiber g-ratio mapping in neurological disease patients, and to propose possible solutions.
Outline of contents
1. We will demonstrate the basics of MVF and AVF for MR fiber g-ratio technique and introduce several imaging sequences, such as relaxometry3 and quantitative magnetization transfer methods for estimating the MVF. We will also present several diffusion MR imaging (dMRI) methods, such as diffusion tensor imaging, neurite orientation dispersion and density imaging (NODDI)4 and other advanced dMRI techniques 5 for calculating AVF.
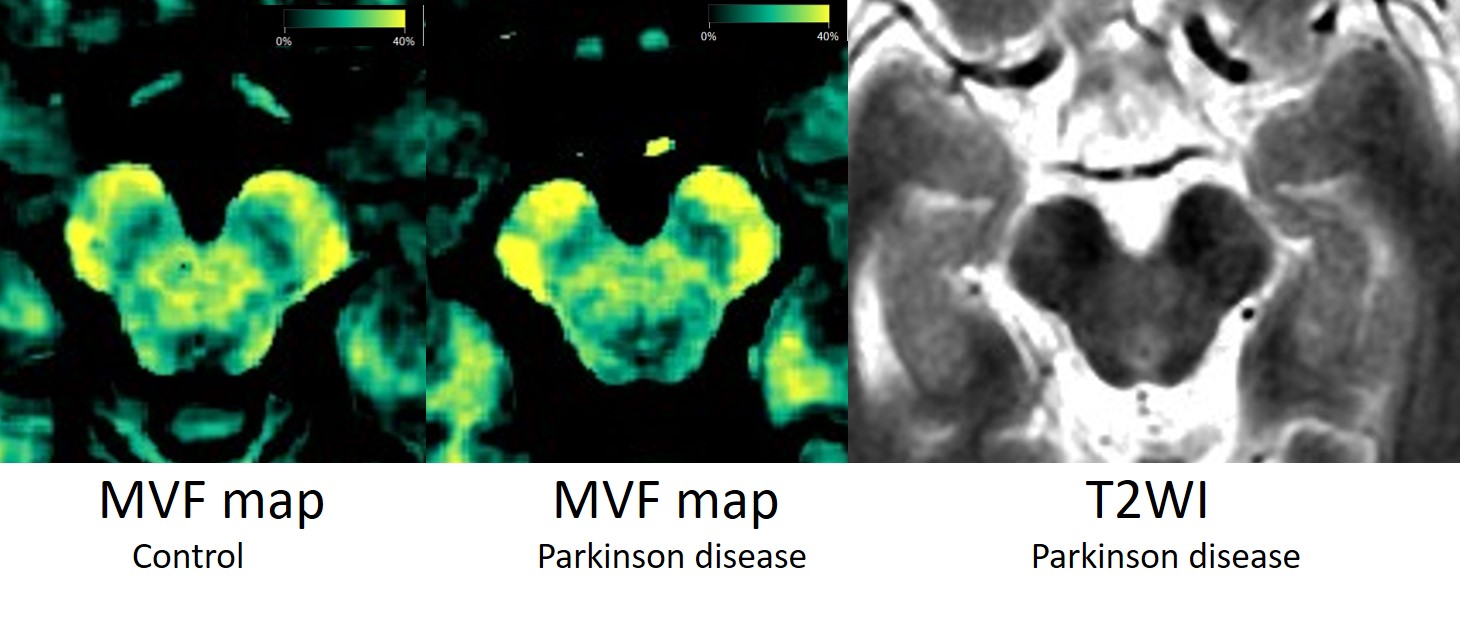
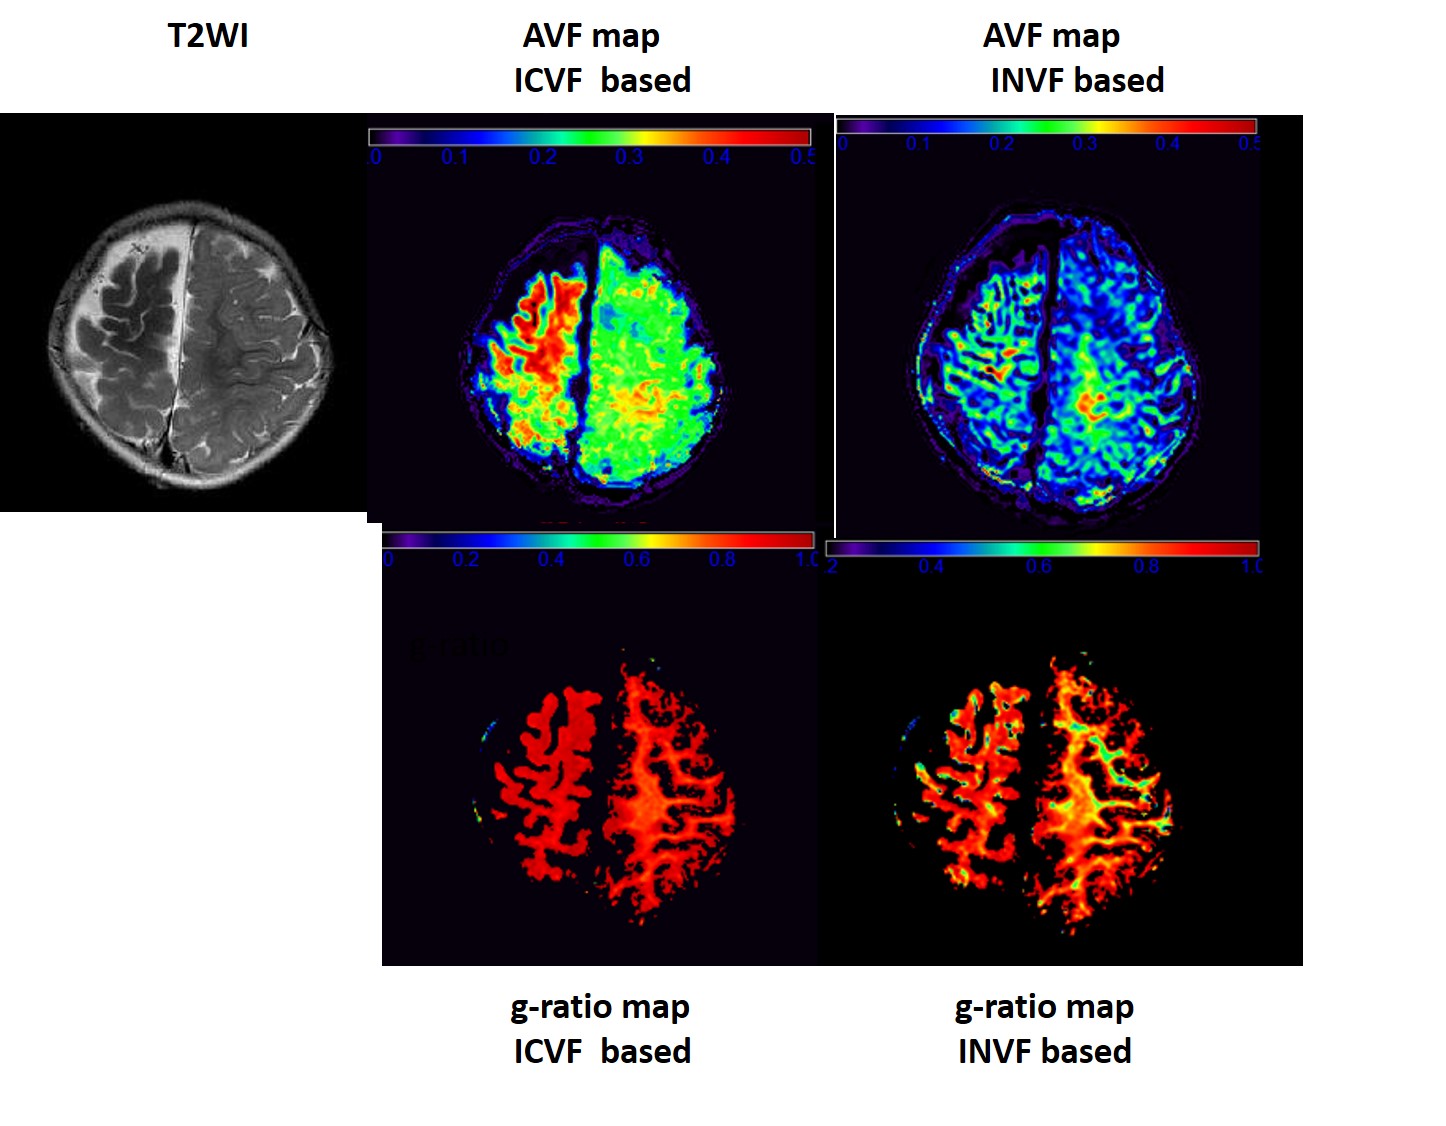
2. We will present relaxometry-based MVF maps, which seem to be inadequate in clinical cases. T1 and T2 values are not exclusively determined by myelin volume, but also by other factors, such as iron in patients with Parkinson disease (Figure 1), hemorrhage, and other deposition materials related to disease. We will also present AVF maps obtained from NODDI and other advanced diffusion MRI techniques, which seem to be inadequate in some clinical cases (Figure 2). This may be due to the signal changes in the white matter that are not accounted by the NODDI model, such as low signal area in T2-weighted images.
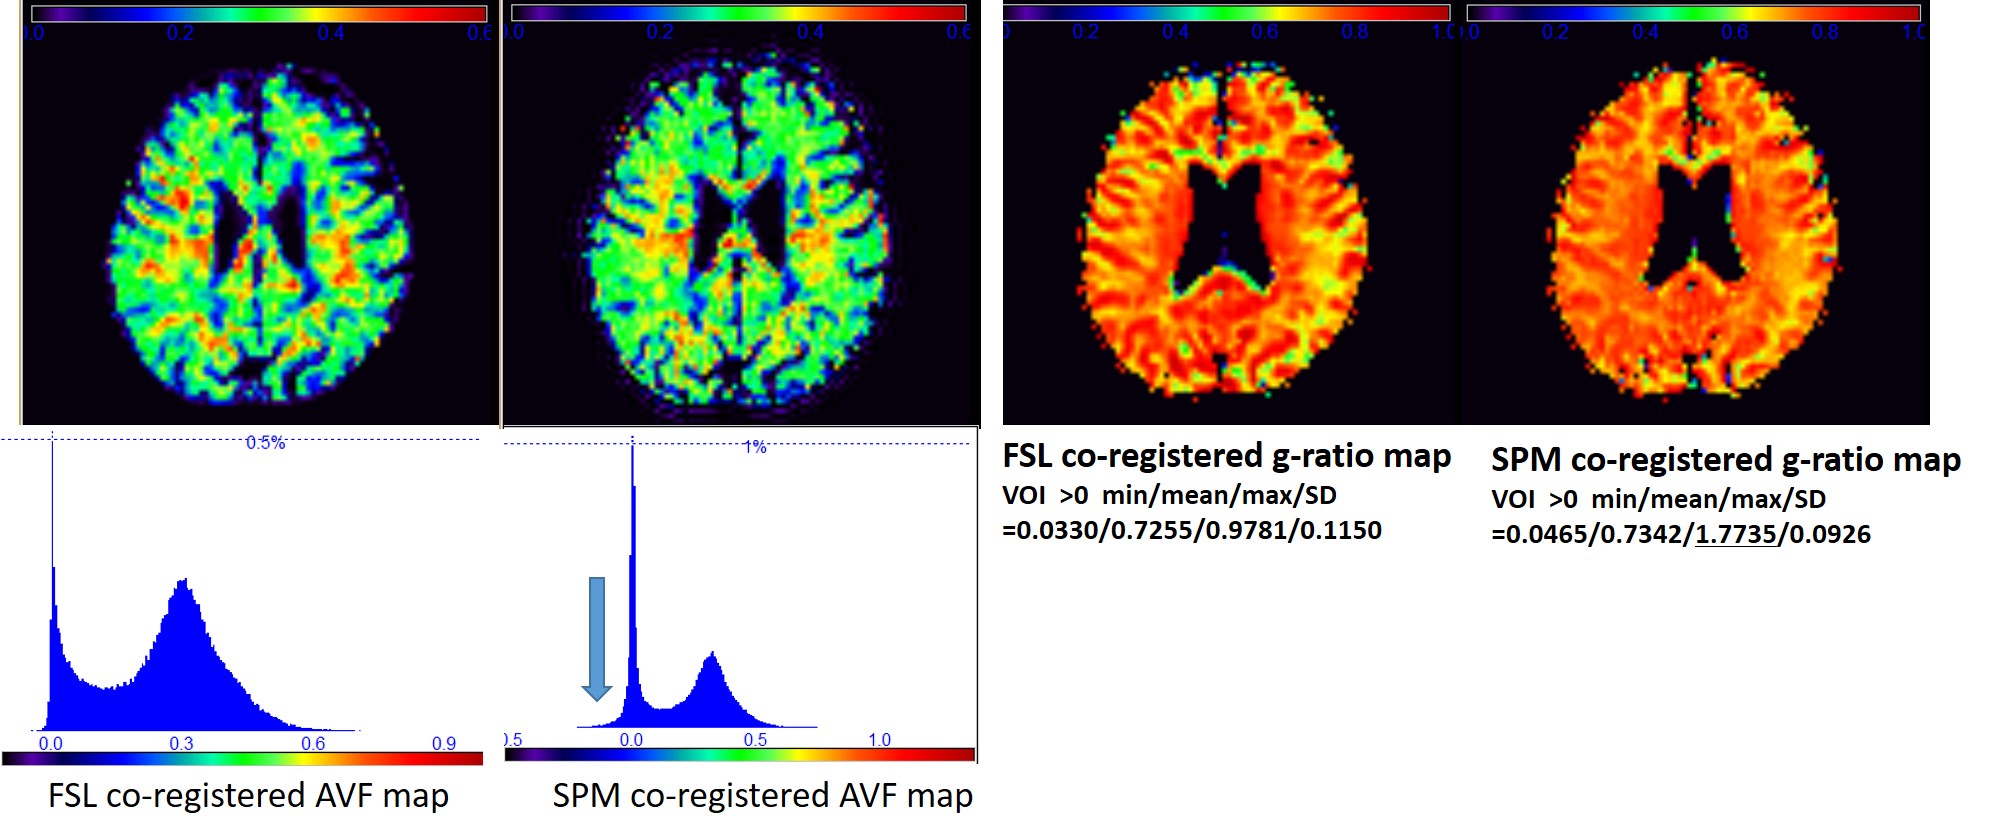
3. We also present example maps with inadequate post-processing methods (Figure 3). Therefore, it is important to confirm that the map is free of registration and post-processing artifacts.
Summary
This exhibit will demonstrate the pitfalls of generating MR fiber g-ratio mapping in neurological disease patients. The possible alternatives and solutions will also be proposed for each pitfall. While the g-ratio maps can help to make comprehensive diagnosis together with clinical information (i.e. symptoms), probable differential diagnosis and conventional MR imaging findings can help to avoid the misuse of MR fiber g-ratio maps in the clinical setting.Acknowledgements
We really appreciate Dr. Nikola Stikov for his kind advice and help.References
1. Stikov N, Campbell JS, Stroh T, et al. In vivo histology of the myelin g-ratio with magnetic resonance imaging. Neuroimage. 2015;118:397-405.
2. Cercignani M, Giulietti G, Dowell NG, et al. Characterizing axonal myelination within the healthy population: a tract-by-tract mapping of effects of age and gender on the fiber g-ratio. Neurobiol Aging. 2016 Sep 30;49:109-118. doi:10.1016/j.neurobiolaging.
3. Warntjes M, Engström M, Tisell A, Lundberg P. Modeling the Presence of Myelin and Edema in the Brain Based on Multi-Parametric Quantitative MRI. Front Neurol. 2016 ;7:16. doi: 10.3389/fneur.2016.00016.
4. Zhang H, Schneider T, Wheeler-Kingshott CA, Alexander DC. NODDI: practical in vivo neurite orientation dispersion and density imaging of the human brain.Neuroimage. 2012;61(4):1000-16.
5. Kaden E, Kelm ND, Carson RP, Does MD, Alexander DC. Multi-compartment microscopic diffusion imaging. Neuroimage. 2016 ;139:346-359.
Figures