4189
Altered network topology in patients with primary brain tumors after fractionated radiotherapy1University of California, San Diego, San Diego, CA, United States
Synopsis
The purpose of this study is to determine whether brain structural network properties change in brain tumor patients following fractionated, partial brain radiotherapy(RT). We applied graph theory to MRI-derived cortical thickness estimates in 54 patients pre and post-RT and examine global and local changes in network topology. Increases in global efficiency, transitivity, and modularity were observed post-RT compared to pre-RT. Decreases in local efficiency and clustering coefficient were seen in regions receiving higher doses of RT. Our findings demonstrate alterations in global and local network topology following RT in patients with primary brain tumors.
Purpose
Since the survival rate in many patients with primary brain tumors has improved, a major focus of recent studies is investigating the effect of cerebral radiotherapy (RT) on normal brain tissue and late cognitive decline.1 Despite decades of research, the neuropathological mechanisms that mediate RT effects on brain structure and function remain poorly understood.2,3 The purpose of this study is to determine whether key structural network properties change in brain tumor patients following fractionated, partial brain RT. We apply graph theory to MRI-derived cortical thickness estimates in 54 patients before and after RT. We examine both global and local changes in network topology using standard graph theory metrics. We also examine the effects of RT dose on local network changes.Methods
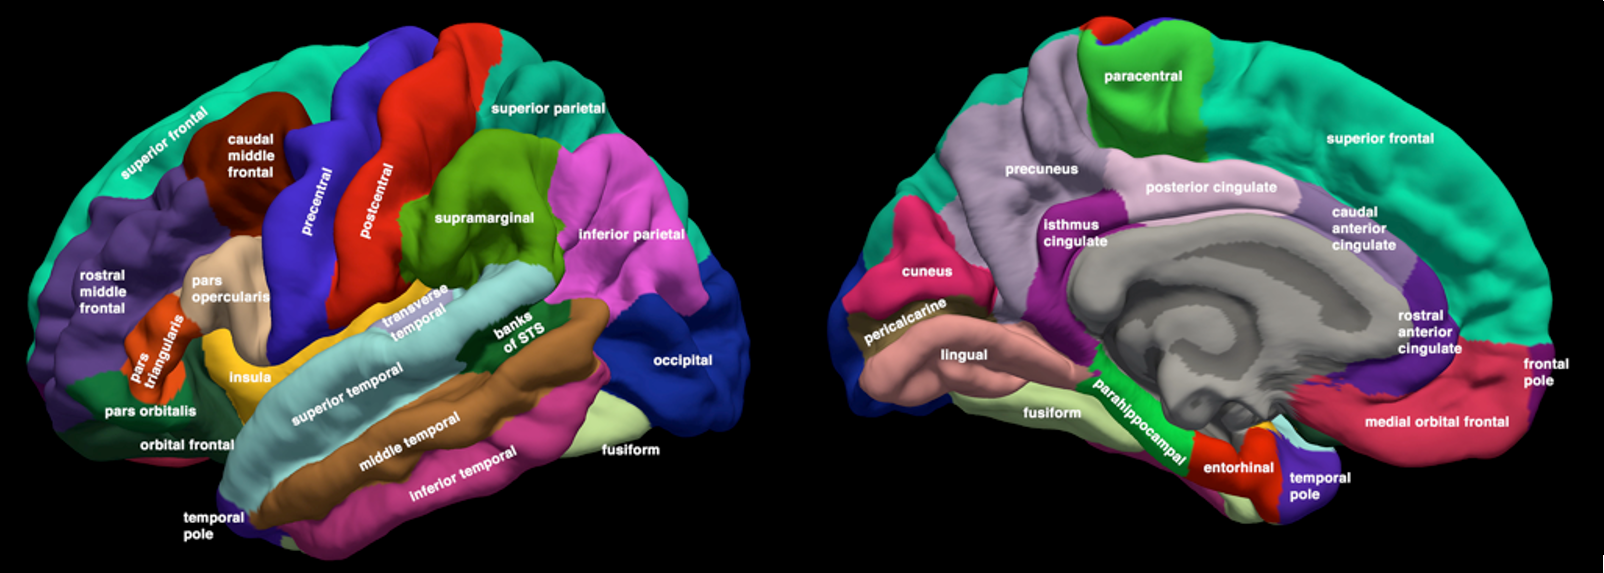
We acquired high-resolution volumetric MRI on 54 patients prior to and one year after RT. MR images were acquired on a 3T Signa Excite HDx system (GE Healthcare, Milwaukee, WI) using 8-channel dedicated head coil. The standardized protocol included a 3D T1-weighted inversion recovery spoiled gradient-echo sequence (TE, 2.8 ms; TR, 6.5 ms; TI, 450 ms) and T2-weighted FLAIR sequence (TE, 126 ms; TR, 6000 ms; TI, 1863 ms). Images were corrected for geometric distortions4 prior to co-registration of the pre-RT MRI to the CT simulation images used in radiation treatment planning using custom software.5 Cortical thickness was estimated by reconstructing the cortical surface from each T1- weighted MRI volume, weighted by T2-weighted FLAIR to correct for edema or hypointensity using FreeSurfer.5–7 Cortical surfaces were anatomically parcellated into 68 regions using the Desikan-Killiany atlas (Fig. 1).8,9 Correlation matrices (68*68) using partial Pearson correlation coefficients (with age and sex as co-variates) were created for each time point. Structural network connectivity metrics of integration (global efficiency), segregation (transitivity and modularity), and local properties (local efficiency and clustering coefficient) were extracted from the weighted and binary correlation matrices using Brain Connectome Toolbox for pre and post RT scans. Significant pre- to post-RT changes were tested using nonparametric permutation tests with 1000 permutations using RStudio.10–12 T-tests were conducted to demonstrate the difference in network connectivity metrics pre and post RT in all connectivity densities. Bonferroni correction was applied to correct for the multiple comparisons across various network densities (50; p-value = 0.001).13 Linear regression was conducted to measure the association between dose and changes in nodal network connectivity metrics in each region using JMP.14Results
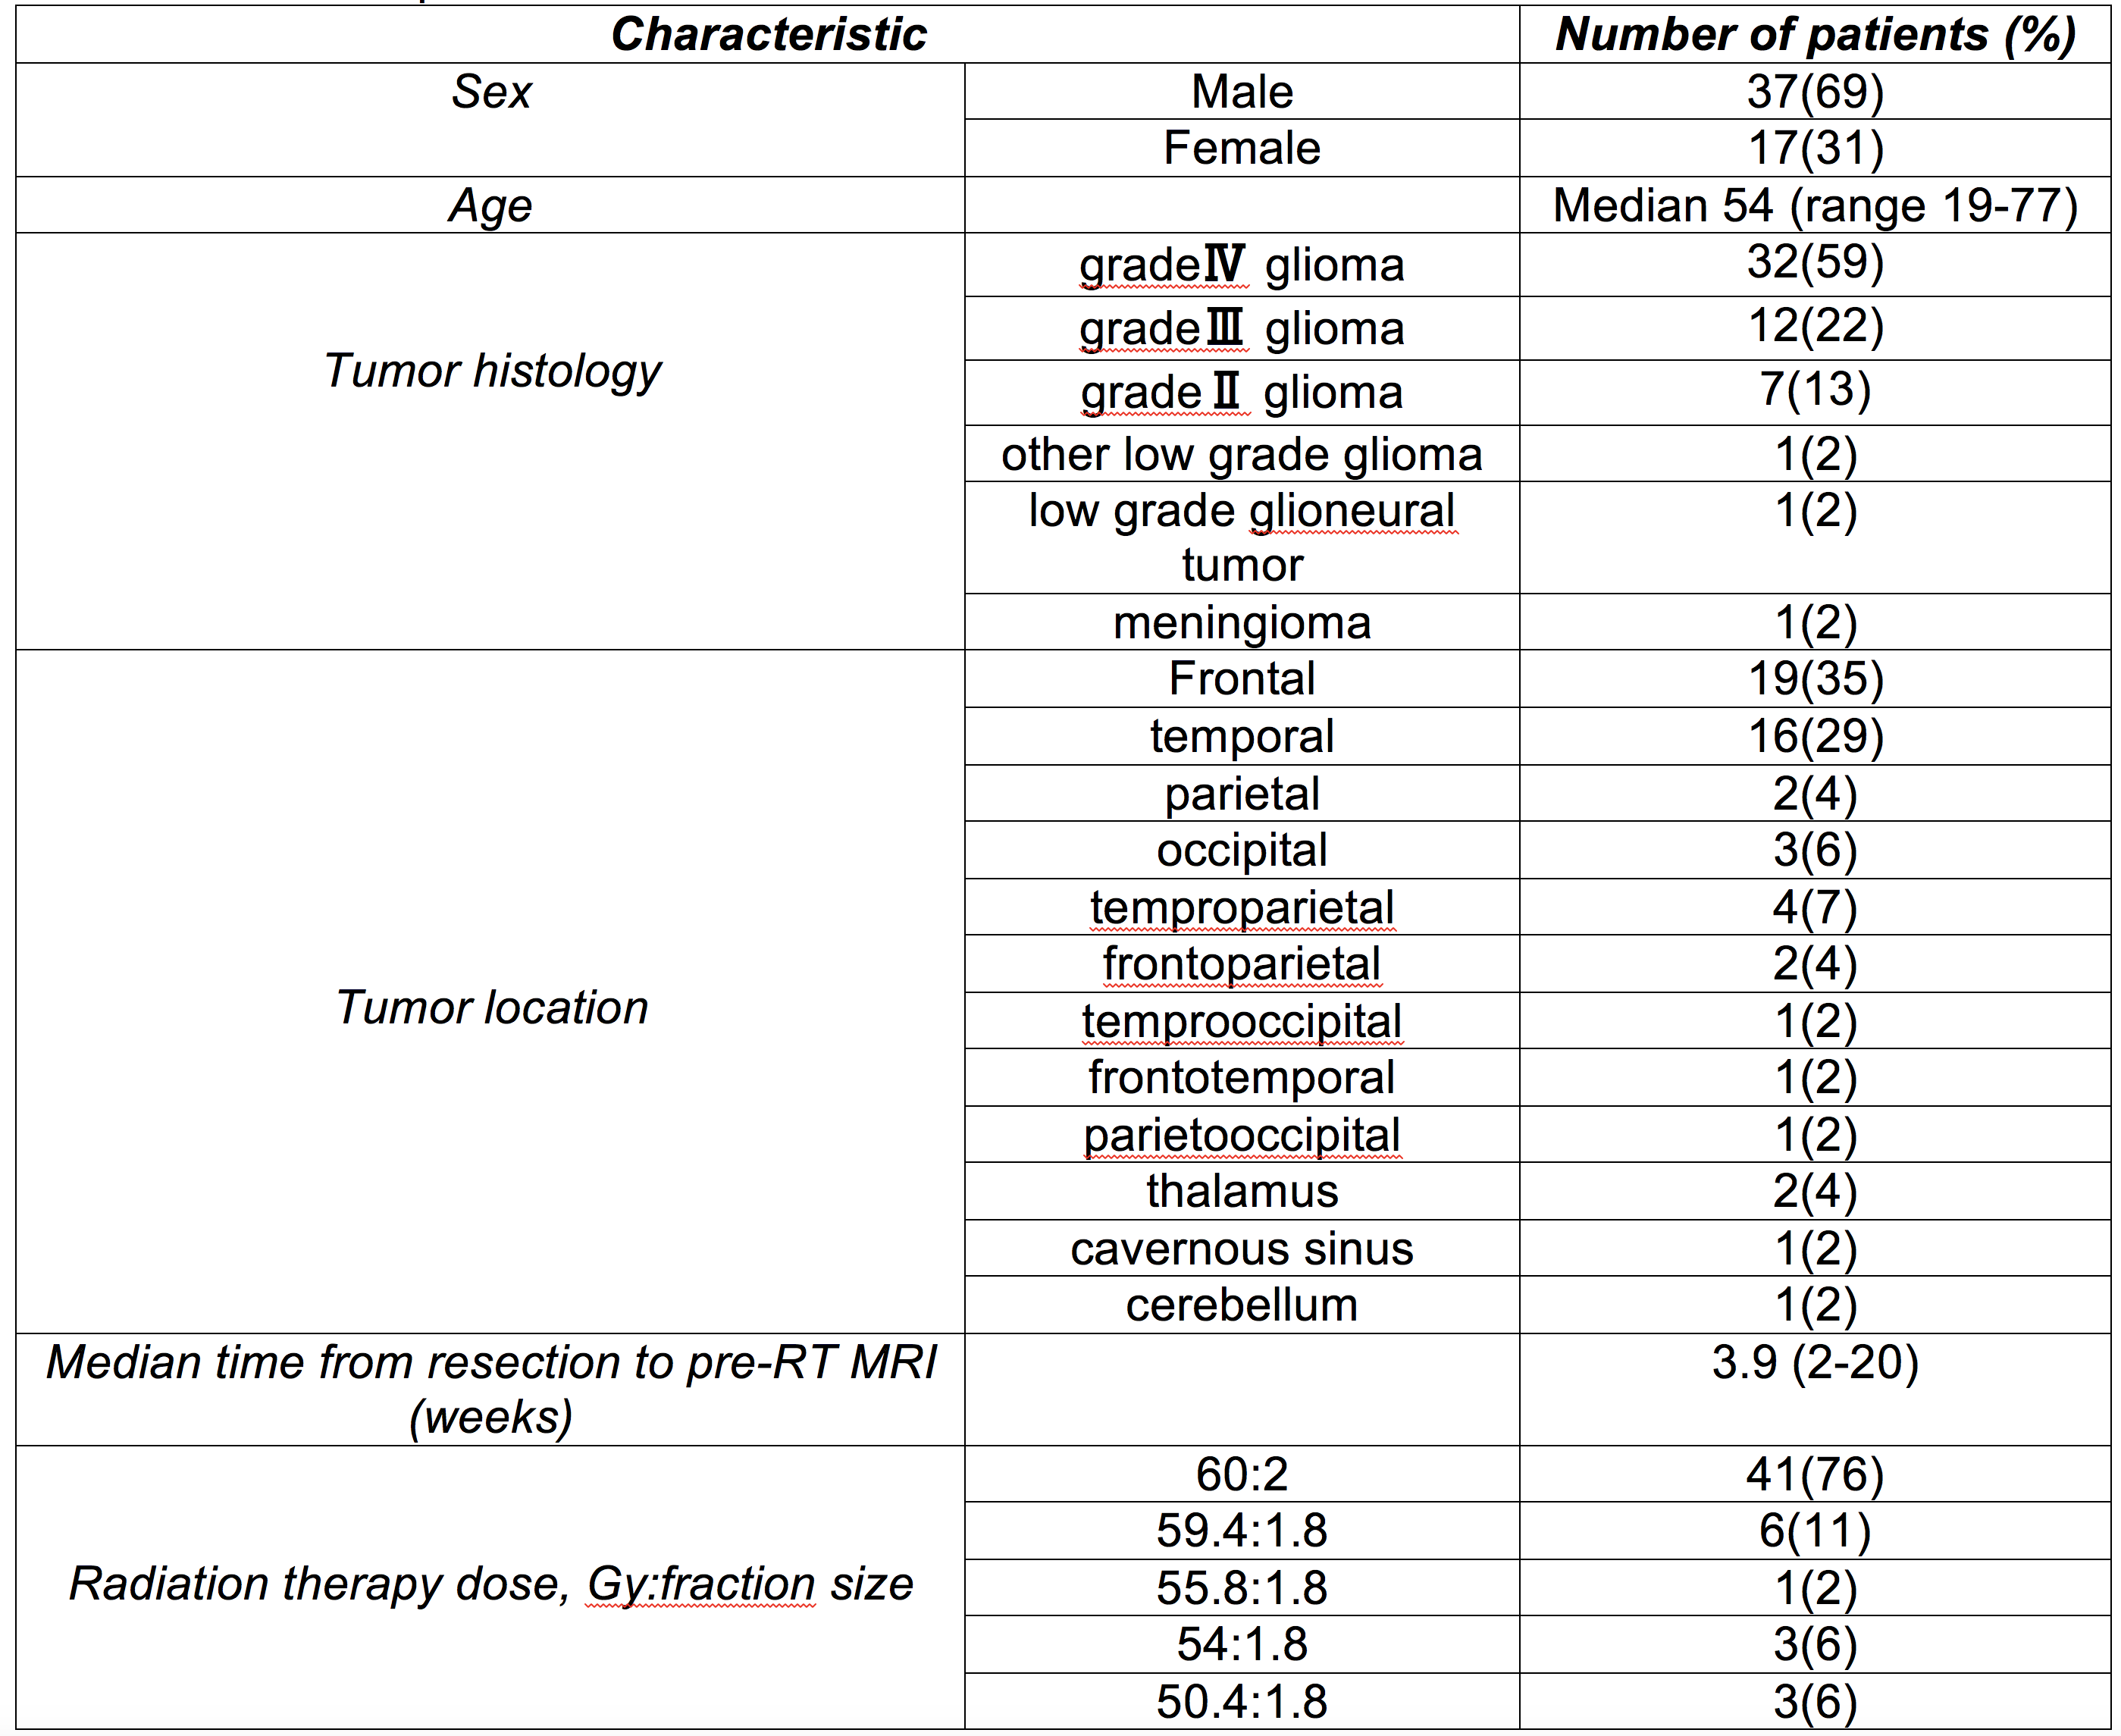
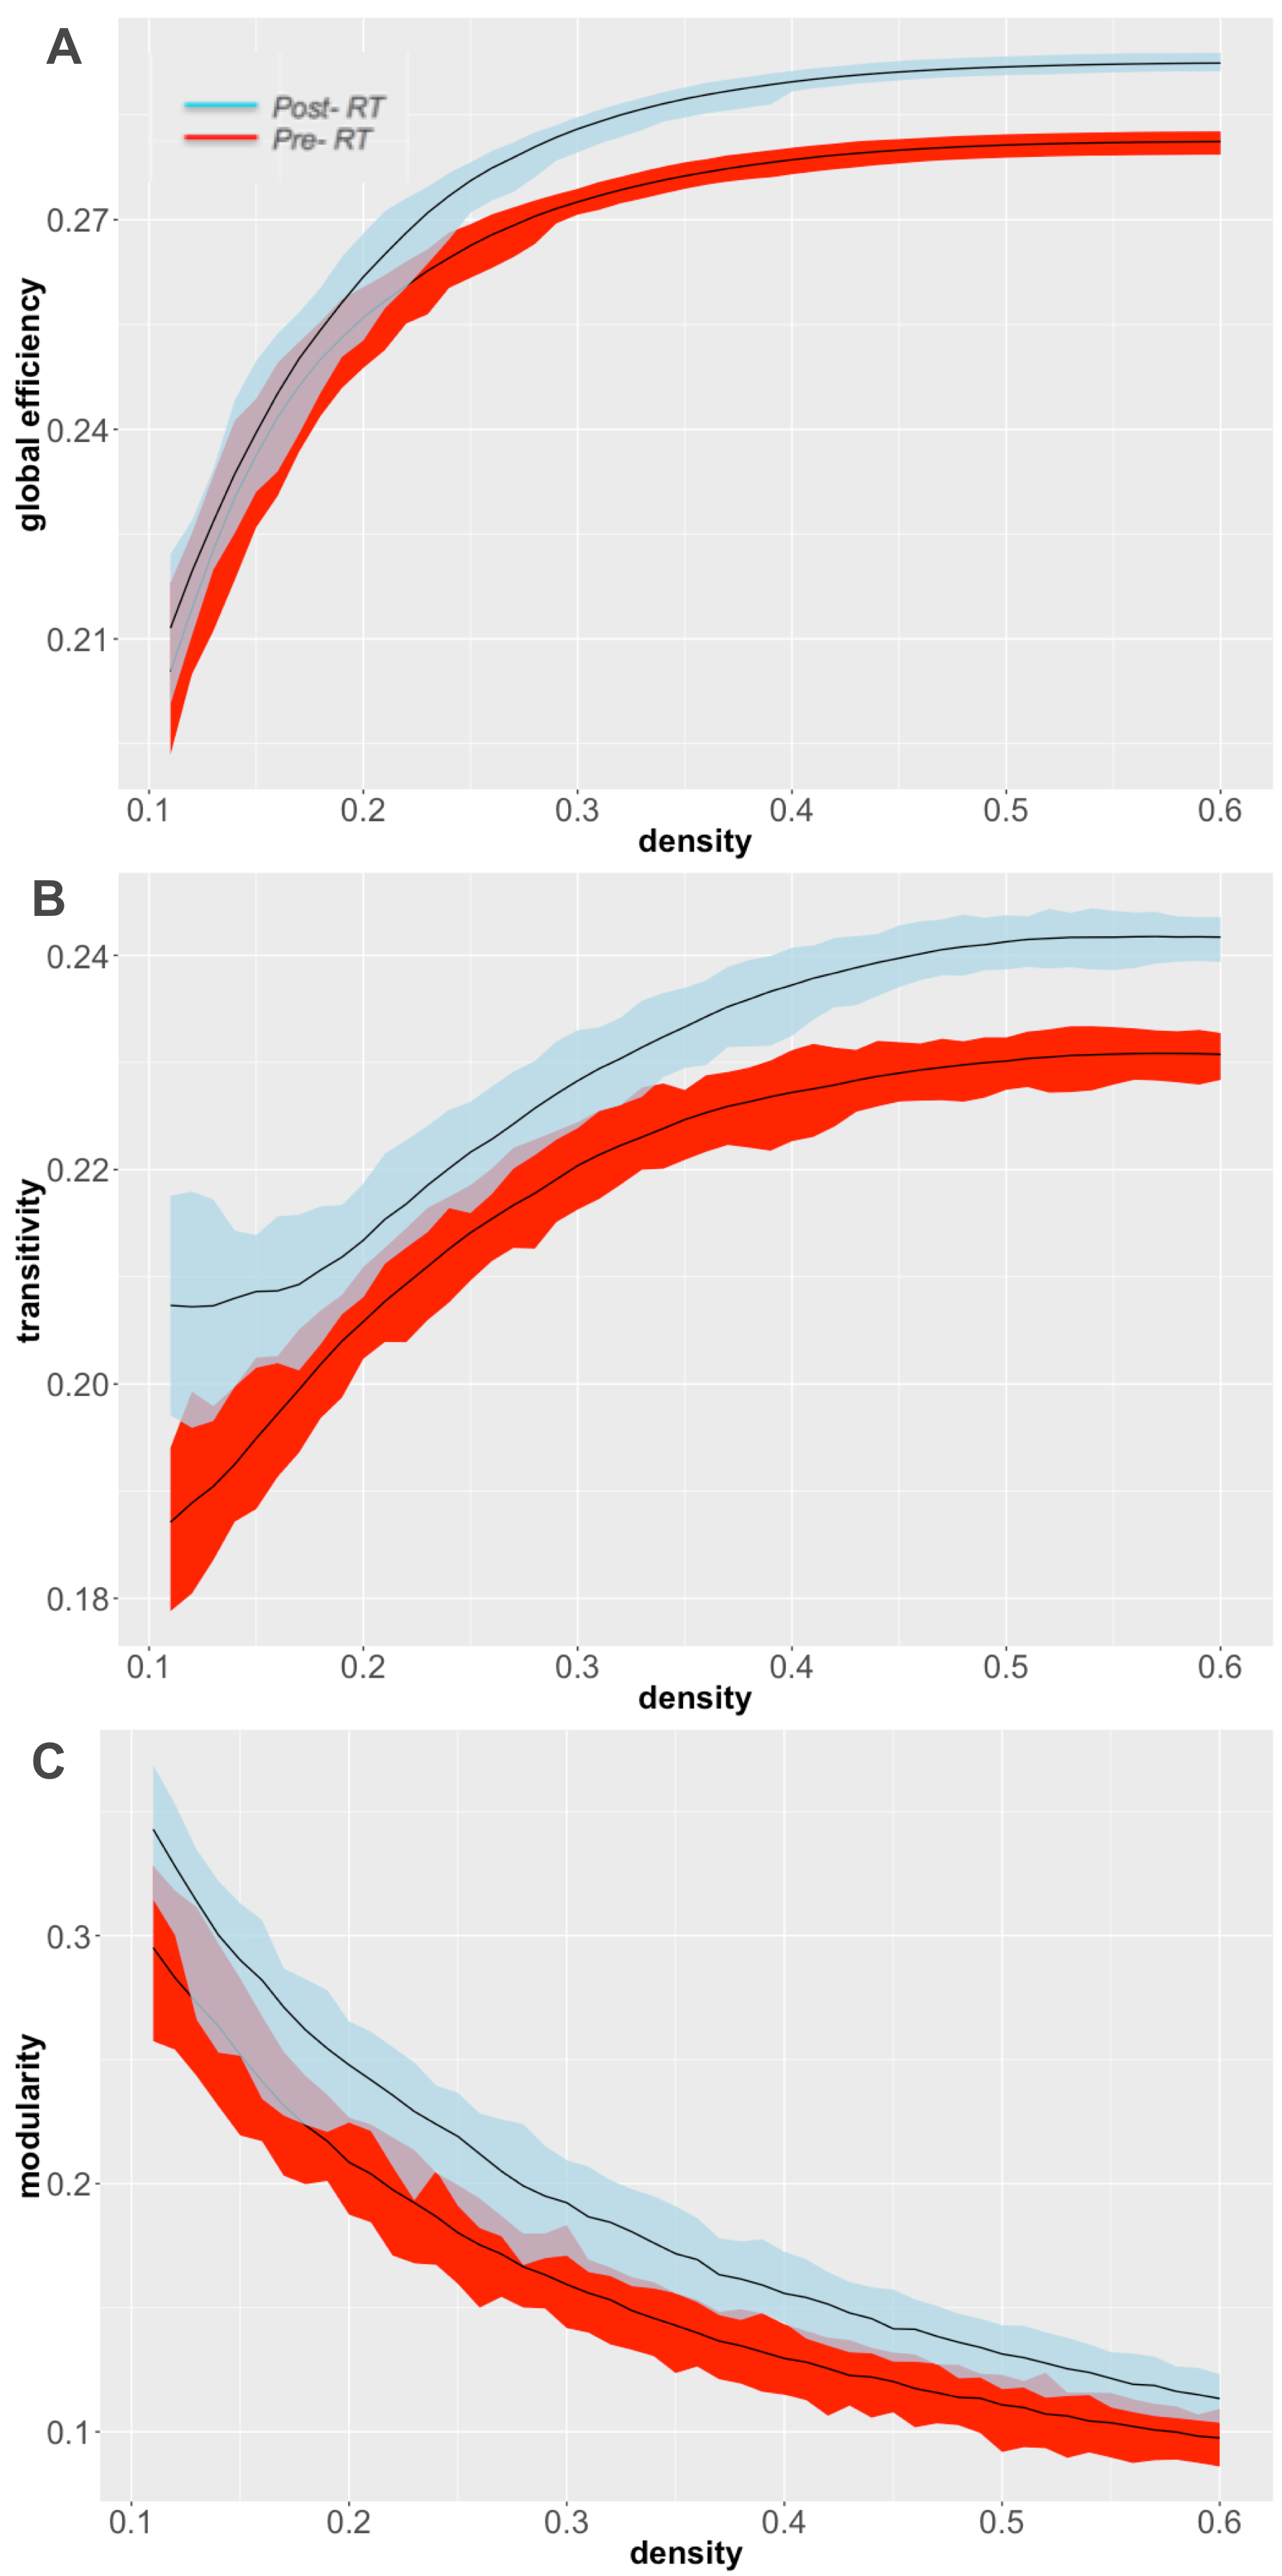
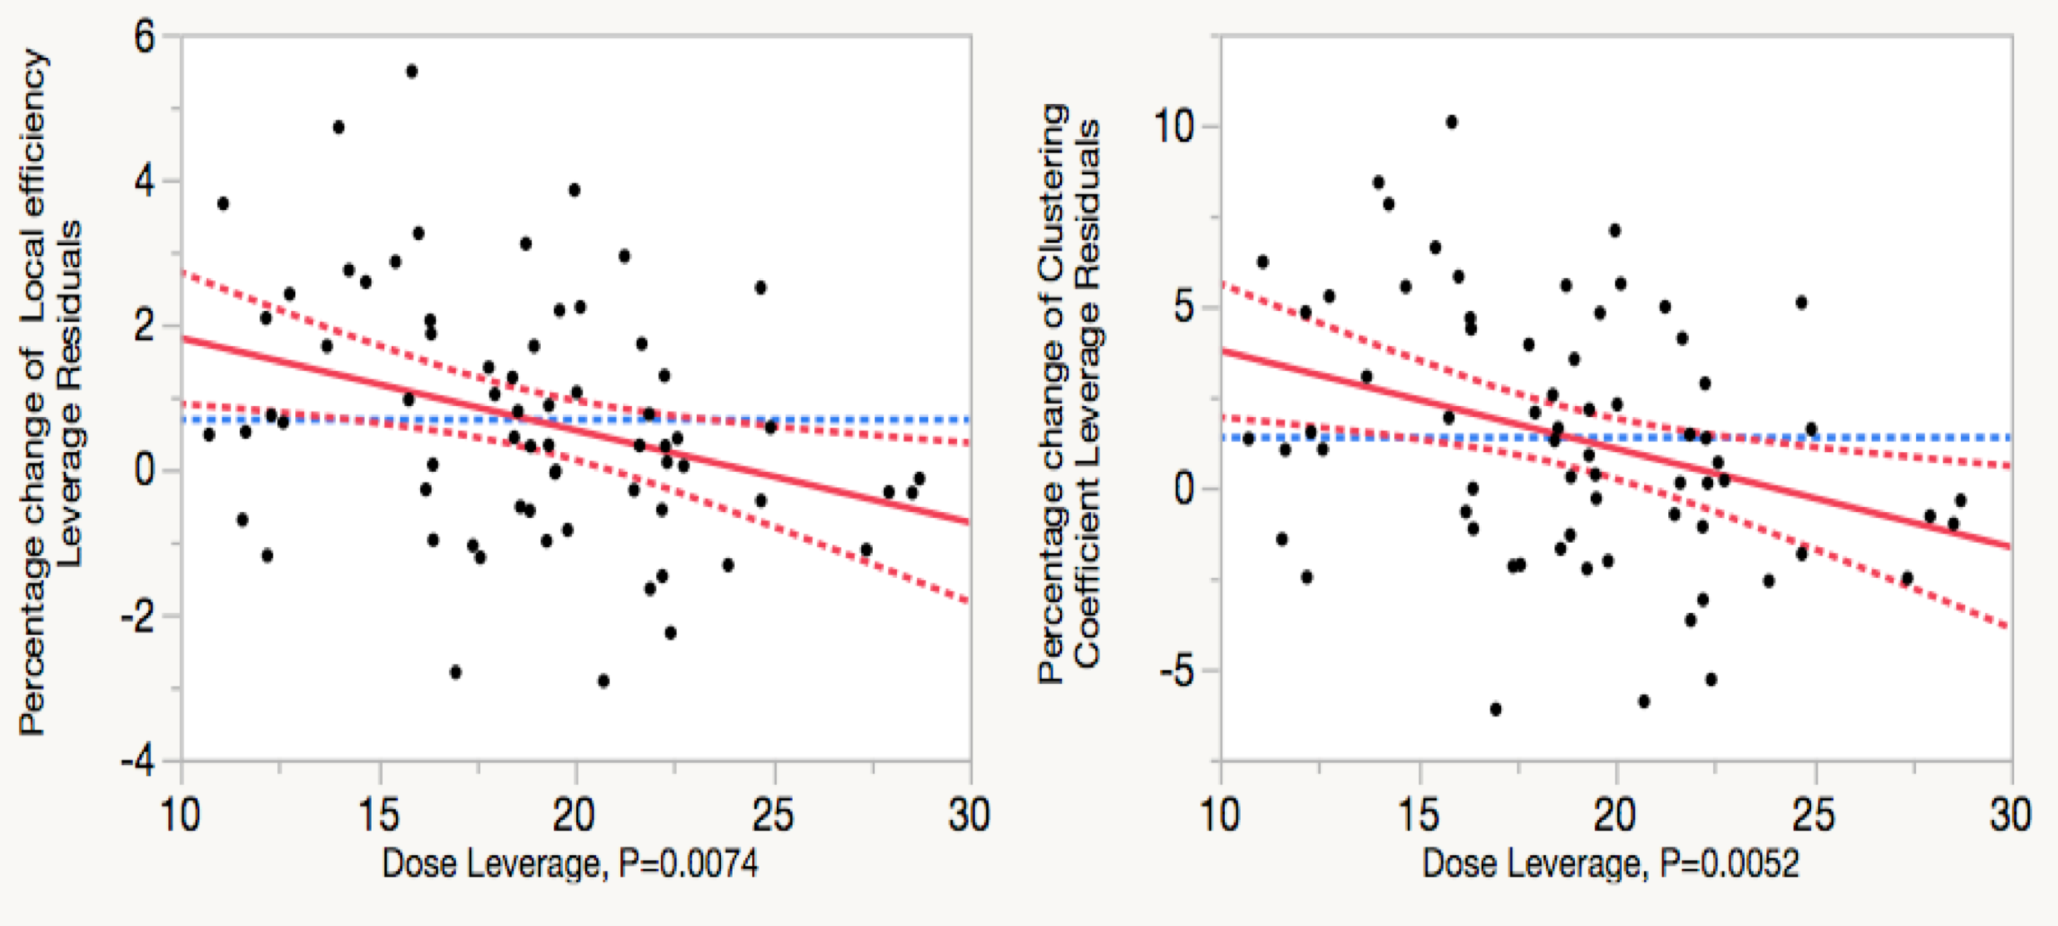
The characteristics of the patient sample can be found in Table 1. With increasingly higher values of network density, the modularity decreased whereas the global efficiency and transitivity increased at both time points (Fig. 2). Increases in global efficiency (p<0.0001, CI = [-0.0072, -0.0112], Fig. 2A), transitivity (p<0.0001, CI = [-0.0110, -0.0171; Fig 2B], and modularity (p<0.0001, CI = [-0.0176, -0.0406], Fig. 2C) were all observed in patients after RT compared to pre-RT. These changes were particularly robust at higher network densities for global efficiency and transitivity, suggesting the group differences are more noticeable in the less sparse matrices due to removal of the noisy and extremely weak connections. Decreases in local efficiency (p = 0.007, r = -0.321, Fig. 3A) and clustering coefficient (p = 0.005, r = -0.335, Fig. 3B) were seen in regions receiving higher doses of RT. Inferior parietal, post central, and rostral anterior cingulate were among the regions that had greater decreased local efficiency and clustering coefficient.Discussion
Our results illustrate that fractionated, partial brain RT contributes to structural network changes in patients with brain tumors, characterized by increases in global network integration (i.e., global efficiency) and greater segregation (i.e., increased transitivity and modularity) of cortical subnetworks. We also found local network changes to be dose-dependent in many regions critical to cognition. These changes suggest that RT contributes to a disruption in inter-regional structural connectivity that may lead to poor communication among cognitive modules in the brain. Collectively, these changes likely represent pathological processes that are most pronounced in regions receiving higher doses, which may contribute to the late delayed cognitive decline observed in many patients following RT.Conclusion
Our findings demonstrate alterations in global and local network topology following RT in patients with primary brain tumors. Further studies are needed to determine whether this kind of topology-based technique could be used to predict or monitor neurocognitive decline in patients following RT or other cancer-related therapies.Acknowledgements
No acknowledgement found.References
1. Laack, N. N. & Brown, P. D. Cognitive sequelae of brain radiation in adults. Semin. Oncol. 31, 702–713 (2004).
2. DeAngelis, L. M., Delattre, J. Y. & Posner, J. B. Radiation-induced dementia in patients cured of brain metastases. Neurology 39, 789–796 (1989).
3. Patchell, R. A. et al. Postoperative radiotherapy in the treatment of single metastases to the brain: a randomized trial. JAMA 280, 1485–1489 (1998).
4. Jovicich, J. et al. Reliability in multi-site structural MRI studies: effects of gradient non-linearity correction on phantom and human data. NeuroImage 30, 436–443 (2006).
5. Karunamuni, R. et al. Dose-Dependent Cortical Thinning After Partial Brain Irradiation in High-Grade Glioma. Int. J. Radiat. Oncol. Biol. Phys. 94, 297–304 (2016).
6. Dale, A. M., Fischl, B. & Sereno, M. I. Cortical surface-based analysis. I. Segmentation and surface reconstruction. NeuroImage 9, 179–194 (1999).
7. Fischl, B., Sereno, M. I. & Dale, A. M. Cortical surface-based analysis. II: Inflation, flattening, and a surface-based coordinate system. NeuroImage 9, 195–207 (1999).
8. Seibert, T. M. et al. Selective Vulnerability of Cerebral Cortex Regions to Radiation Dose–Dependent Atrophy. Int. J. Radiat. Oncol. • Biol. • Phys. 96, S177 (2016).
9. Desikan, R. S. et al. An automated labeling system for subdividing the human cerebral cortex on MRI scans into gyral based regions of interest. NeuroImage 31, 968–980 (2006).
10. Bassett, D. S. et al. Hierarchical organization of human cortical networks in health and schizophrenia. J. Neurosci. Off. J. Soc. Neurosci. 28, 9239–9248 (2008).
11. He, Y., Chen, Z. & Evans, A. Structural Insights into Aberrant Topological Patterns of Large-Scale Cortical Networks in Alzheimer’s Disease. J. Neurosci. 28, 4756–4766 (2008).
12. Anonymous. R: a language and environment for statistical computing. GBIF.ORG (2015). Available at: http://www.gbif.org/resource/81287. (Accessed: 28th October 2016)
13. Dewey, M. E. in Encyclopedia of Biostatistics (John Wiley & Sons, Ltd, 2005).
14. Support Overview. Available at: http://www.jmp.com/en_us/support.html. (Accessed: 28th October 2016)
Figures