4187
Predicting pre-surgical language lateralization using resting state fMRI in patients with neuropathologies1Anatomy and Neuroscience, The University of Melbourne, Parkville, Australia, 2Radiology, The University of Melbourne, Parkville, Australia, 3Epworth Medical Imaging, Richmond, Australia
Synopsis
We present a quantitative resting state fMRI method for determining the laterality of language processing in patients undergoing neurosurgical procedures. The results show that laterality indices based on the resting state fMRI can predict a patient’s laterality based on a language task fMRI. This has potential for guiding neurosurgical interventions in patients unable to perform task fMRI exams or during surgery with an interventional MRI scanner.
Purpose
To investigate whether language laterality could be successfully quantified by a laterality index based on resting state fMRI (rsfMRI)1 in patients with neuropathologies referred for imaging prior to neurosurgical intervention. It was our aim to determine whether rsfMRI is comparable to task-activated fMRI in the lateralisation of Broca’s and Wernicke’s areas. This study explores the feasibility of resting state fMRI as a clinical tool in preoperative language localisation. Resting state fMRI offers a growing insight into the functioning of the healthy and diseased brain2,3 and has been shown to be comparable to task-activated fMRI in identifying eloquent 4-6. While a recent study showed that rsfMRI has potential for delineating surgically resectable brain regions from eloquent language cortex7, there is still a paucity of research into the prognostic ability of rsfMRI for language lateralisation.Methods
Twenty four subjects who had undergone task-activated fMRI for clinical purposes at The Royal Melbourne Hospital between July 2010 and June 2015, and in whom resting state data had been acquired, were enrolled in the study. Three patients were excluded due to severe motion artifacts during one of the fMRI acqusitions. Resting state fMRI data underwent preprocessing and functional connectivity analysis using seed-based correlation mapping. Resting state connectivity maps were generated by computing the spearman rank correlation coefficient of each voxel to the seed regions and thresholded at R>0.6. Quantitative analysis comprised a voxel count (VC) representing the number of voxels in a frontotemporal mask demonstrated connectivity with Broca’s and Wernicke’s seed areas. The LI index was computed for each seed region as (VCright-VCleft)/(VCright+VCleft)*100. The task-activated fMRI activation maps (t-scores > 2.3 and p<0.05 with Bonferoni correction) were computed from fMRI data collected during a language paradigm. A neuroradiologist (PP) with significant experience in analyzing clinical fMRI data coded the subjects as left dominant or right/co dominant. A Wilcoxon rank sum test was used to test whether the rsfMRI LI indices were different between the two groups. In addition. Receiver operating characteristic (ROC) analyses were also performed to explore how accurately rsfMRI could predict language lateralization.Results
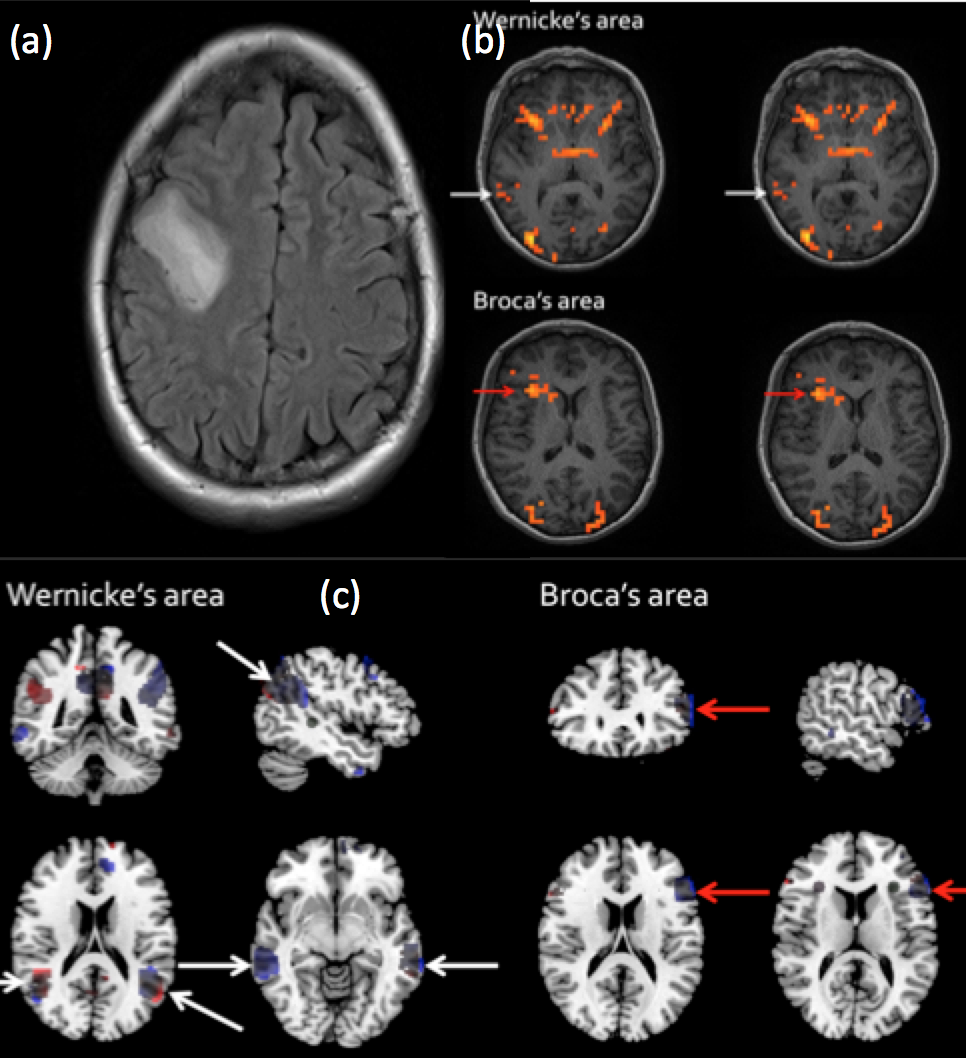
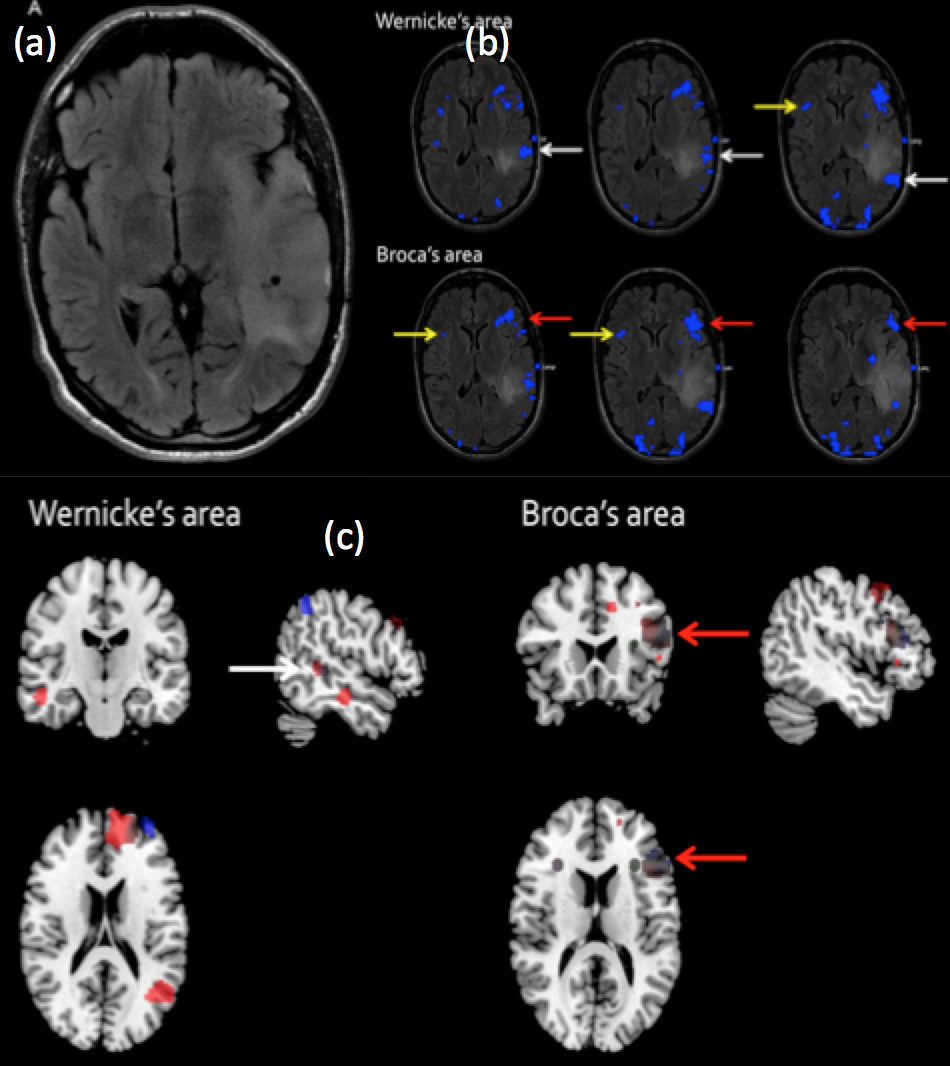
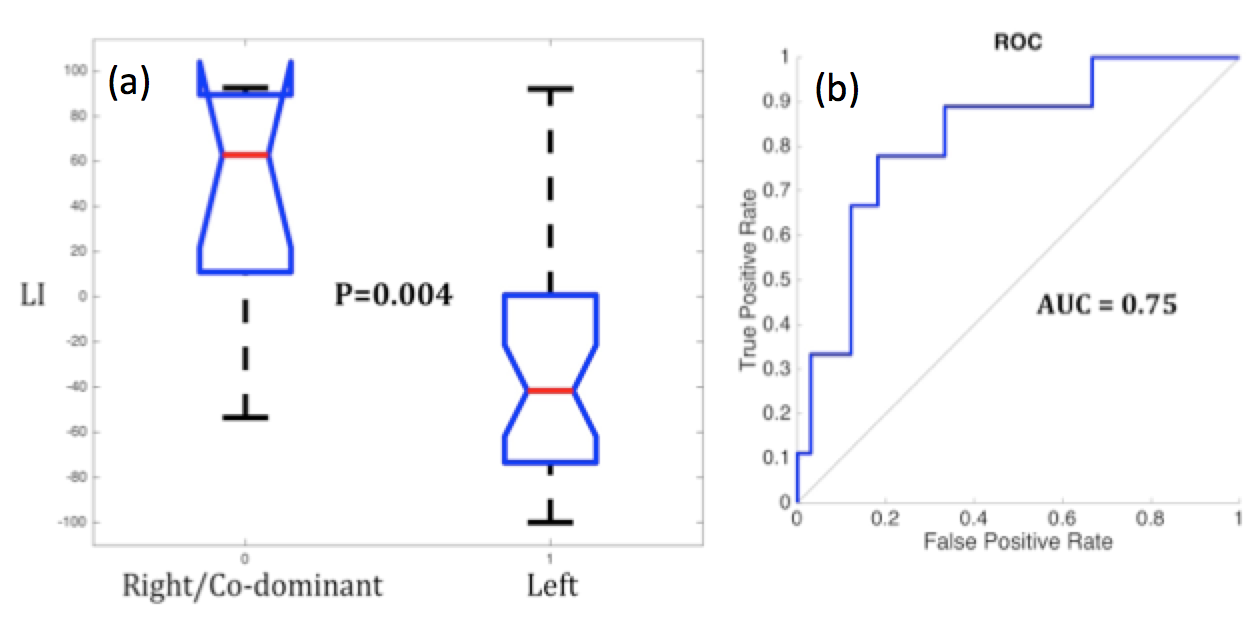
Figure 1 shows a right frontal tumour patient compared to a left frontal tumour patient with different language lateralisations. In the resting state figures, the Blue regions show areas significantly correlated to the right seed regions while red regions indicate correlation with left seed regions. The considerably greater blue voxels in patient 1 is concordant with task fMRI indicating right dominance, while the greater volume of red voxels in patient 2 is concordant with left dominance predicted by the task fMRI activations. Figure two shows a comparison of the LI values for the two groups, which were significantly (p<0.005) between the two groups. The ROC analysis indicated the diagnostic performance (Figure 2b) was very good with a significant (p=0.04) AUC of 0.75 (0.14 SD).Discussion
Providing reliable information regarding patient language lateralization is important for the pre-planning of neurosurgeries likely to involve areas of eloquent cortex8. We found that rsfMRI is reasonably accurate in lateralising Broca’s and Wernicke’s areas, in line with the results of previous studies1,3,7. Although resting state fMRI is not yet equipped to replace task-activated fMRI in the preoperative setting, it can be considered as a complement and ultimately may be a potential alternative in cases where task-activated fMRI is not feasible. Task based fMRI is an established and reliable tool in preoperative assessment however it is known to lack the accuracy of the gold standard Wada testing, and is often problematic in neuropathological patients with significant impairment. This is the first study to our knowledge comparing resting state and task-activated fMRI in preoperative language localisation in subjects with brain tumours and other pathology. Future research involving larger scale studies and considering postoperative outcomes is needed to refine the methodology and increase confidence in this model of language localisation.
Conclusion
This study showed, for the first time, that a rsfMRI based lateralization index was predictive of task based language lateralisation. Thus it has potential clinical utility in the intraoperative setting as well as preoperatively, particularly in patients in whom the task-activated study is not feasible.Acknowledgements
The work was supported by a research collaboration agreement with Siemens Healthcare.References
1. Tomasi D, Volkow ND. Resting functional connectivity of language networks: characterization and reproducibility. Mol Psychiatry. 2012 Jul;17(8):841–54.
2. Fox MD, Greicius M. Clinical applications of resting state functional connectivity. Front Syst Neurosci. 2010;4:19.
3. Muller AM, Meyer M. Language in the brain at rest: new insights from resting state data and graph theoretical analysis. Front Hum Neurosci. 2014;8:228.
4. Toro R, Fox PT, Paus T. Functional coactivation map of the human brain. Cereb Cortex. 2008 Nov;18(11):2553–9.
5. Smith SM, Fox PT, Miller KL, Glahn DC, Fox PM, Mackay CE, et al. Correspondence of the brain's functional architecture during activation and rest. Proc Natl Acad Sci USA. 2009 Aug 4;106(31):13040–5.
6. Di X, Gohel S, Kim EH, Biswal BB. Task vs. rest-different network configurations between the coactivation and the resting-state brain networks. Front Hum Neurosci. 2013;7:493.
7. Cochereau, et al. (2016), Comparison between resting state fMRI networks and responsive cortical stimulations in glioma patients. Hum. Brain Mapp., 37: 3721–3732. doi:10.1002/hbm.23270
8. Gazit, Tomer, et al. "Probabilistic machine learning for the evaluation of presurgical language dominance." Journal of neurosurgery (2016): 1-13.
Figures