4184
Histogram Analysis of Intravoxel Incoherent Motion in Peritumoral Edema for Distinguishing between Central Nervous System Lymphoma and Other Brain Tumors1Radiology, Fujita Health University, Toyoake, Japan, 2Radiology, Fujita Health University Hospital, Toyoake, Japan, 3Toshiba Medical Systems Corporation, Japan, 4Joint Research Laboratory of Advanced Medical Imaging, Fujita Health University, Toyoake, Japan
Synopsis
Additional benefits of quantitative analysis of peritumoral edema for distinguishing between brain tumors by diffusion weighted image or dynamic susceptibility contrast MRI has been described. Our aim was to investigate the hypothesis that quantitative analysis of intravoxel incoherent motion (IVIM) in peritumoral edema may be a useful parameter for distinguishing between central nervous system lymphoma (CNSL) and other brain tumors. Quantitative analysis of IVIM indicates that D* and f maps of CNSL visually showed increase values in peritumoral edema. Our results indicate that these IVIM parameters have been successfully applied to obtain quantitative estimates of the vascularity and perfusion in peritumoral edema for differenciating CNSL and others without gadolinium contrast agent.
PURPOSE
Additional
benefits of quantitative analysis of peritumoral edema for differentiating
between glioblastoma and central nervous system lymphoma (CNSL), or metastasis by diffusion weighted
image or dynamic susceptibility contrast MRI has been described.
Intravoxel
incoherent motion (IVIM) MR imaging1 is a method that was initially introduced and developed
to quantitatively assess the true diffusion decay (D), pseudo-diffusion
decay (D*) and perfusion fraction (f) by using diffusion-weighted imaging. Our aim was to investigate the hypothesis that quantitative analysis of IVIM in peritumoral
edema may be a useful parameter for distinguishing between CNSL and other brain
tumors.
METHODS
The subjects were 16 consecutive patients (8 men and 8 women; age range, 47 – 90 years; mean age, 71.3 years) who had undergone MRI examination, including IVIM on a 3T MRI unit (Vantage Titan 3T; Toshiba) with a 32-channel head coil from May 2016 to October 2016. Among the enrolled patients, there were 4 CNSLs and 5 high-grade gliomas (HGG) and 7 meningiomas (MNG). We acquired 12 different b-values (1, 5, 10, 20, 30, 50, 75, 100, 250, 500, 750 and 1000 s/mm2) in 3 orthogonal directions. We acquired IVIM images with the following parameters: section thickness, 5mm; field of view, 220*220 mm2; matrix, 128*128 (256*256); repetition time / echo time, 4500/90 msec; number of excitations, 1; parallel imaging with an acceleration factor of three. The curve was fitted for higher b-values for D, fitted for D* and f for all the b-values by biexponential model. Post-processing of IVIM was performed by using the dedicated post-processing software (Olea Medical tumor application, Vitrea Workstation, Toshiba). We manually placed a round region-of-interest (ROI) on high T2-weighted signal intensity around the contrast-enhanced lesion in the slice of maximum lesion, which were copied to the corresponding D, D* and f maps. First, we evaluated the differences in t values between CNSL, HGG and MNG for determining the most appropriate percentile of D, D* and f maps. Second, the differences in D, D* and f maps were investigated by histogram analysis with the best percentile.RESULTS
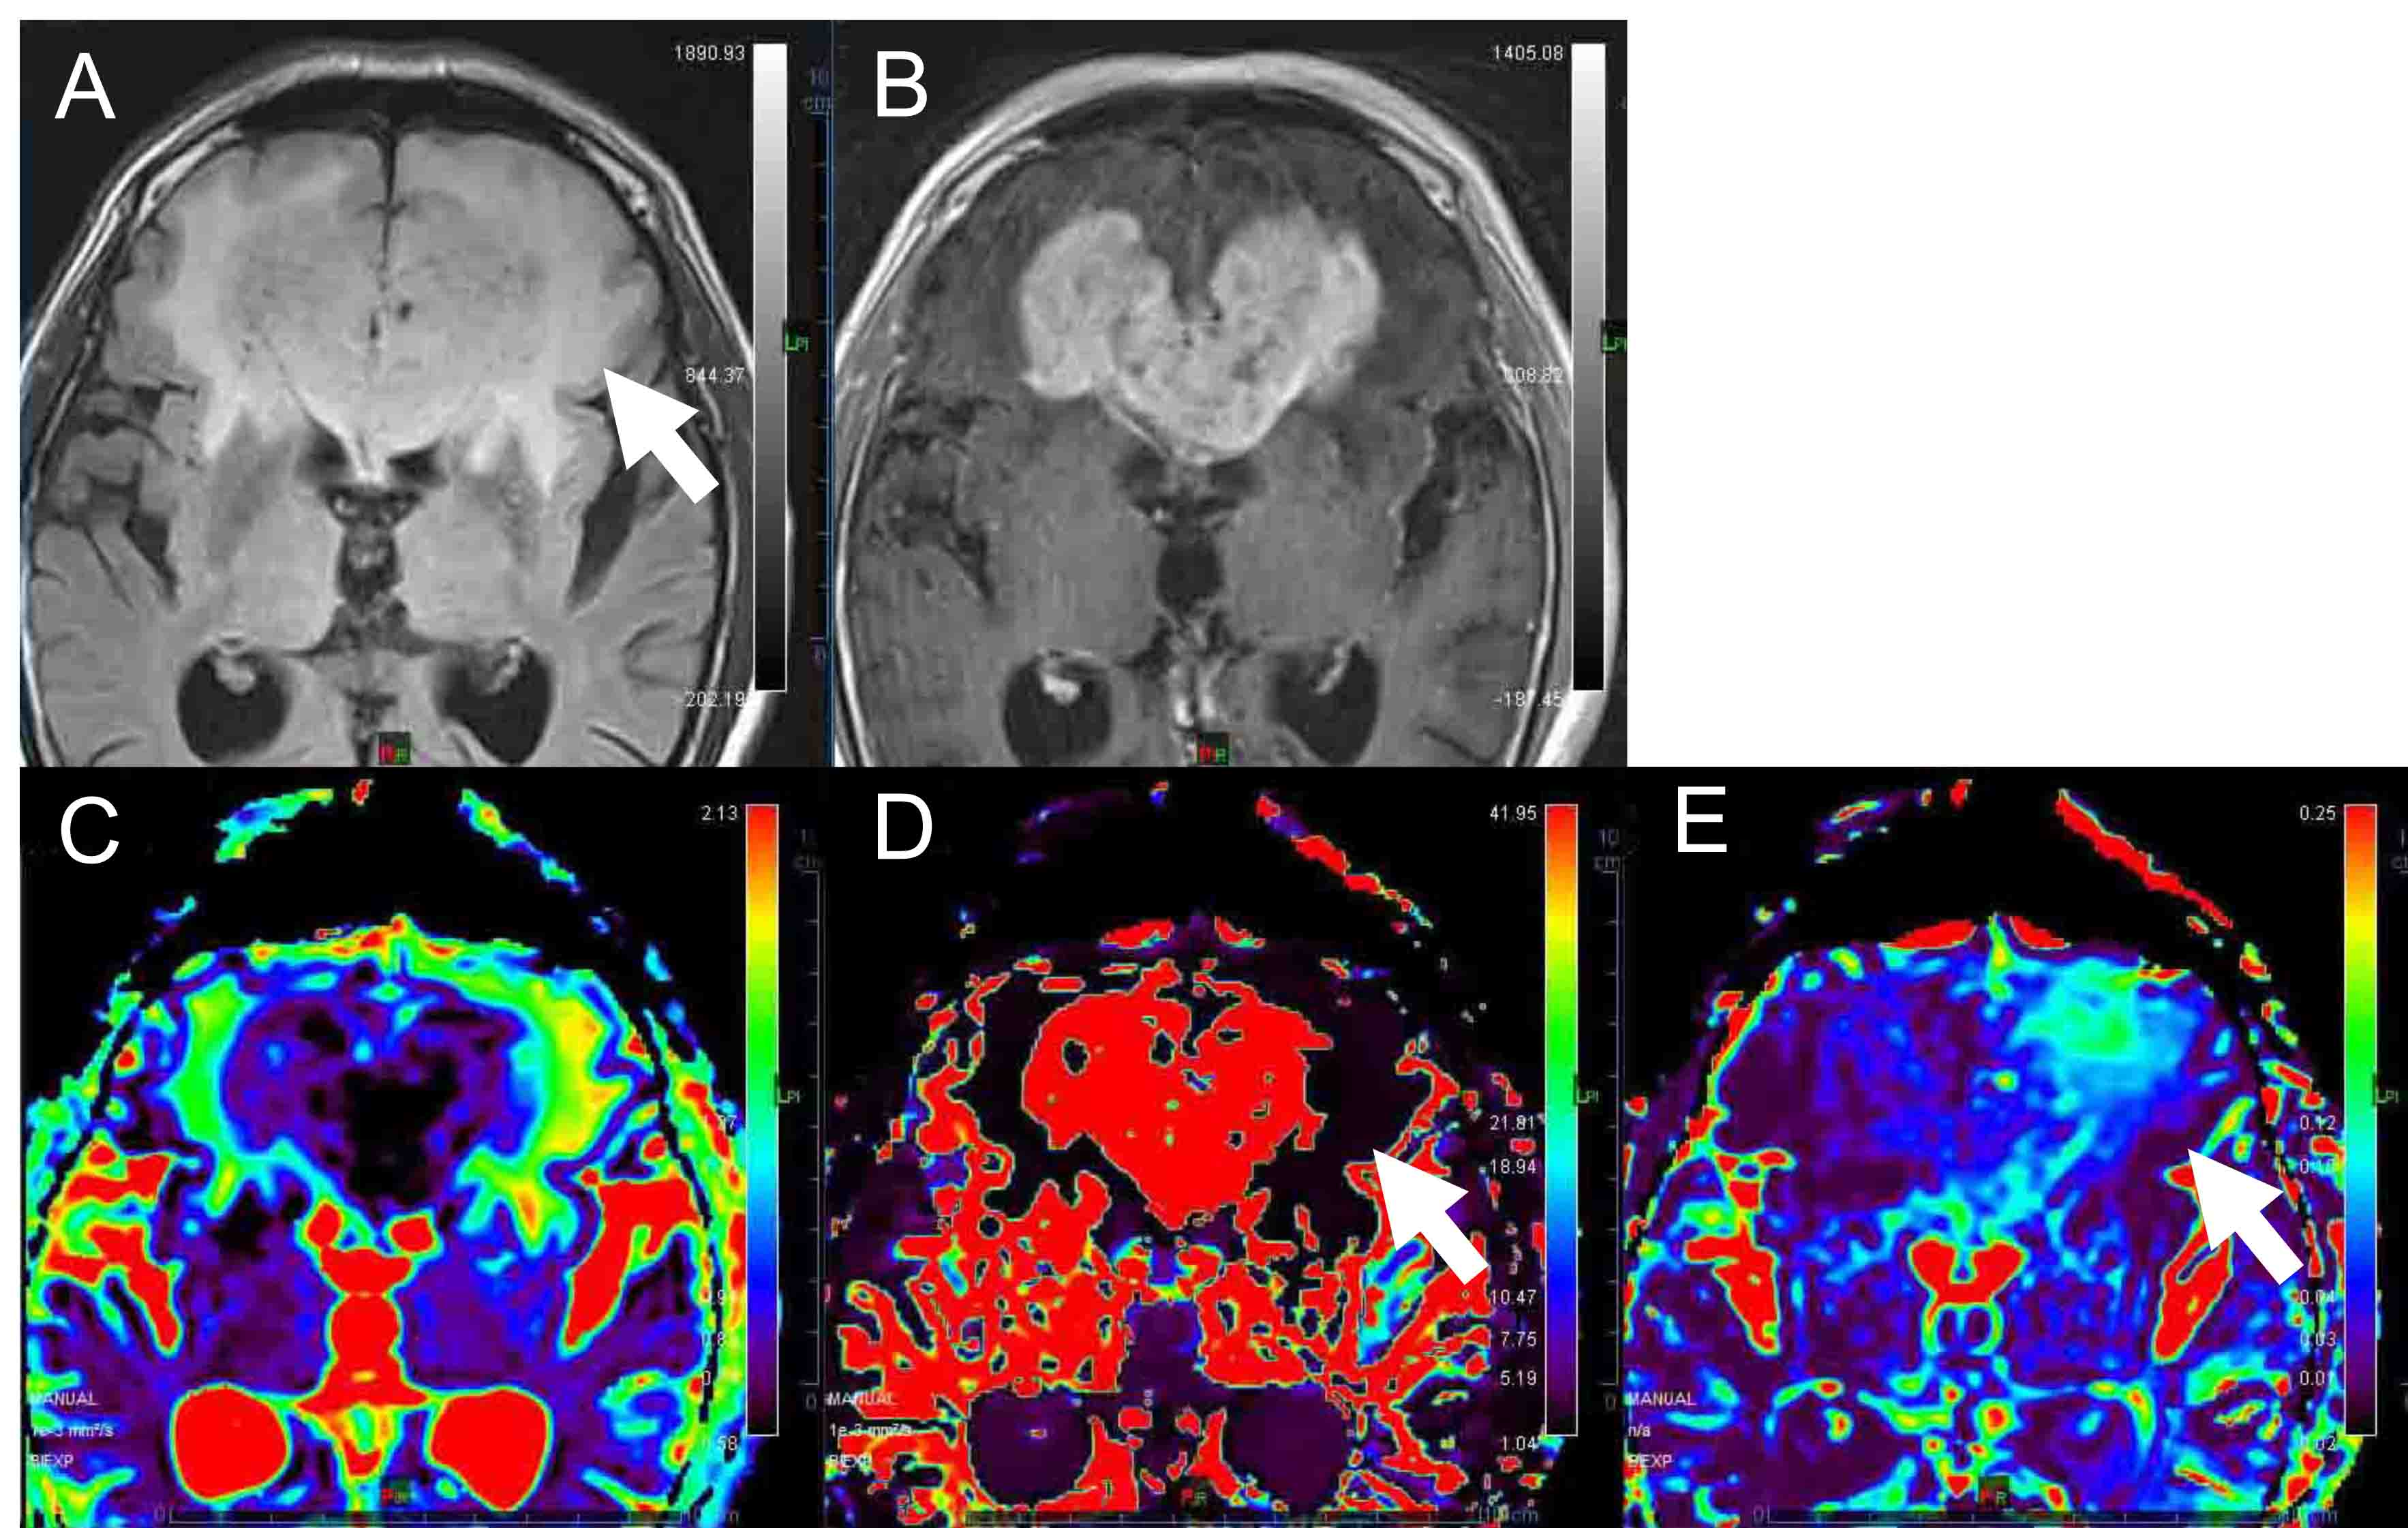
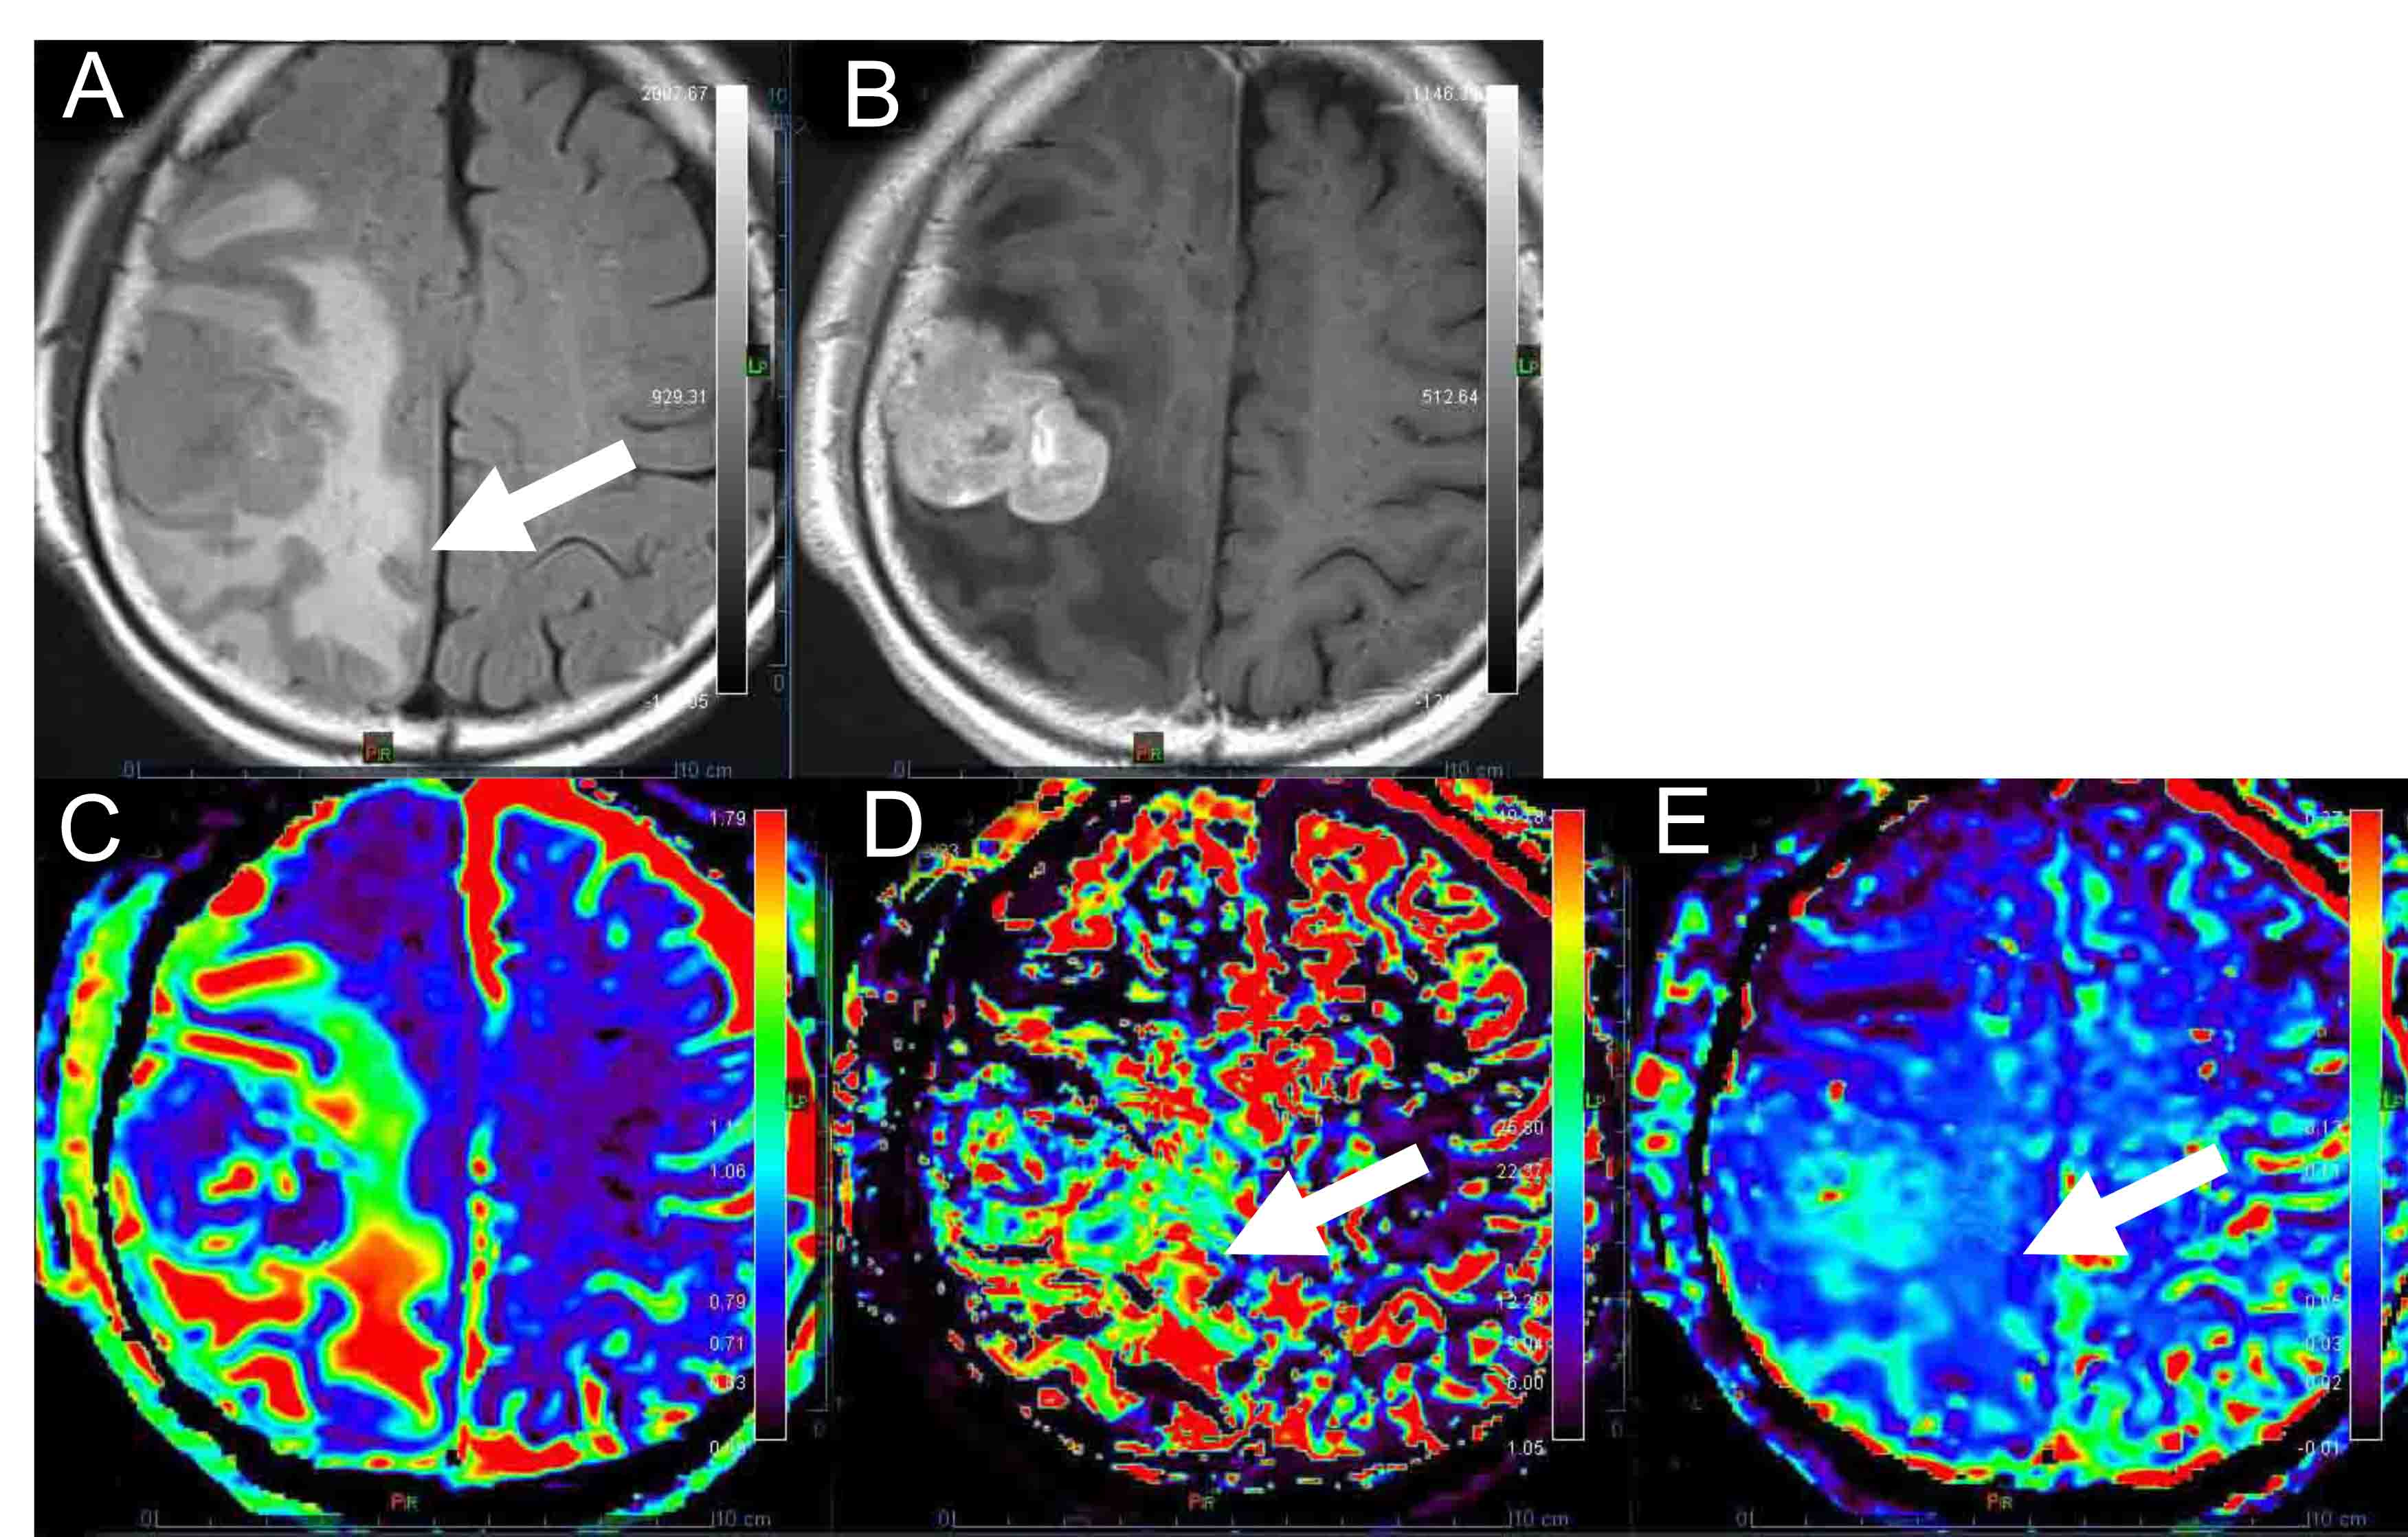
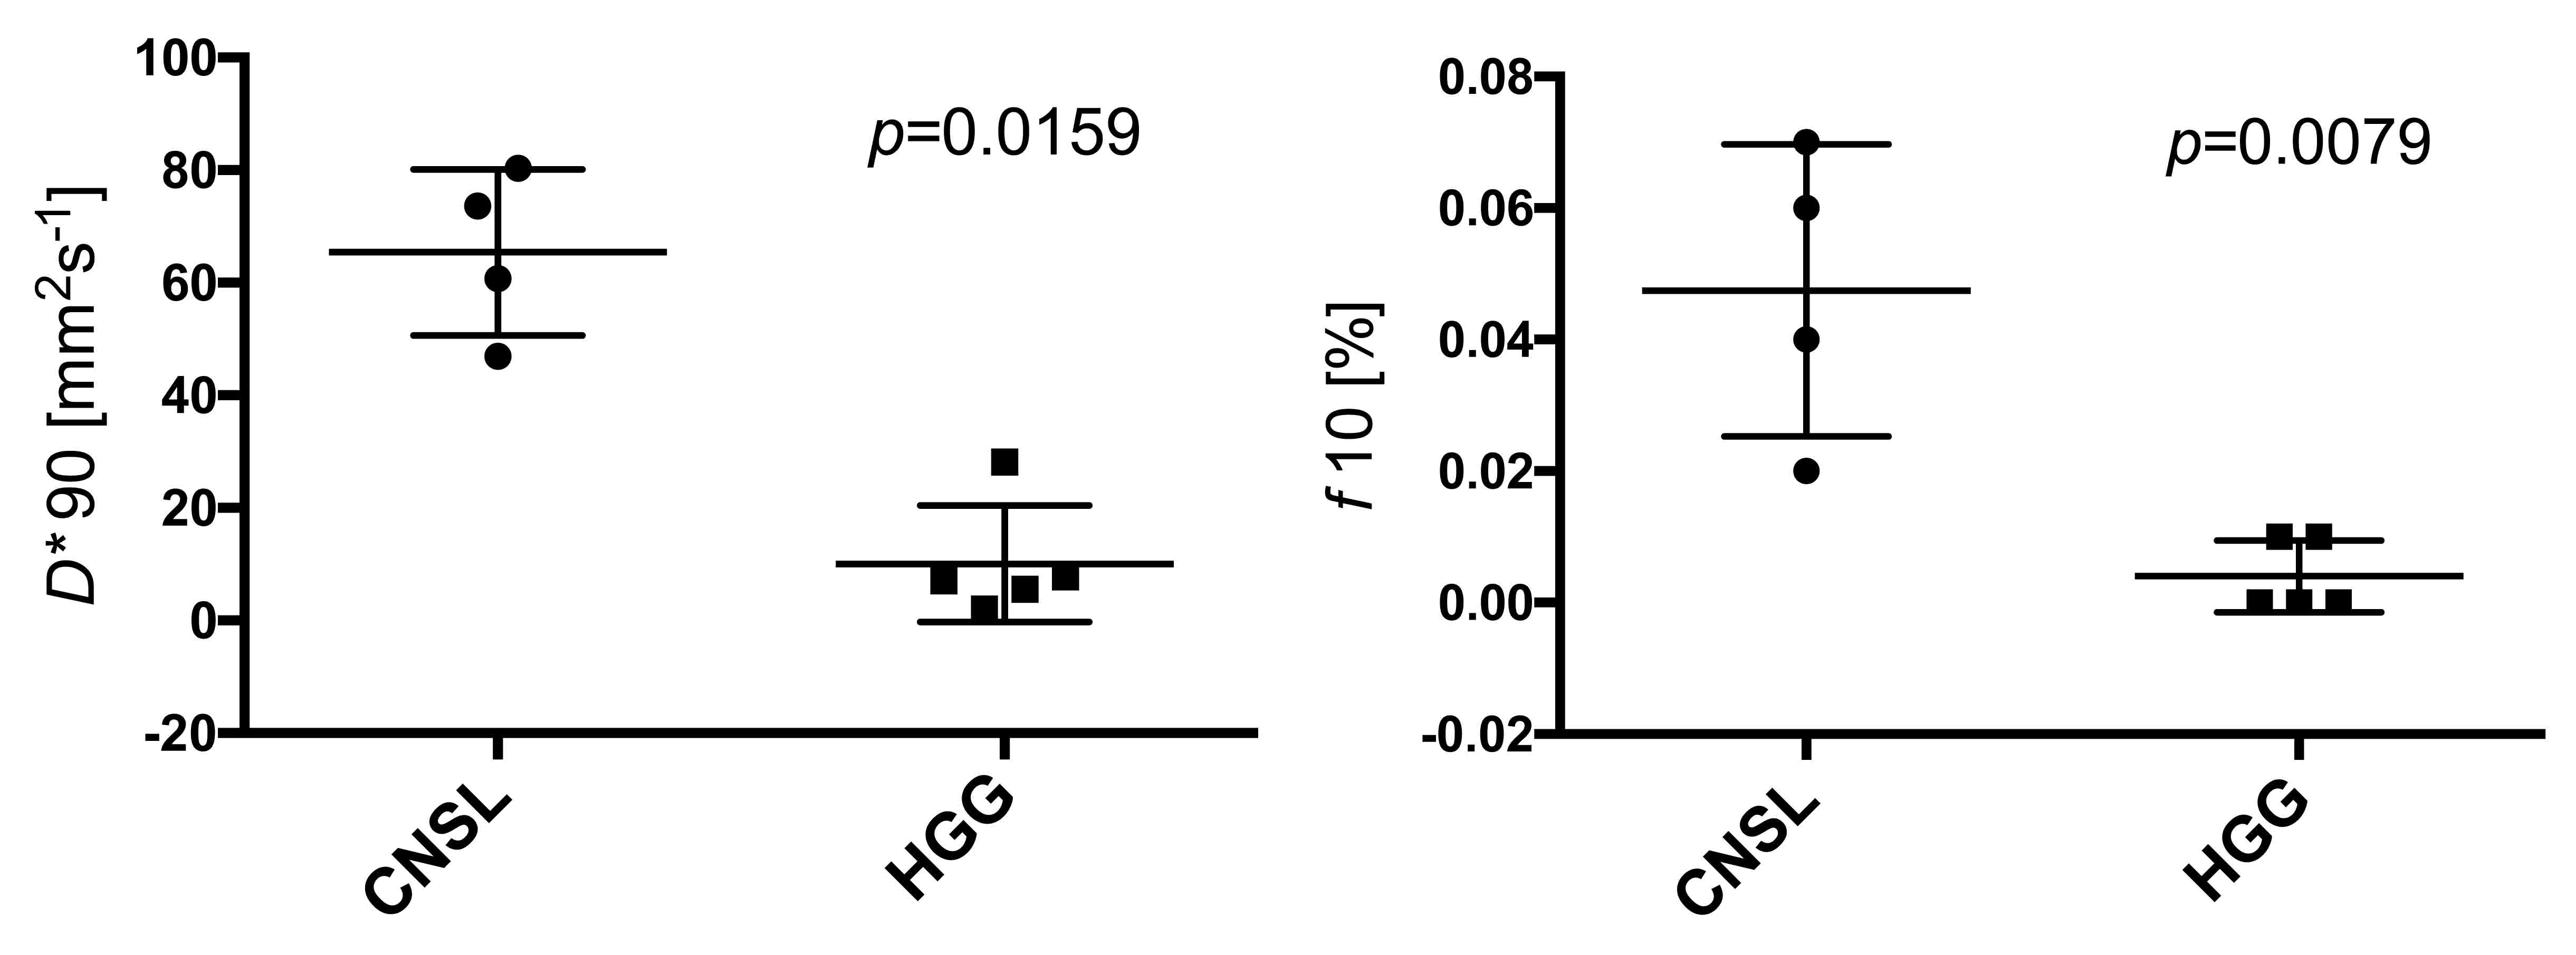
There were some differences of D, D* and f map in the best differential percentile between brain tumors. The 98th percentile for D* map was significantly higher in CNSL than in MNG (88.75±3.24 mm2s-1 versus 9.83±7.34 mm2s-1, p=0.0061), the 90th percentile for D* map was significantly higher in CNSL than in HGG (67.20±14.76 mm2s-1 versus 7.04±10.32 mm2s-1, p=0.0159), the 3rd percentile for D* map was significantly lower in HGG than in MNG (1.33±0.10 mm2s-1 versus 1.72±0.21 mm2s-1, p=0.0051). The 10th percentile for f map was significantly higher in CNSL than in HGG (0.05±0.02 % versus 0.00±0.01 %, p=0.0079), the 100th percentile for f map was significantly lower in CNSL than in MNG (0.17±0.04 % versus 0.91±0.29 %, p=0.0364). There are no significantly differences in D map between CNSL, HGG and MNG. D* and f maps of CNSL visually showed increase of D* and f values in peritumoral edema.DISCUSSION
Quantitative analysis of D* and f in the peritumoral edema indicates that there are statistical differences between CNSL and others. Especially D* and f maps show higher in peritumoral edema of CNSL than HGG. In addition to the mass effect of brain tumors, peritumoral edema might suggest lymphocyte proliferative responses in CNSL, glioma infiltration in HGG, which might be associated with pathological component. The results of this study indicate that D* and f might be useful in differentiating between the peritumoral edema of CNSL and others. The functional implication for IVIM parameters were reported that D* is associated with perfusion parameter like cerebral blood flow and mean transit time, f is associated with cerebral blood volume2. Some evidences are reported that perfusion weighted images of peritumoral edema can aid in the differentiating brain tumors3. Our results indicate that these IVIM parameters have been successfully applied to obtain quantitative estimates of the vascularity and perfusion in peritumoral edema for differenciating CNSL and others without gadolinium contrast agent. Because the optimal cut off values are changed by the perfusion parameter and study subject, the optimal percentile must be reviewed each lesion and parameter and histogram analysis is better for evaluation of brain tumors. Histological correlation of IVIM parameters should be investigated in more subjects.CONCLUSION
Quantitative analysis of IVIM in the peritumoral edema indicates that D* and f maps of CNSL visually showed increase values in peritumoral edema. Our results indicate that these IVIM parameters have been successfully applied to obtain quantitative estimates of the vascularity and perfusion in peritumoral edema for differenciating CNSL and others without gadolinium contrast agent.Acknowledgements
No acknowledgement found.References
1. Federau C, Maeder P, O'Brien K, et al. Quantitative measurement of brain perfusion with intravoxel incoherent motion MR imaging. Radiology 2012;265:874-881
2. Federau C, O'Brien K, Meuli R, et al. Measuring brain perfusion with intravoxel incoherent motion (IVIM): initial clinical experience. J Magn Reson Imaging 2014;39:624-632
3. Lin L, Xue Y, Duan Q, et al. The role of cerebral blood flow gradient in peritumoral edema for differentiation of glioblastomas from solitary metastatic lesions. Oncotarget 2016 [Epub ahead of print].
Figures