4183
Evaluation of intravoxel incoherent motion in pituitary adenoma using turbo spin-echo diffusion-weighted imaging1Radiology, Kagoshima University Medical and Dental Hospital, Kagoshima, Japan, 2Neurosurgery, Kagoshima University Medical and Dental Hospital, Kagoshima, Japan, 3Clinical Engineering Department Radiation Section, Kagoshima University Hospital, Kagoshima, Japan, 4Philips Healthcare, Tokyo
Synopsis
Our purpose was to evaluate the intravoxel incoherent motion (IVIM) in the pituitary adenoma using turbo spin-echo diffusion-weighted imaging (TSE-DWI). The f (perfusion fraction) in the pituitary adenoma was significantly lower than that in the normal pituitary gland, which is consistent with histopathologically known lower microvascular density in adenomas compared to normal pituitary tissue. There was no significant correlation between the f and the volume in pituitary adenomas. TSE-DWI-based IVIM imaging is a viable imaging technique for assessment of vascularity in skull base lesions including pituitary adenoma.
PURPOSE
The intravoxel incoherent motion (IVIM) imaging is an advanced diffusion-weighted imaging (DWI) technique that allows for a separate quantitative evaluation of all the microscopic random motions that contribute to DWI, which are essentially represented by molecular diffusion and blood microcirculation (perfusion)1. Single-shot echo-planar (EP)-DWI is most commonly used for IVIM imaging. However, EP-DWI is associated with strong susceptibility artifacts that cause image degradation in the skull base, making it difficult, if not impossible to measure the IVIM parameters accurately. Recently, we succeeded the IVIM assessment in the normal anterior pituitary lobe2 using a turbo spin-echo-based DWI sequence (TSE-DWI). The purpose of this study was to evaluate the IVIM in pituitary adenoma using TSE-DWI.METHODS
Ten consecutive patients with a pituitary adenoma (9 macroadenomas and 1 microadenoma, 9 nonfunctioning pituitary adenoma and 1 GH secreting pituitary adenoma: mean age, 55.3 ± 13.8 years; range, 37-79 years) who underwent subsequent surgical resection, and 15 consecutive patients without pituitary disease (mean age, 51.5 ± 17.3 years; range, 23-86 years) were included in this prospective study. We performed IVIM imaging using a TSE-DWI sequence with 13 different b values on a 3T MR imager: TR/TE 3,000/52 ms; flip angle 90°; FOV 120 mm; imaging matrix 68 x 63; number of excitations 3; b 0, 10, 20, 30, 50, 80, 100, 200, 300, 400, 600, 800, and 1,000 s/mm2; 3 orthogonal MPG directions. A 3 mm-thick coronal slice was placed. The imaging time was 5 min and 33s. The true diffusion coefficient (D), perfusion fraction (f), and pseudo-diffusion coefficient (D*) were calculated by fitting the IVIM model to the measured signal changes for each voxel. The D, f, and D* in the pituitary adenomas were compared with those in the normal pituitary glands using Mann-Whitney U test. Moreover, we evaluated the correlation between the f and the volume of the pituitary adenoma using Pearson’s correlation analysis.RESULTS
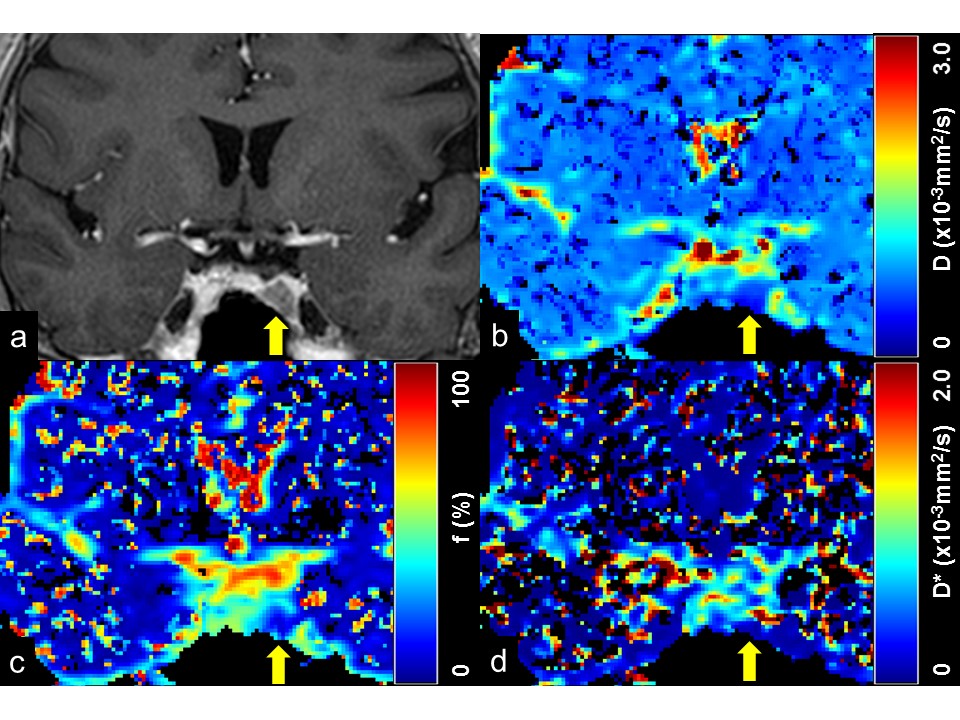
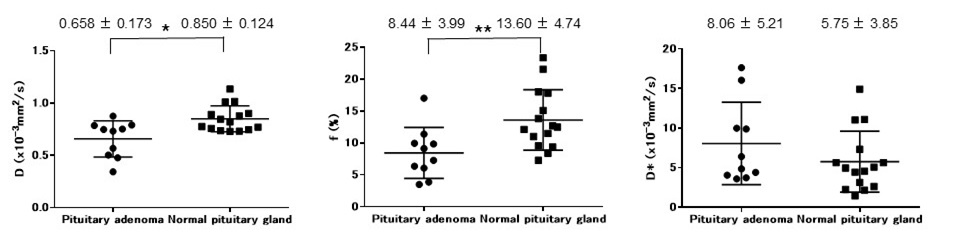
In all patients, pituitary adenoma was visualized with minimal image degradation, allowing IVIM assessment (Figure 1). The mean D (x10-3 mm2/s) in the pituitary adenoma was 0.658 ± 0.173, which was significantly lower than that in the normal pituitary gland (0.850 ± 0.124, P < 0.05) (Figure 2a). The mean f (%) in the pituitary adenoma was 8.44 ± 3.99, which was significantly lower than that in the normal pituitary gland (13.60 ± 4.74, P < 0.01) (Figure 2b). No significant difference was found in the mean D* (x10-3 mm2/s) between pituitary adenoma (8.06 ± 5.21) and the normal pituitary gland (5.75 ± 3.85) (Figure 2c). The volume of pituitary adenoma ranged from 0.2 to 12.4 ml. Pearson’s correlation analysis indicated that there was no significant correlation between f and tumor volume (r = 0.193, P = 0.594).DISCUSSION
To the best of our knowledge, this is the first report of IVIM assessment in pituitary adenoma. It was reported that TSE-DWI sequence is associated with much less susceptibility-related image degradation compared to EP-DWI in the skull base2. In our study, TSE-DWI allowed for IVIM assessment in the pituitary adenoma in all patients. Notably, we were able to evaluate IVIM in an intrasellar adenoma (Figure 1). The pituitary adenoma was shown to have lower D and f than the normal pituitary gland. Previous histopathological studies reported that vascular counts in pituitary adenomas were significantly lower than that in the normal pituitary gland3. Theoretically, the f is considered to be proportional to the blood volume. Lower f in pituitary adenomas may be related to histological lower microvascular density compared to normal pituitary gland. Currently, evaluation of pituitary lesions requires contrast-enhanced imaging, typically dynamic contrast-enhanced studies. Our results suggest that IVIM based on TSE-DWI may serve as an alternative imaging method for patients with impaired renal function or allergic reactions to contrast agents. There was no significant correlation between f and volume in pituitary adenomas. Previous pathological studies have shown that there is no significant correlation between the size and vascularity in pituitary adenomas4. Our finding on the correlation between the f and tumor volume appears to be consistent with these previous pathological reports.CONCLUSION
TSE-DWI-based IVIM imaging is a viable non-invasive imaging technique for assessment of vascularity in skull base lesions including pituitary adenoma.Acknowledgements
No acknowledgement found.References
1. Le Bihan D, Breton E, Lallemand D, et al. MR imaging of intravoxel incoherent motions: application to diffusion and perfusion in neurologic disorders. Radiology 1986;161(2):401-407.
2. Kamimura K, Nakajo M, Fukukura Y, et al. Intravoxel Incoherent Motion in Normal Pituitary Gland: Initial Study with Turbo Spin-Echo Diffusion-Weighted Imaging. AJNR Am J Neuroradiol. 2016 Aug 11. [Epub ahead of print]
3. Turner HE, Nagy Z, Gatter KC, et al. Angiogenesis in pituitary adenomas and the normal pituitary gland. J Clin Endocrinol Metab. 2000 Mar;85(3):1159-1162.
4. Vidal S, Kovacs K, Horvath E, et al. Microvessel density in pituitary adenomas and carcinomas. Virchows Arch. 2001 Jun;438(6):595-602.
Figures