4180
Perfusion imaging of brain gliomas using arterial spin labeling: Correlation with histopathological vascular density in MRI-guided biopsies1Radiology, Huashan Hospital, Shanghai, People's Republic of China, 2Glioma Surgery Division, Huashan Hospital, Shanghai, People's Republic of China, 3Neurosurgery, Huashan Hospital, Shanghai, People's Republic of China, 4MR Research China, GE Healthcare, Shanghai, People's Republic of China
Synopsis
This study was designed to determine if CBF derived from ASL perfusion imaging could be used to quantitatively evaluate the MVD of brain gliomas on a “point-to-point” basis. The study enrolled 47 patients with treatment-naive brain gliomas who underwent preoperative ASL before stereotactic surgery. We histologically quantified MVD from CD34-stained sections of stereotactic biopsies and co-registered biopsy locations with localized CBF measurements. CBF showed a statistically significant positive correlation with MVD. ASL can be a quantitative and noninvasive perfusion MR method for evaluating the MVD of brain gliomas, and may reflect the microvascularity of gliomas.
Purpose
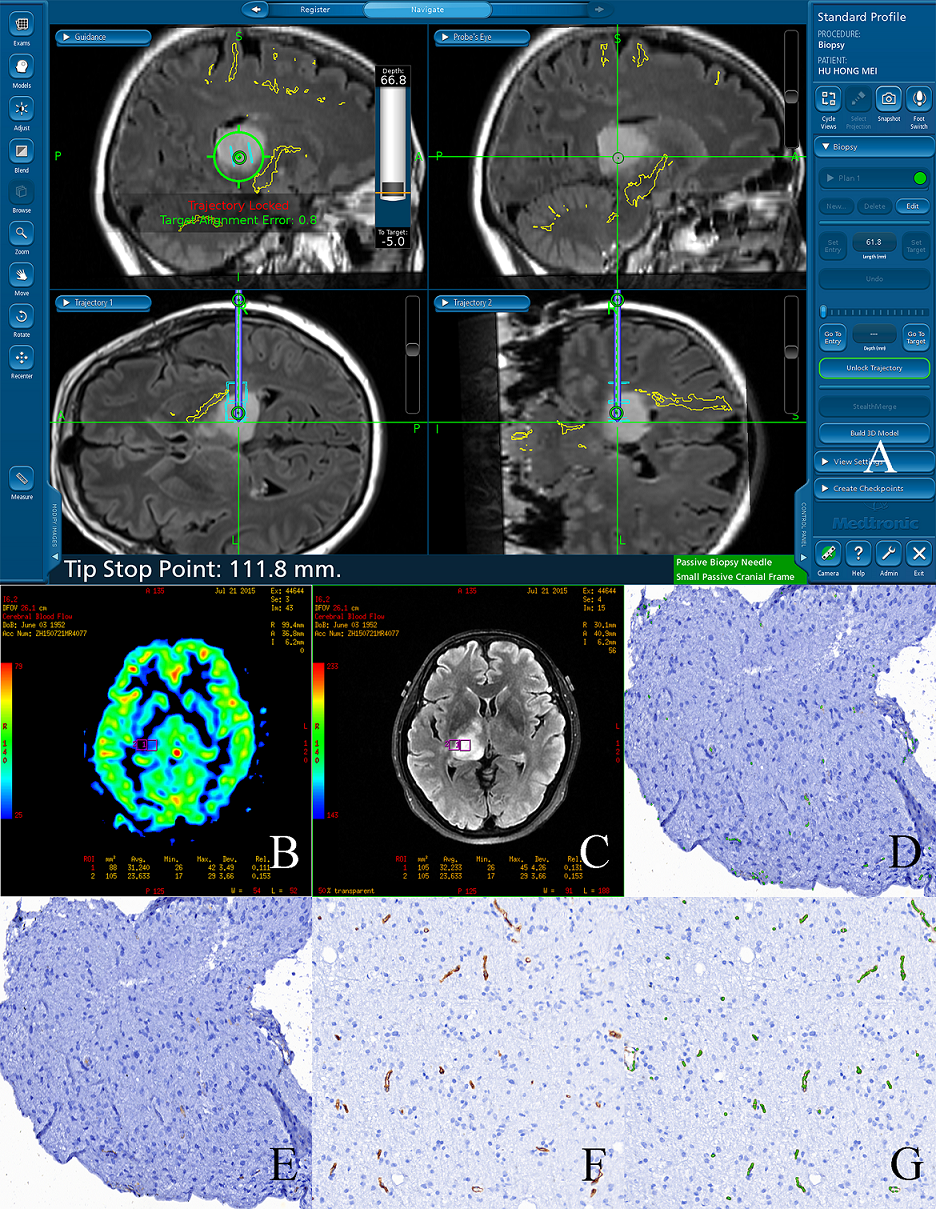
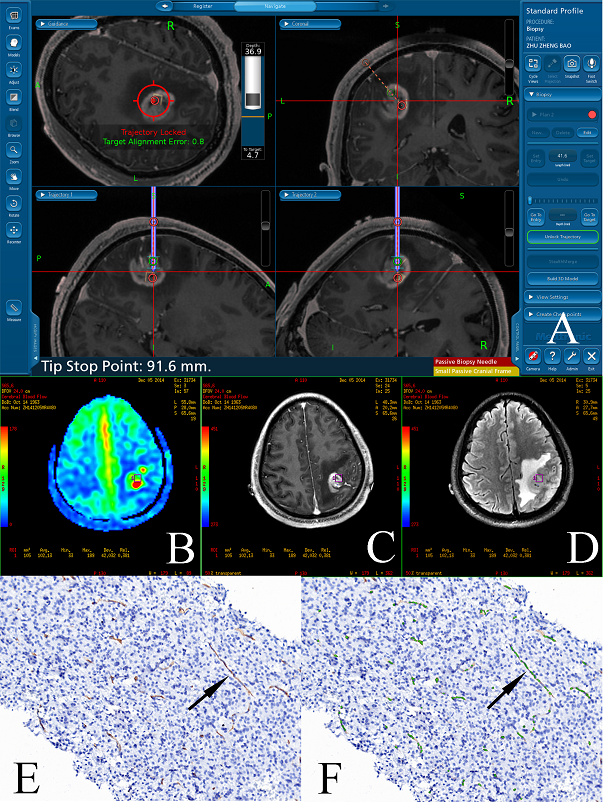
ASL can reflect the brain tumor angiogenesis proved by the correlation between CBF and MVD.1-4 However, the mismatch between radiology and histopathology leaves the conclusion open to question. This study was designed to determine if CBF derived from ASL perfusion imaging could be used to quantitatively evaluate the MVD of brain gliomas on a “point-to-point” basis (Fig1).Methods
The study enrolled 47 patients with treatment-naive brain gliomas who underwent preoperative ASL before stereotactic surgery. We histologically quantified MVD from CD34-stained sections of stereotactic biopsies and co-registered biopsy locations with localized CBF measurements (Fig 2). The correlation between CBF and MVD was determined using Spearman correlation coefficient. P ≤ .05 was considered statistically significant.Results
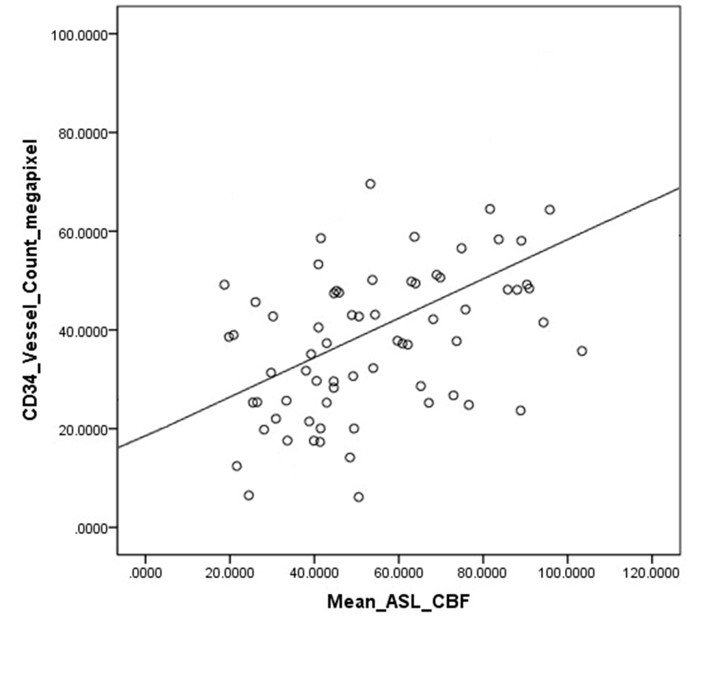
Of the 47 patients enrolled in the study, 6 were excluded from the analysis because of brain shift or poor co-registration and localization of the biopsy site during surgery. Finally, 84 biopsies form 41 subjects were included in the analysis. CBF showed a statistically significant positive correlation with MVD (ρ=0.567, P = .029, Fig3).Discussion and Conclusion
ASL can be a quantitative and noninvasive perfusion MR method for evaluating the MVD of brain gliomas, and may reflect the microvascularity of gliomas.Acknowledgements
No acknowledgement found.References
1. Provenzale JM, Mukundan S, Barboriak DP. Diffusion weighted and perfusion MR imaging for brain tumor characterization and assessment of treatment response. Radiology 2006;239:632–49
2. Detre JA, Rao H, Wang DJ, et al. Applications of arterial spin labeled MRI in the brain. J Magn Reson Imaging 2012;35:1026–37
3. Kuo PH, Kanal E, Abu-Alfa AK, et al. Gadolinium-based MR contrast agents and nephrogenic systemic fibrosis. Radiology 2007;242:647–49
4. Warmuth C, Gunther M , Zimmer C. Quantification of blood flow in brain tumors: comparison of arterial spin labeling and dynamic susceptibility-weighted contrast-enhanced MR imaging. Radiology 2003;228:523–32
Figures