4178
Predicting WHO grade of brain glioma using inflow-based vascular-space-occupancy MR imaging at 3 Tesla1Department of Medical Imaging, Nanfang Hospital, Southern Medical University, Guangzhou, People's Republic of China, 2School of Biomedical Engineering, Southern Medical University, Guangzhou, People's Republic of China, 3Neurosection, Division of MRI Research, Department of Radiology, Johns Hopkins University School of Medicine, Baltimore, Maryland, USA, 4F.M. Kirby Research Center for Functional Brain Imaging, Kennedy Krieger Institute, Baltimore, Maryland, United States, 5Department of Neurosurgery, Nanfang Hospital, Southern Medical University, Guangzhou, People's Republic of China, 6Department of Pathology, Nanfang Hospital, Southern Medical University, Guangzhou, People's Republic of China
Synopsis
The purpose of this study is to investigate the feasibility of grading primary brain gliomas with inflow-based vascular-space-occupancy (iVASO) MRI. The iVASO MRI perfusion approach enables the quantitative analysis of physiological information of tumor without using exogenous contrast agent. The measured arteriolar cerebral blood volume (CBVa) showed a significant association with tumor grades as well as the capability to predict tumors grades. When exogenous contrast agent administration is difficult or contraindicated in certain patient populations, iVASO MRI may used as an option for the clinical management of brain tumors.
Purpose
MR perfusion imaging enables the quantitative analysis of neovascularization that is an important factor in evaluating biological behavior of neoplasms1, 2. As the most commonly used MR perfusion imaging methods, dynamic susceptibility contrast (DSC) MRI and dynamic contrast enhancement (DCE) MRI can provide information on microcirculation in brain diseases, such as relative cerebral blood volume (rCBV), relative cerebral blood flow (rCBF) and volume transfer coefficient ( Ktrans), and predict pathologic grade of gliomas with high accuracy3-6. Nevertheless, these techniques require a bolus injection of an exogenous contrast agent. This is sometimes problematic, for instance, when adequate intravenous access cannot be obtained, and thus the performance of repeated measures is limited. Inflow-based vascular-space-occupancy (iVASO) MRI, a novel noninvasive perfusion MRI method, can acquire arteriolar cerebral blood volume (CBVa) without using an exogenous contrast agent. Moreover, CBVa is thought to be more sensitive than total CBV in reflecting microvasculature changes7-9. We have previously shown a stronger correlation between iVASO CBVa and WHO grade compared to DSC CBV in a small sample of patients with gliomas10. The aim of this study was to validate our previous observation in a larger cohort, and to investigate the potential value of iVASO CBVa in grading brain gliomas.Materials and Methods
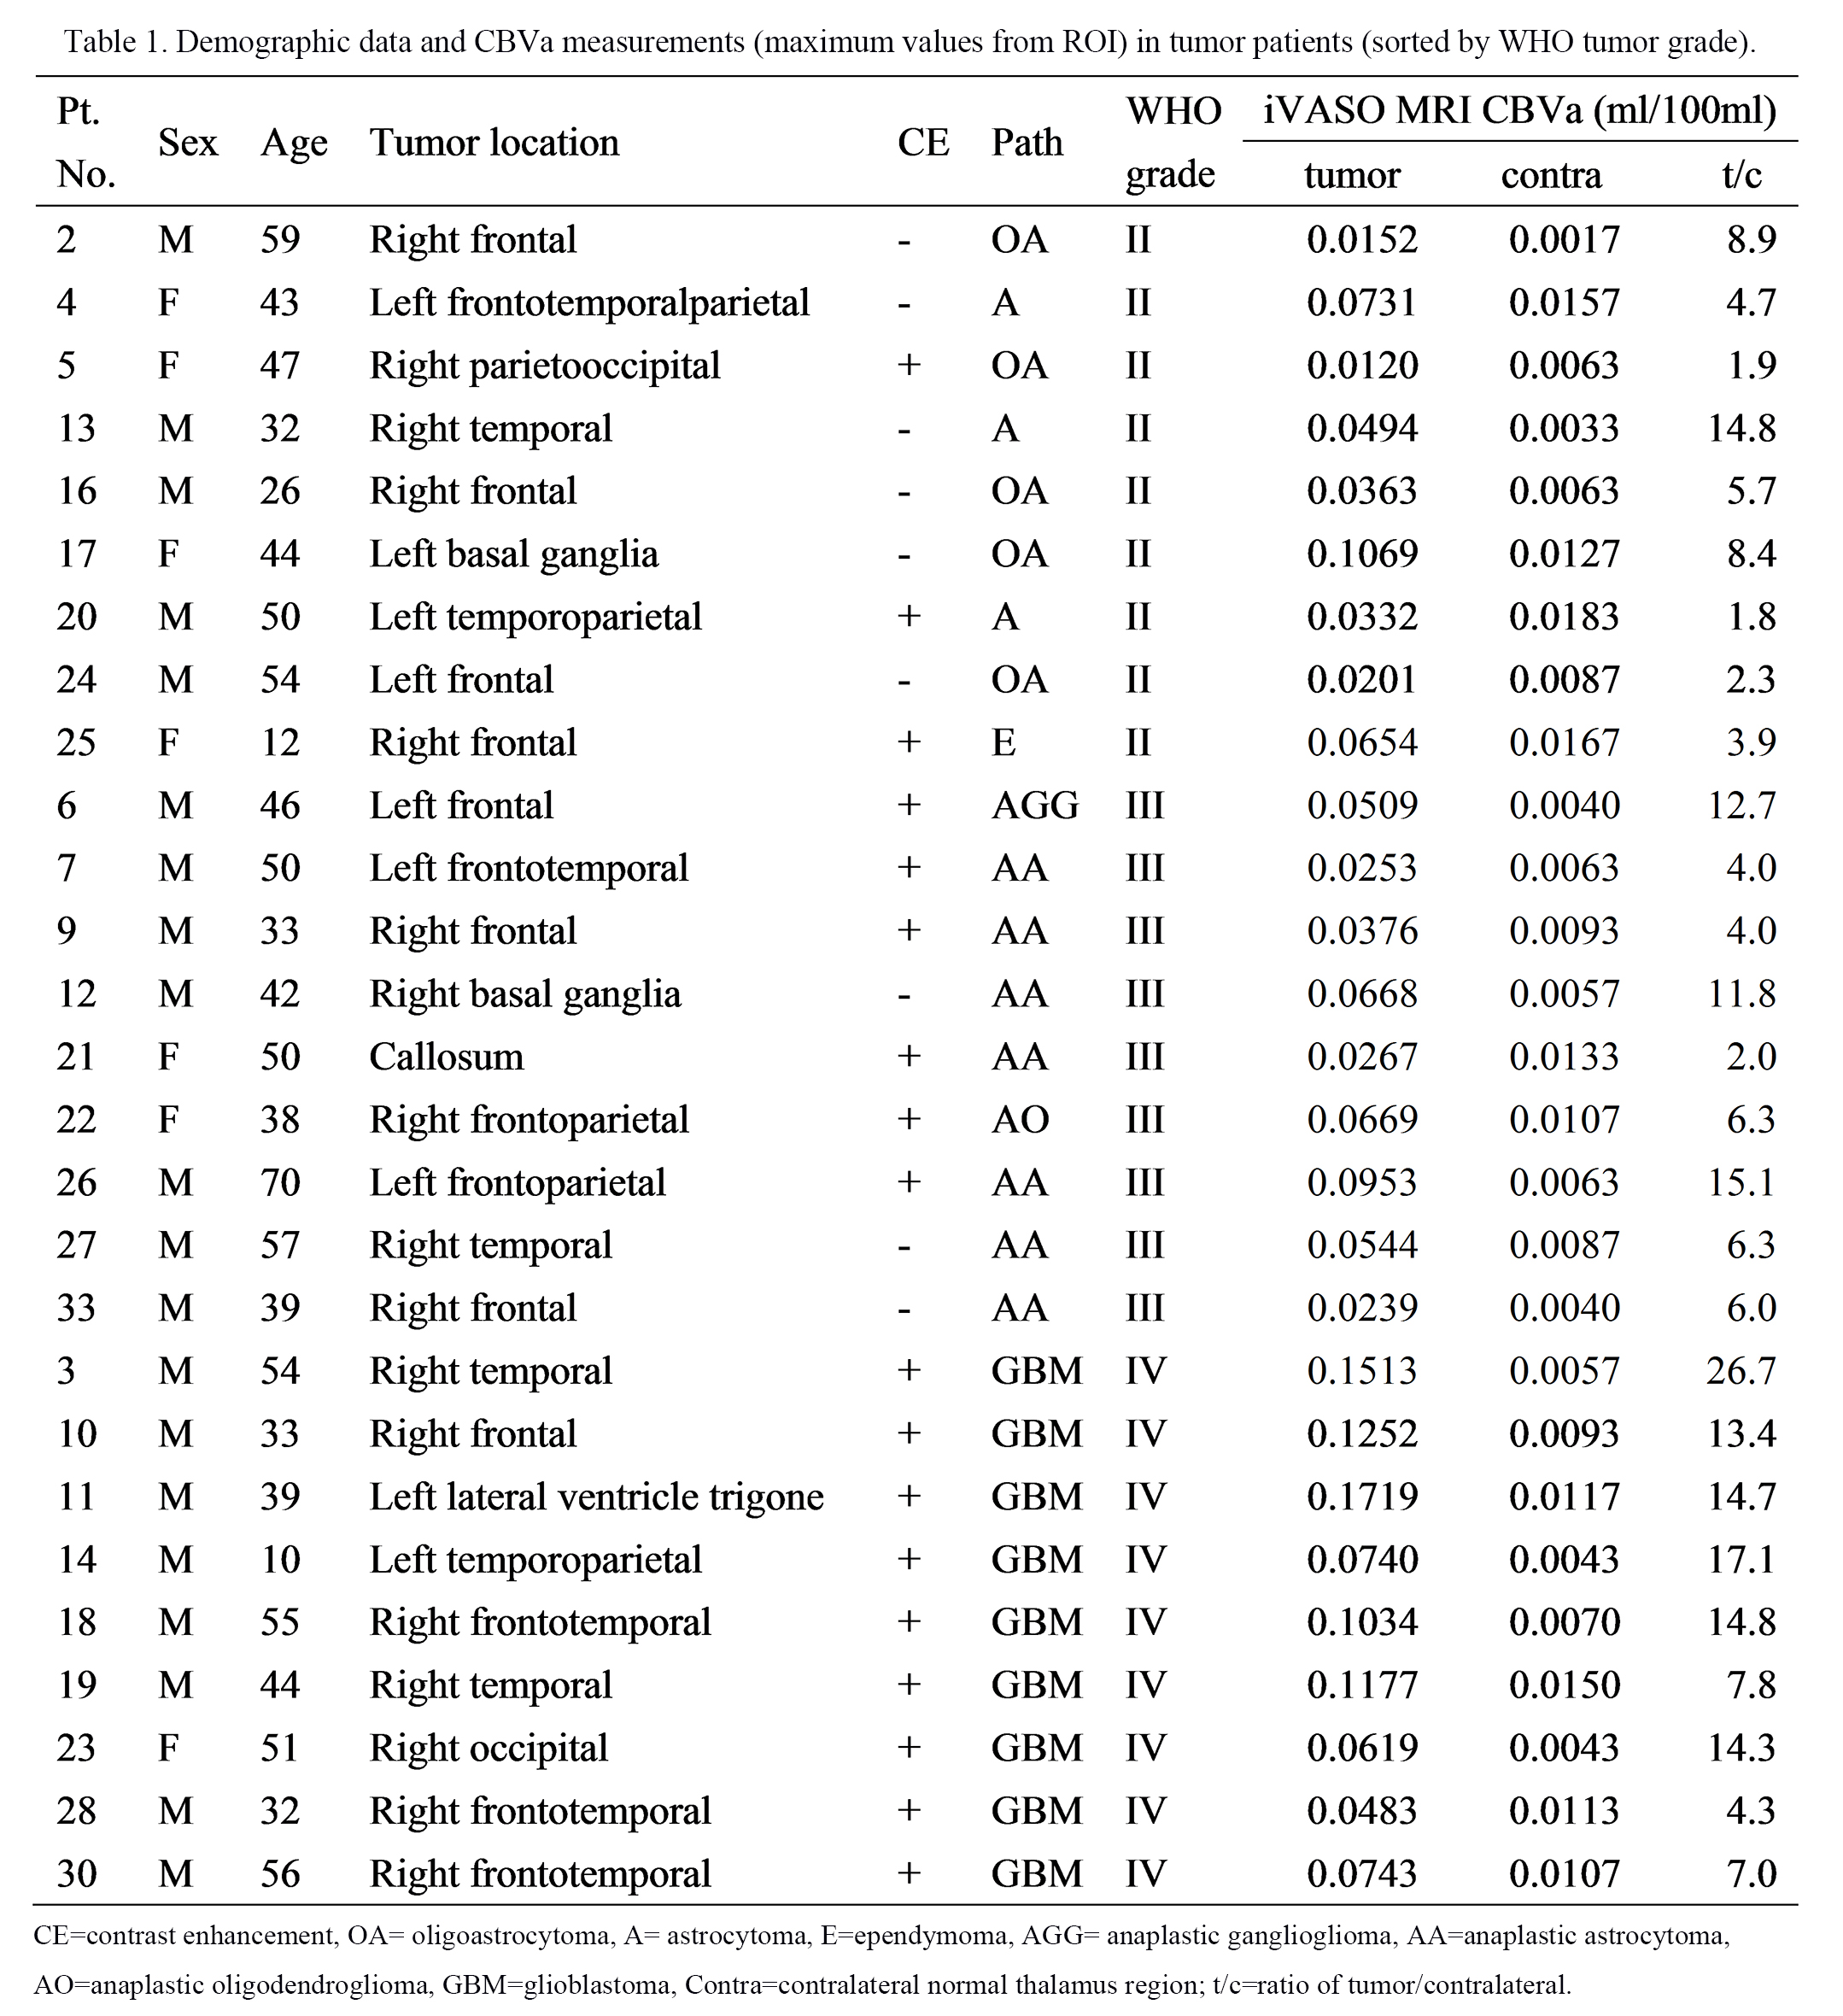
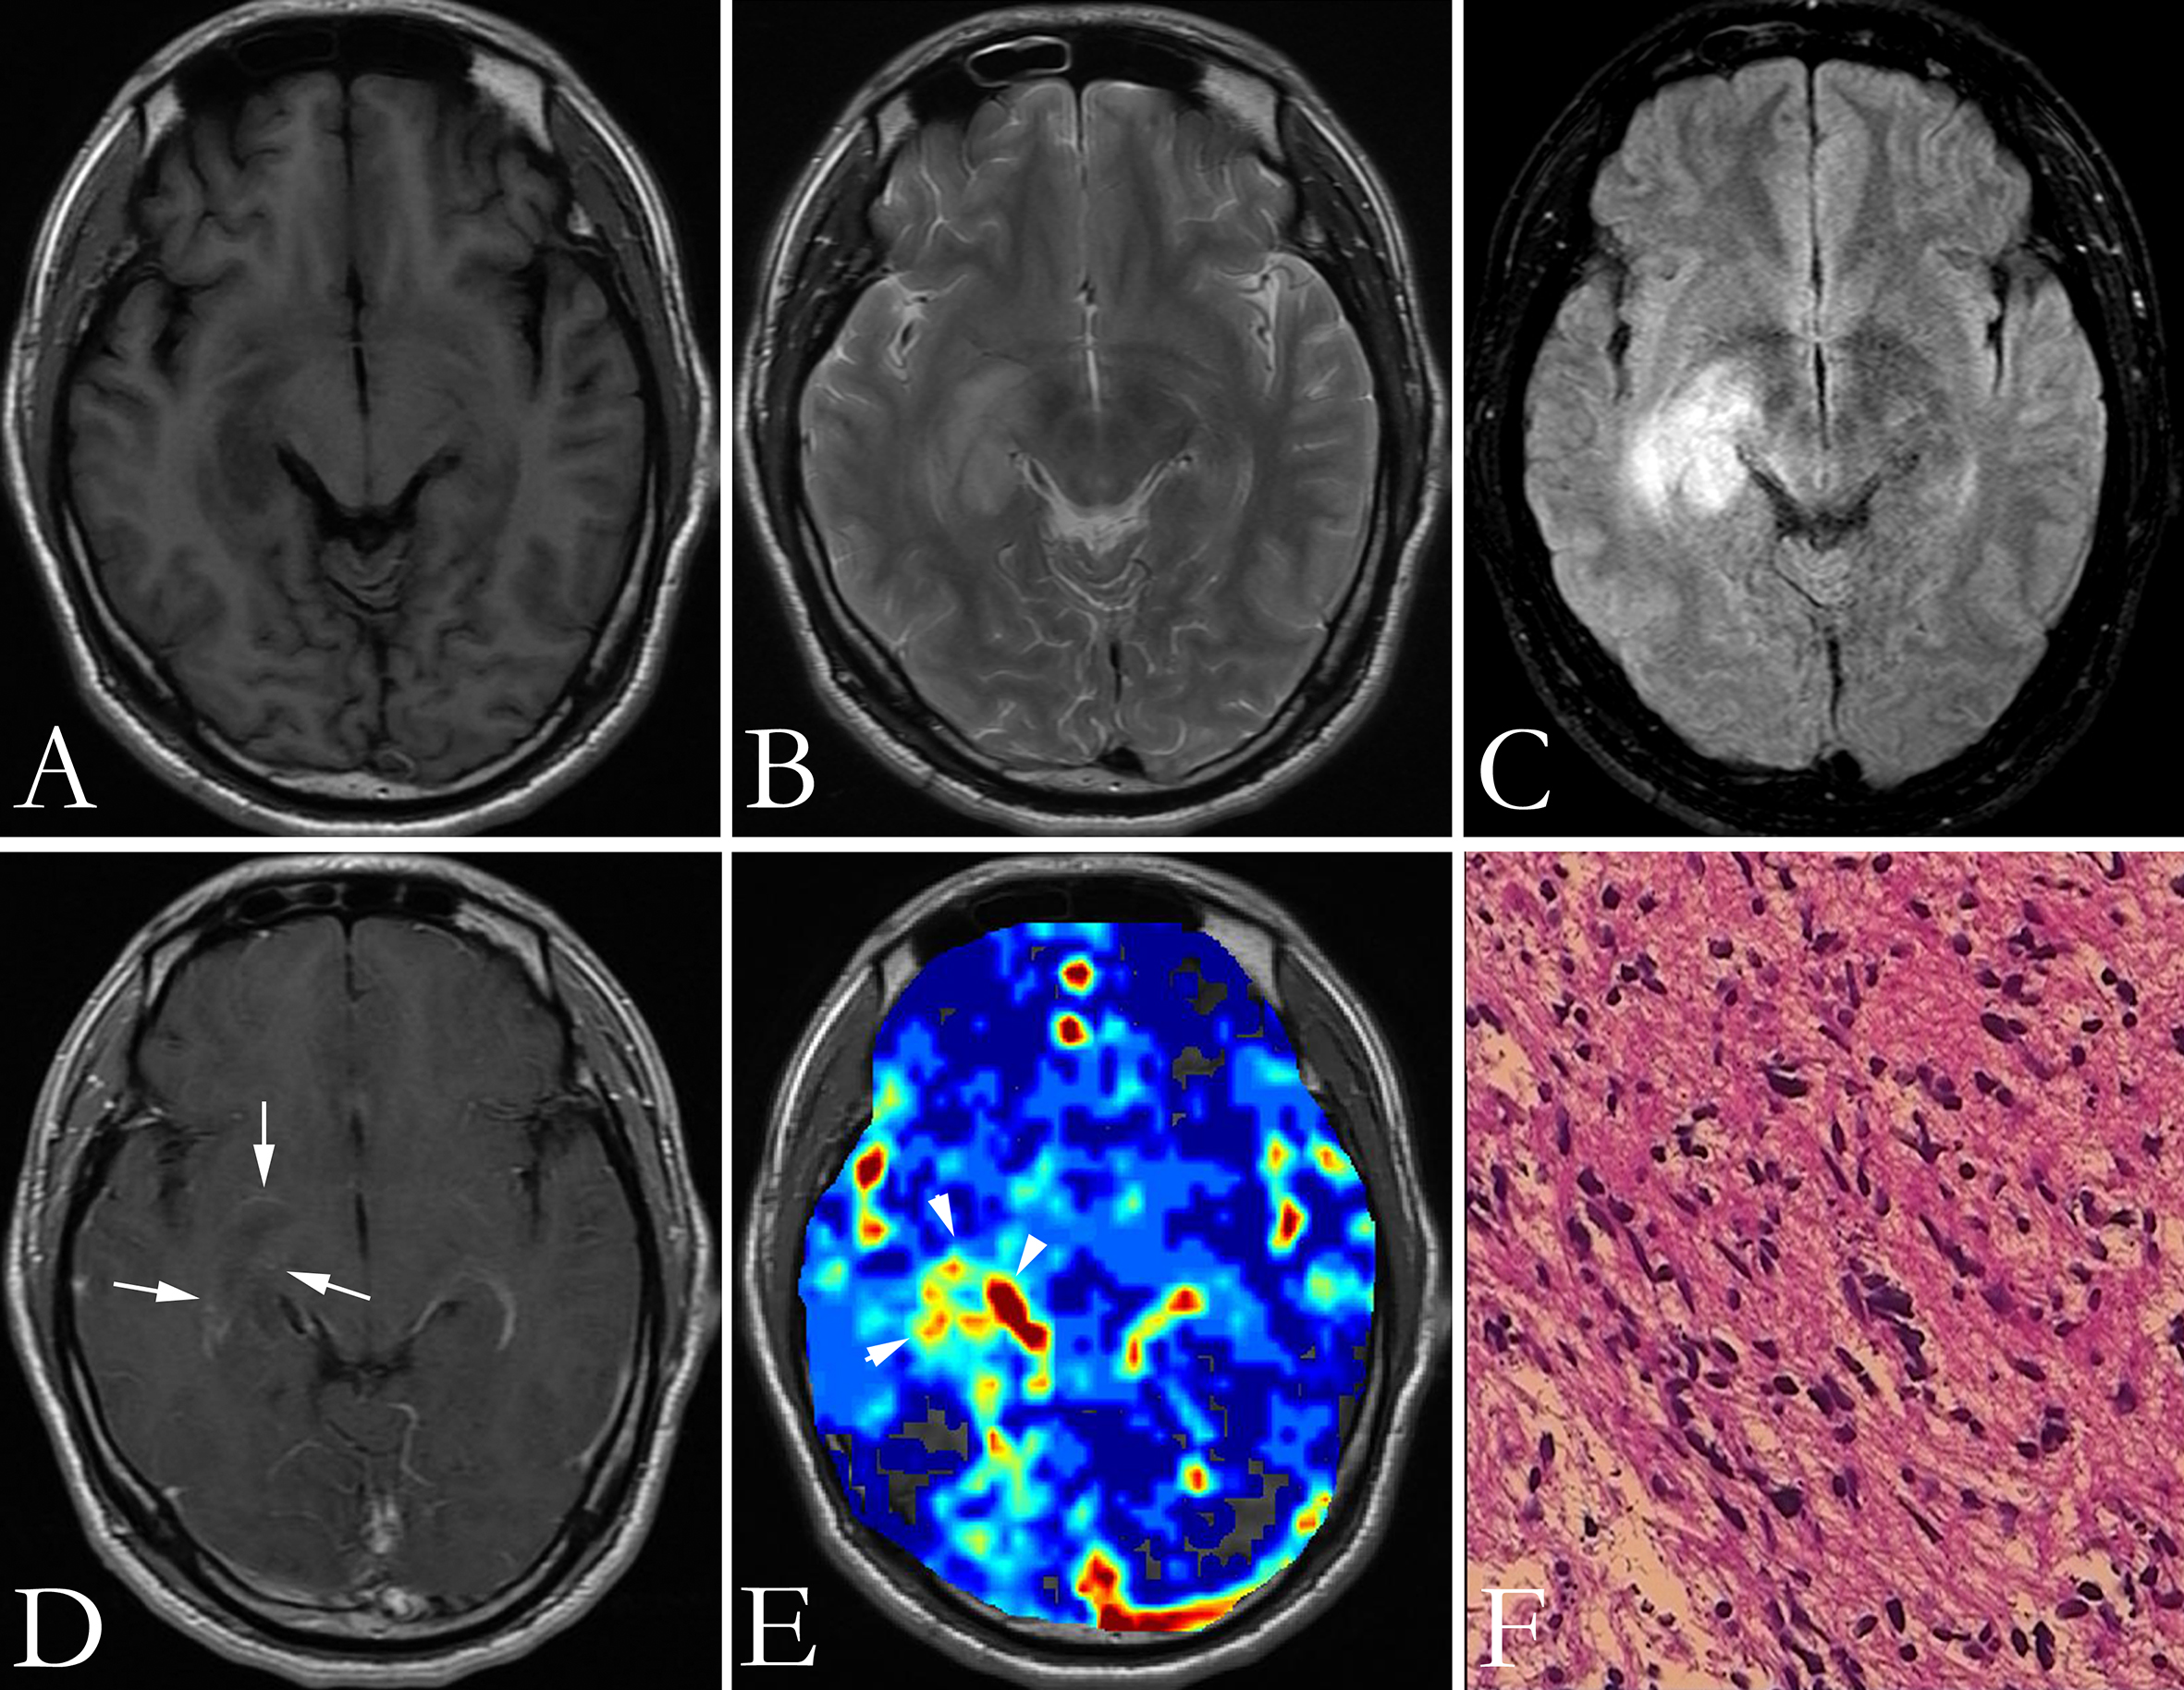
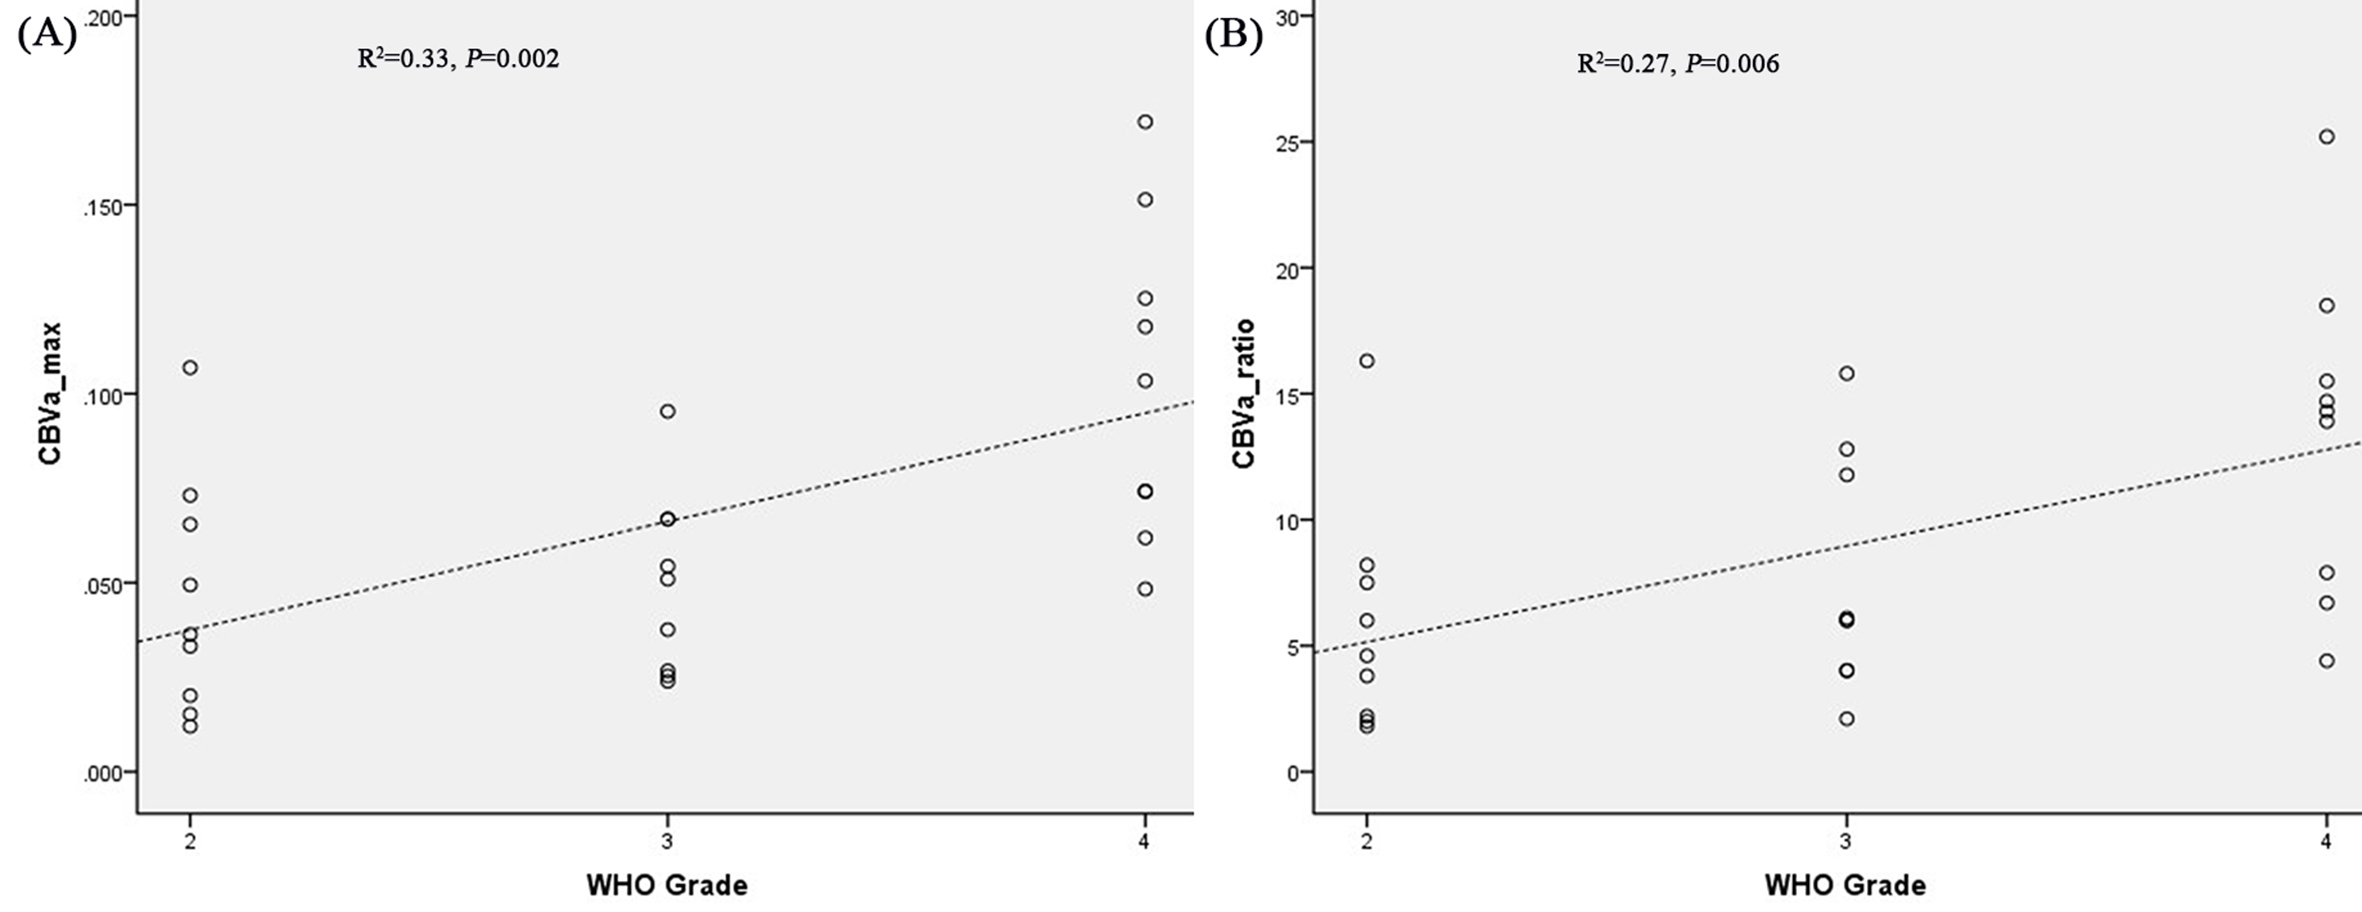
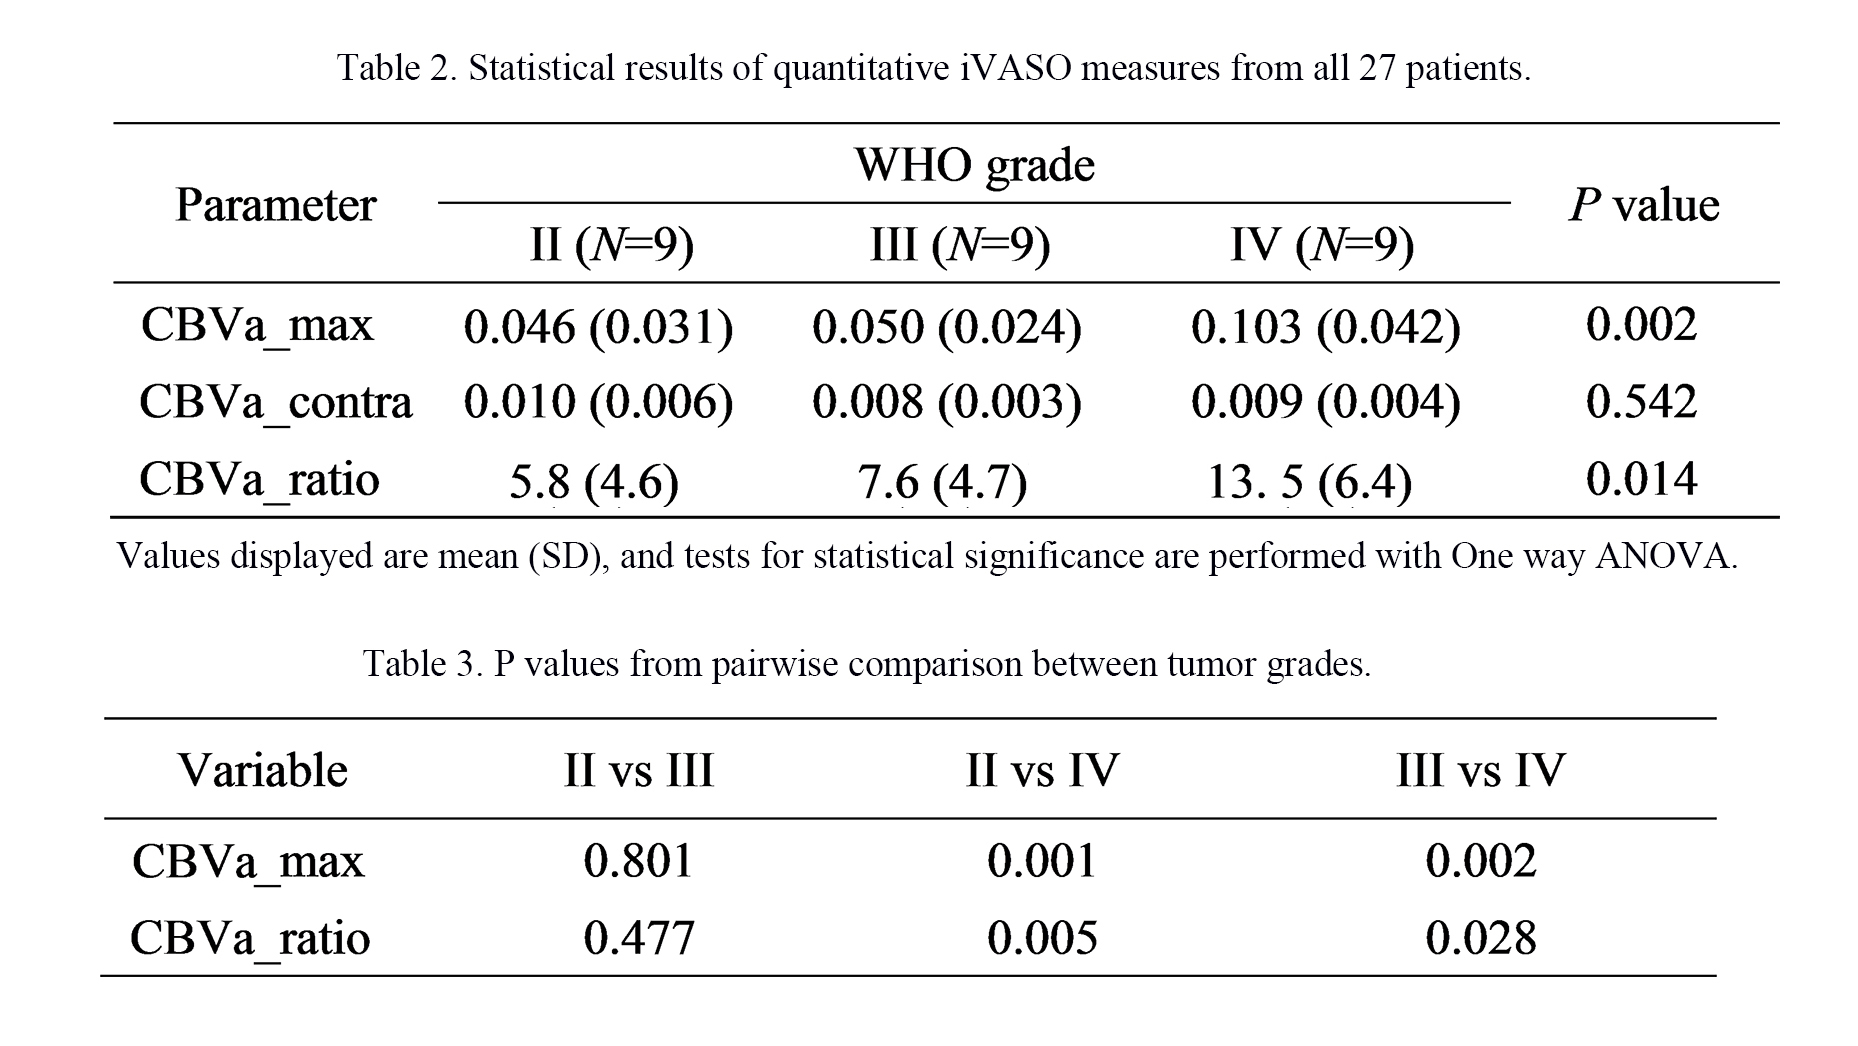
Twenty-seven brain tumor patients (9 World Health Organization [WHO] grade II, 9 grade III, and 9 grade IV as determined by histopathologic assessment) were scanned preoperatively on a 3T Philips scanner with an 8-channel head coil (Table 1). Each subject underwent both conventional MRI and 3D iVASO MRI in the same session: T1-weighted, T2-weighted, fluid attenuated inversion recovery (FLAIR), and contrast enhancement (Gd-DTPA) T1-weighted imaging; 3D iVASO MRI was performed with a gradient spin echo (GRASE) readout (voxel=3x3x6mm3; 7min) 11. Analysis: iVASO data were pre-processed using SPM and resultant CBVa maps were analyzed using ImageJ and in-house Matlab routines7,12 . ROIs of tumoral and similar-sized contralateral thalamus regions (as an internal control) were selected on anatomical images. Efforts were made to avoid necrosis and major macrovessels. The maximum arterial blood volume of tumor (CBVa_max) and thalamus (CBVa_contra) were obtained, and the ratio of tumor/contralateral (CBVa_ratio) was calculated to reduce influence from individual baseline differences. One-way analysis of variance and Fisher’s Least Significant Difference (LSD) test were performed to evaluate the differences of CBVa_max or CBVa_ratio among groups. The association between CBVa measures and WHO grades was examined using Spearman’s rank correlation.Results
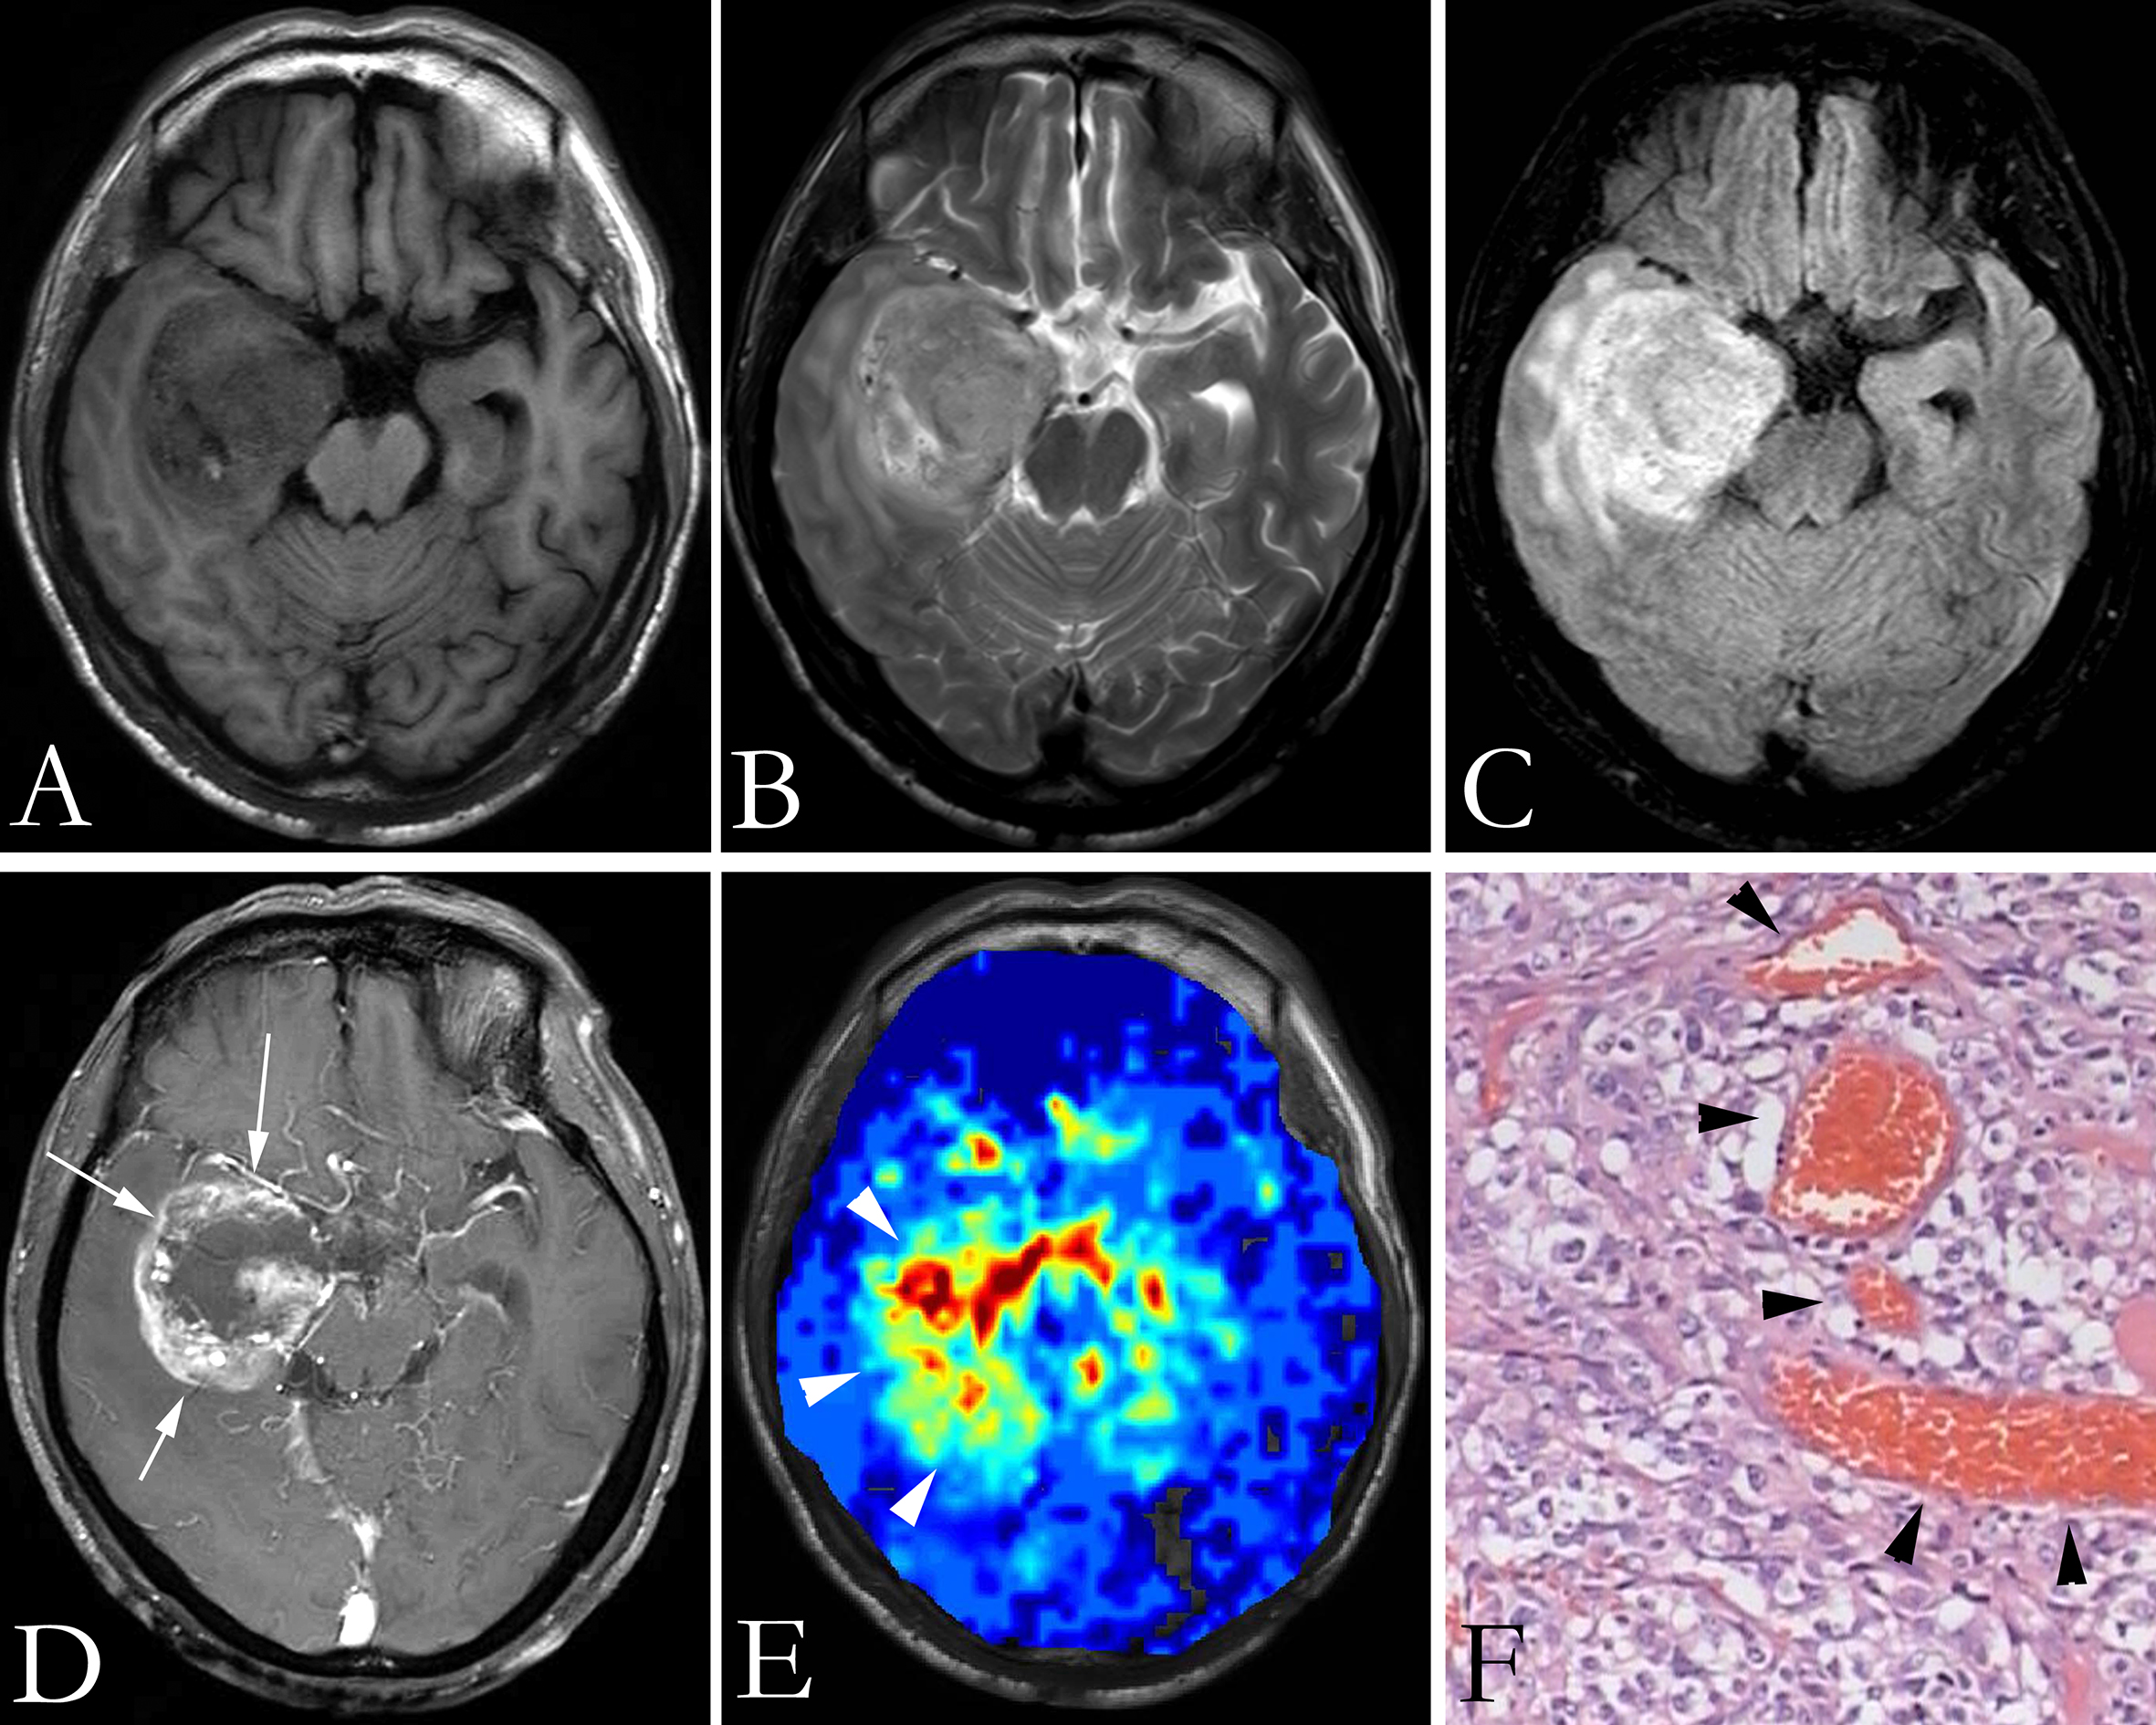
Figure 1 and figure 2 show the T1-weighted, T2-weighted, FLAIR, and contrast-enhanced T1-weighted images, as well as pseudocolored iVASO maps of two representative cases of high grade gliomas (grade III and IV). All iVASO measures are listed in Table 1. Fourteen of 18 high grade gliomas showed CBVa_ratio > 6.0, and 6 of 9 grade IV showed CBVa_ratio>9.0. Six of nine grade II showed CBVa_ratio<6.0, and 8 of 9 showed CBVa_ratio < 9.0. Both CBVa_max and CBVa_ratio significantly correlated with WHO grade (Figure 3) and differed significantly across grades (Table 2). The iVASO measures from different tumor grades are compared pairwise, and the statistical significance is shown in Table 3.Discussion & Conclusion
In this study, iVASO MRI at 3 Tesla produced high-quality, quantitative perfusion data, thereby offering a useful alternative to existing exogenous contrast based MR perfusion techniques. The maximum arteriolar tumor blood volume measures, both absolute CBVa and normalized CBVa, correlated well with tumor grade. In general, iVASO had a good performance in terms of differentiation of glioma grade based on arteriolar blood volume except for significant overlapping of tumor CBVa between grade II and grade III, which indicates the possibility that the arteriolar compartment within gliomas has little change from grade II to grade III. Further investigation is warranted to compare the iVASO approach with DSC,DCE or ASL with regard to which method is a better classifier for the stratification of brain tumors, to investigate the potential value of absolute CBVa measures in monitoring the treatment response of patients with brain tumor, as well as to clarify the pathological basis underlying the CBVa changes.Acknowledgements
The authors thank Mr.Bin Chen, Mr.Peng Cang, and Ms. Youxia Zhao for experimental assistance.
References
1. Brem S et al. J Natl Cancer Inst 1972;48:347.
2. Ronald L, et al. J Magn Reson Imaging 2005; 22:475.
3. Law, M, et al. Am J Neuroradiol 2004;25:746.
4. Cha, S, et al. Am J Neuroradiol 2005;26:266.
5. Cha, S, et al. Radiology 2002; 223:11.
6. M Essig, et al. Am J Neuroradiol 2012;33:803.
7. Hua, J, et al. NMR Biomed 2011;24:1313.
8. Hua, J, et al. Magn Reson Med 2011;66:40.
9. Hansen-Smith, F, et al. Microvasc Res 2001;62:1.
10. Wu Y, et al. J Magn Reson Imaging 2016
11. Hua J, et al. Schizophrenia Bulletin 2016
12. Wu Y, et al. Proc. 24rd Annual Meeting ISMRM 2016
Figures