4175
Cerebral Blood Volume (CBV) Normalization for Dynamic Susceptibility Contrast (DSC) MRI in Glioblastoma Patients1Dana-Farber Cancer Institute, Boston, MA, United States, 2Radiology, Affiliated Cancer Hospital of Zhengzhou University, 3Radiology, Brigham and Women's Hospital
Synopsis
Gaussian normalization generates more consistent nCBV maps than the gold standard, manual NAWM normalization. The ease of implementation and automated aspect of Gaussian normalization makes it an appealing method that could be successfully implemented in the clinical setting.
Introduction
Dynamic susceptibility contrast (DSC) MRI has been shown to be a useful tool in evaluating brain tumor vascularity and angiogenesis[1-3]. The cerebral blood volume (CBV) map is typically normalized to the contralateral normal appearing white matter (NAWM) resulting in normalized CBV (nCBV) measurement. In general, a reference region of interest (ROI) is drawn within NAWM and the mean value of the ROI is used to normalize the CBV for each voxel. Variations in NAWM ROI selection can have a significant impact on nCBV map generation. We hypothesized that an automated method - Gaussian normalized nCBV [4] maps can be used to generate consistent nCBV and predict OS in newly diagnosed glioblastoma multiforme (GBM) patients with the performance at least similar to the manual NAWM normalization.Methods
A total of 51 adult patients with grade IV GBM were retrospectively chosen for the study. Axial DSC was performed utilizing a series of SE-EPI (GE Medical Systems) images acquired 10 seconds prior to, during and after intravenous administration of Gadopentetate dimeglumine (Magnevist, Bayer Healthcare). DSC analysis was performed using GE functool. On the resulting CBV maps, each of three independent readers selected 3 ROIs within the tumor with the highest CBV, and another 3 ROIs in the contralateral NAWM. The radius of these ROIs was 1-2 image pixels (2-4mm). We calculated both the maximum and the mean of the three tumor ROIs. For NAWM however, only the mean of the three ROIs was calculated and used for normalization.
Gaussian normalization was performed using in-house Matlab-based (Mathworks, Natick, Massachusetts) code [4]. The standard deviation of the whole brain CBV map, σCBV, was calculated and used for normalization. Twelve nCBVs in total were generated: nCBVi mean, nCBVGi mean , where i= Reader 1~3, and G stands for Gaussian normalization, which used the tumor mean as the numerator; and nCBVi max, nCBVGi max, which used tumor maximum CBV as the numerator instead.
One-way analysis of variance (ANOVA) was employed to compare nCBVmean and nCBVmax: (a) among the three readers and (b) using the conventional NAWM ROI normalization vs. Gaussian normalization. Intraclass correlation coefficient (ICC) was calculated for tumor, NAWM and nCBV measurements among the three readers [5]. A receiver operating characteristics (ROC) curve was calculated to correlate nCBV with overall survival (OS). A p<0.05 was considered to be statistically significant.
Results
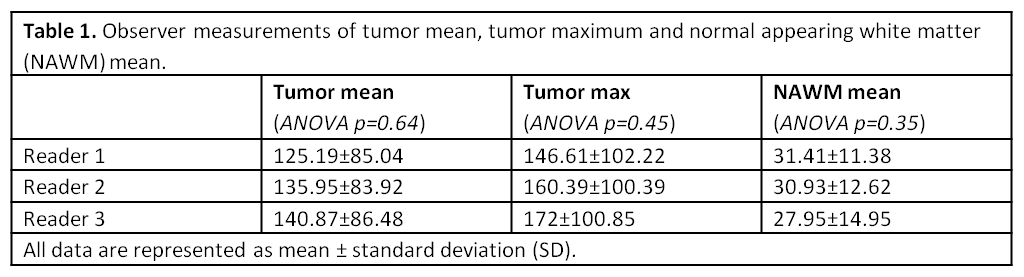
Summary statistics of reader specific tumor mean, tumor maximum, and NAWM mean measurements are listed in Table 1. The Gaussian normalization measured mean and standard deviation (SD) of σCBV across all patients was 33.44±9.45. This SD is smaller than the SD of any individual reader NAWM ROI.
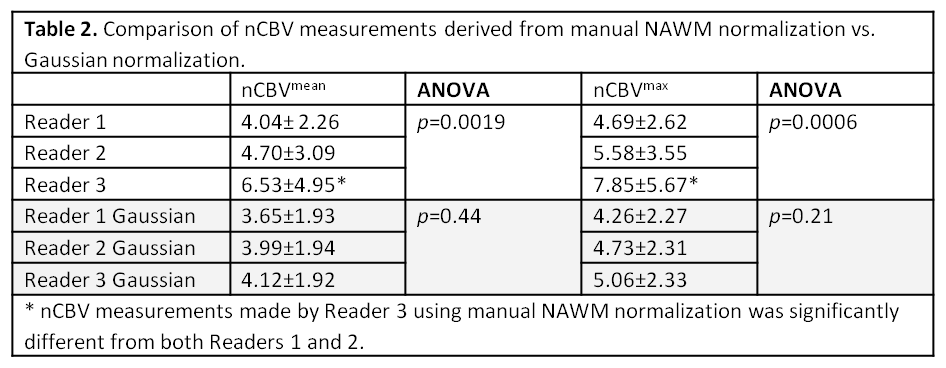
Statistical analysis of nCBV calculated with manual ROI NAWM and Gaussian normalization is summarized in Table 2. Both mean and maximum tumor nCBV calculated by manual NAWM normalization were statistically significantly different among the three readers, but the Gaussian normalized tumor nCBV was not.
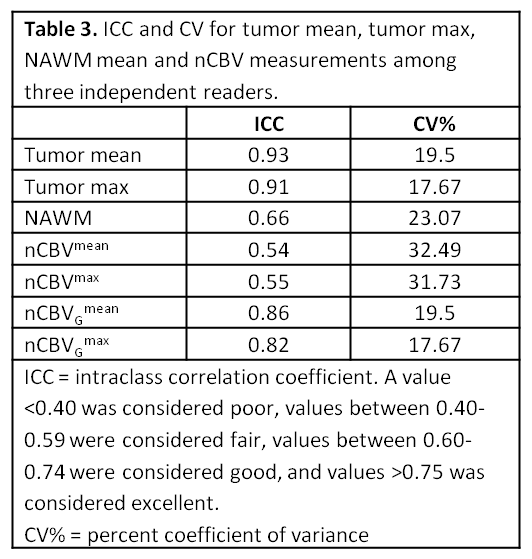
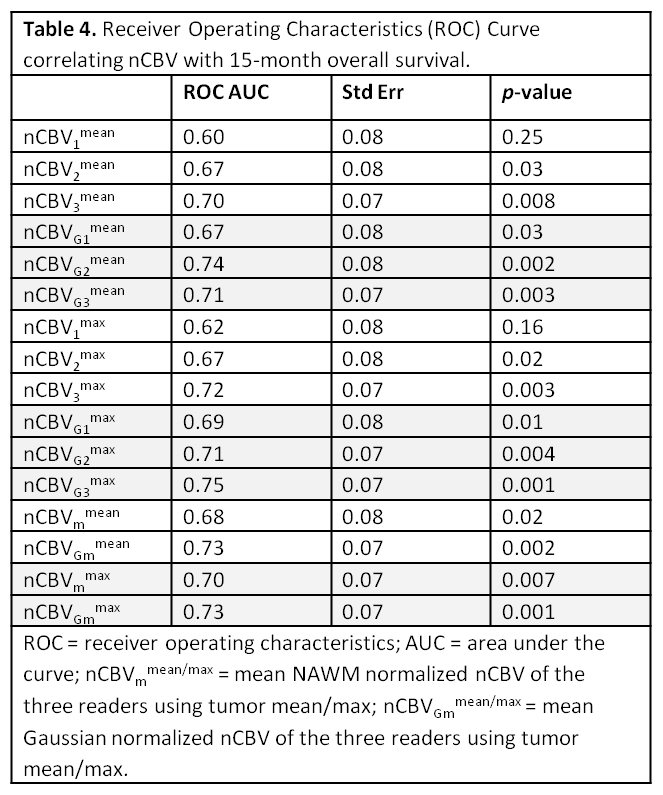
ICC and CV for tumor mean, maximum, NAWM mean and nCBV measurements among the three independent readers are listed in Table 3. Table 4 shows the correlation between nCBV and 15-month OS.
Discussion
Our findings suggest that Gaussian normalization performs similarly to the mean of several expert readers’ NAWM normalization (Table 4). This is encouraging because it shows that an automated method can produce measurements that are similar to those generated by expert readers.
In terms of individual measurements, nCBV in ROIs selected by reader 1 did not significantly predict OS. ROI selected by Reader 2 and 3 did predict OS, but the mean nCBV in those ROI are significantly different (Table 2).
ICC for both tumor mean and maximum CBV were excellent, at 0.93 and 0.91 respectively (Table 3), but NAWM ICC was only 0.66 among the three readers. The difference suggests that it is easier to select reproducible and accurate ROIs in high contrast-to-noise (CNR) tumor regions than NAWM.
Manual ROI NAWM normalization decreased the ICC to 0.54 and 0.55 for tumor mean and maximum nCBV respectively. This is not surprising because normalization combines the measurement variations from both tumor and NAWM into one ratio. Gaussian normalization, on the contrary, increased the ICC to 0.86 and 0.82.
Conclusion
Gaussian normalization generates nCBV estimates similar to current gold standard manual NAWM normalization but with much greater consistency, and greater ease of implementation and automation. Validation of Gaussian normalized nCBV in the clinical setting is indicated.Acknowledgements
No acknowledgement found.References
1. Mangla, R., et al., Correlation between progression free survival and dynamic susceptibility contrast MRI perfusion in WHO grade III glioma subtypes. Journal of Neuro-Oncology, 2013. 116(2): p. 325-331.
2. Schmainda, K.M., et al., Dynamic susceptibility contrast MRI measures of relative cerebral blood volume as a prognostic marker for overall survival in recurrent glioblastoma: results from the ACRIN 6677/RTOG 0625 multicenter trial. Neuro Oncol, 2015.
3. Sorensen, A.G., et al., Increased Survival of Glioblastoma Patients Who Respond to Antiangiogenic Therapy with Elevated Blood Perfusion. Cancer Research, 2012. 72(2): p. 402-407.
4. Ellingson, B.M., et al., Comparison between intensity normalization techniques for dynamic susceptibility contrast (DSC)-MRI estimates of cerebral blood volume (CBV) in human gliomas. Journal of Magnetic Resonance Imaging, 2012. 35(6): p. 1472-1477.
5. Barnhart, H.X. and D.P. Barboriak, Applications of the Repeatability of Quantitative Imaging Biomarkers: A Review of Statistical Analysis of Repeat Data Sets. Translational Oncology, 2009. 2(4): p. 231-235.
Figures