4173
Influence of Preload and Post-Processing Methods on the Consistency of Cerebral Blood Volume Values from Dynamic Susceptibility Contrast MRI1Barrow Neurological Institute, Phoenix, AZ, United States, 2Mayo Clinic, Phoenix, AZ
Synopsis
With DSC-MRI, contrast agent leakage effects in high-grade gliomas must be resolved for accurate CBV measurements. Our aim is to compare CBV values across 1) varying preload doses, 2) two different previously published leakage correction methods, 3) normalized to either the AIF or normal appearing white matter (NAWM), and 4) different CBV integration limits. This was accomplished by acquiring six consecutive DSC-MRI with varying preloads in 14 glioma patients. We found that leakage corrected CBV measurements exhibit high consistency across variable preload doses, particularly when data is integrated under the “First Pass Only” and normalized to the AIF.
Purpose
To evaluate the consistency of DSC-MRI derived CBV values in high-grade glioma patients across 6 varying preload doses and different post-processing steps.Methods
Image Protocol: Fourteen high-grade glioma patients (11:3 M:F; 57.2 ± 12.4 years) were imaged in this IRB-approved study on a 3T MR system (Signa HDx; GE Healthcare, WI) using an 8-channel phased array brain coil. Each patient was scanned with a GRE-EPI DSC sequence six times with 0.05 mmol/kg injection of gadodiamide. This produced a step-wise preload scheme that ranged from 0 (no preload) to 0.25 mmol/kg (2.5x the standard dose) with 0.05 mmol/kg increments. Relevant acquisition parameters include: TR/TE = 2000/20 ms, flip angle = 60 degrees, FOV = 24 x 24 cm, slice thickness = 5 mm, slice spacing = 0 mm, number of slices = 27, and an acquired matrix = 96 x 128. An individual DSC scan time was 2-minutes with 60 time points and 1 minute of wait-time before starting the next DSC scan, resulting in 3 minutes between sequential contrast agent injections.
Post-Processing: ROI based analysis was used to investigate the consistency of CBV measurements, and consisted of an arterial input function (AIF), enhancing brain tumor, and normal appearing white matter (NAWM). The area under the curve (AUC) of the relaxation rate change time courses, ΔR2*(t), were computed for each ROI. Three steps of the CBV process were evaluated. The first step was the application of CA leakage correction methods to the ΔR2*(t) curves. This was done either by Boxerman-Schmainda-Weisskoff (BSW) 1-3 or Bidirectional (BD)4 method. The second step was the upper integration limit of ΔR2*(t) set to either 60 seconds (“First Pass + Recirculation”) or the end of the first pass (“First Pass Only”). The end of the first pass was determined by the slope of mean whole brain and, on average, was 22.5 seconds long across all patients. The last step was the reference used for CBV normalization. We defined nCBV if NAWM was used as the reference (a common DSC practice), and rCBV if the AIF was used as the reference (typically used for absolute perfusion measurements). In summary, each patient had CBV measurements that were dependent on 6 different preload schemes, 2 different leakage correction methods, 2 different CBV integration limits, and 2 different CBV normalization references. Analysis: Intraclass Correlation Coefficient (ICC) and Lin’s Concordance Correlation Coefficient (LCCC) analysis were used to compare the consistency in CBV values across all leakage correction methods and post-processing steps.Results/Discussion
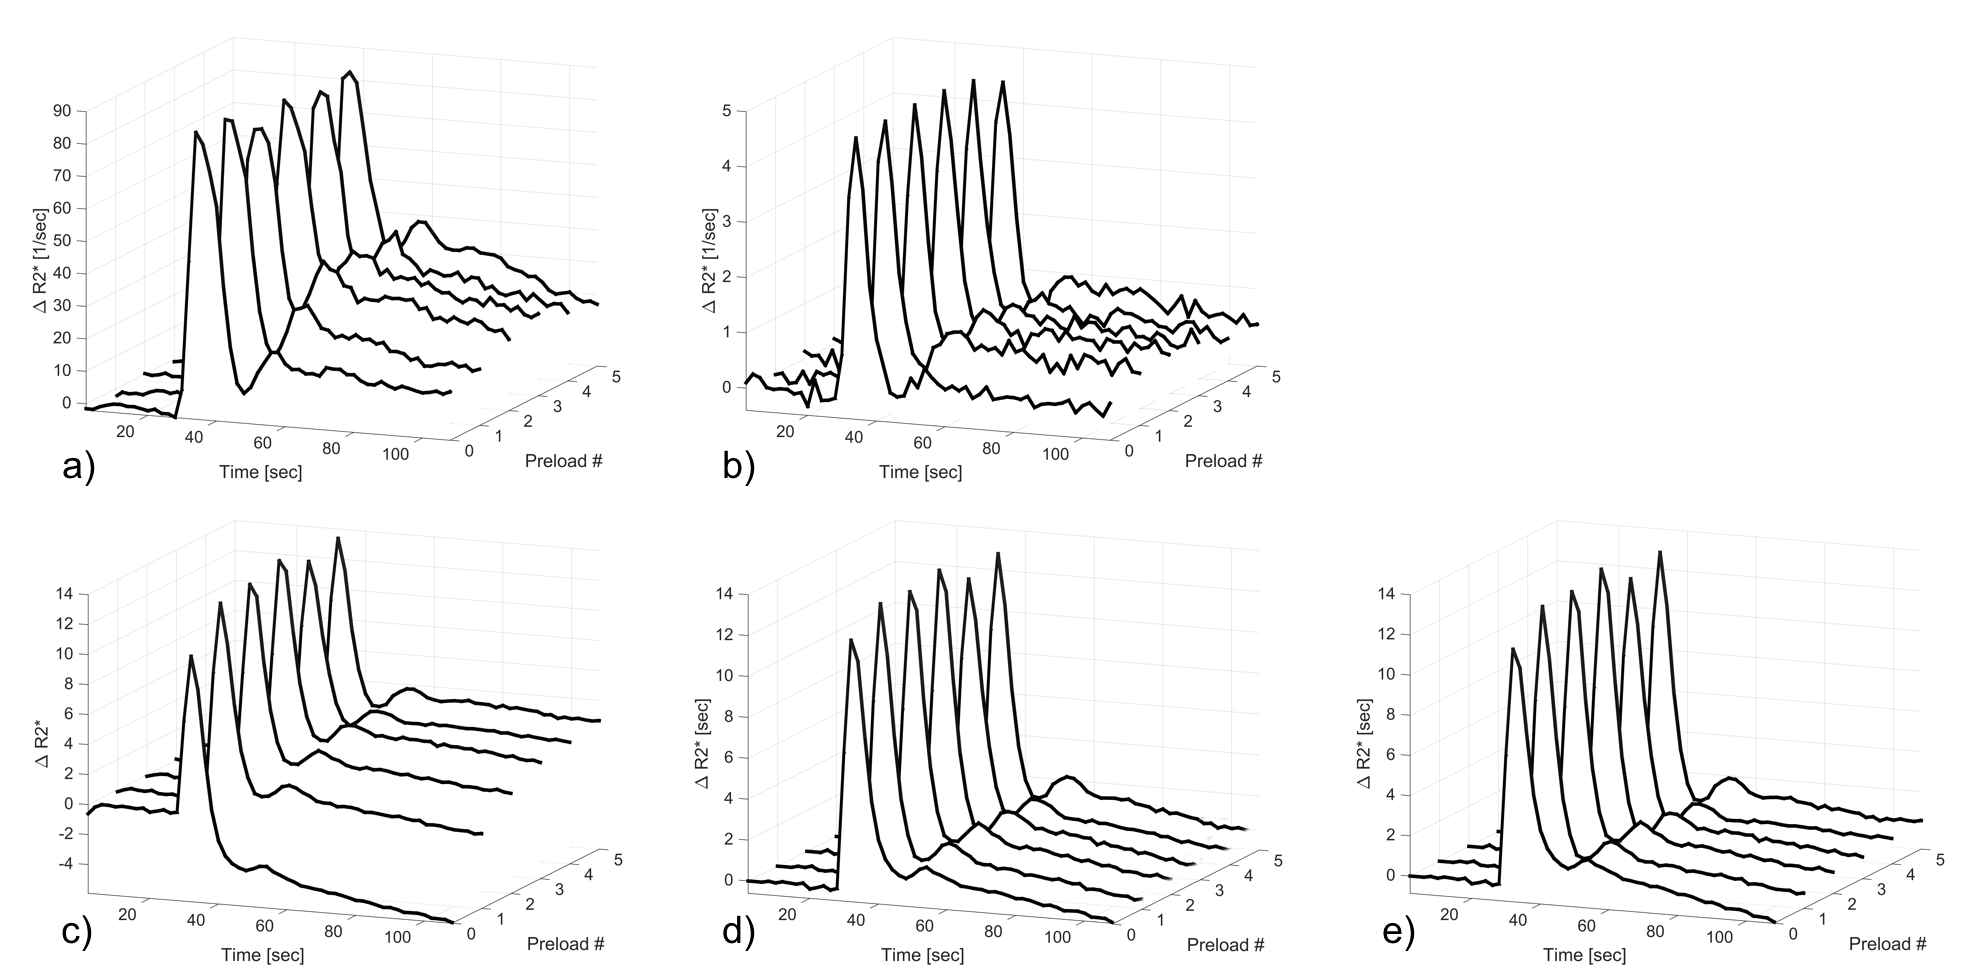
Figure 1 demonstrates an example of the ΔR2*(t) across all preloads in one patient. The first passage of contrast agent (CA) qualitatively looks consistent across preloads in the AIF, NAWM, and leakage corrected tumor ROIs; however, greater variability was observed in the AIF and NAWM ΔR2*(t) curves following the first pass. As expected, the Preload 0 (no preload dose) in the uncorrected tumor resulted in a ΔR2*(t) that clearly exhibited CA induced T1 leakage effects. Interestingly, the variability noted in the AIF and NAWM data following the first pass was not apparent in the leakage corrected tumor ΔR2*(t) curves, which exhibited very high consistency across preloads.
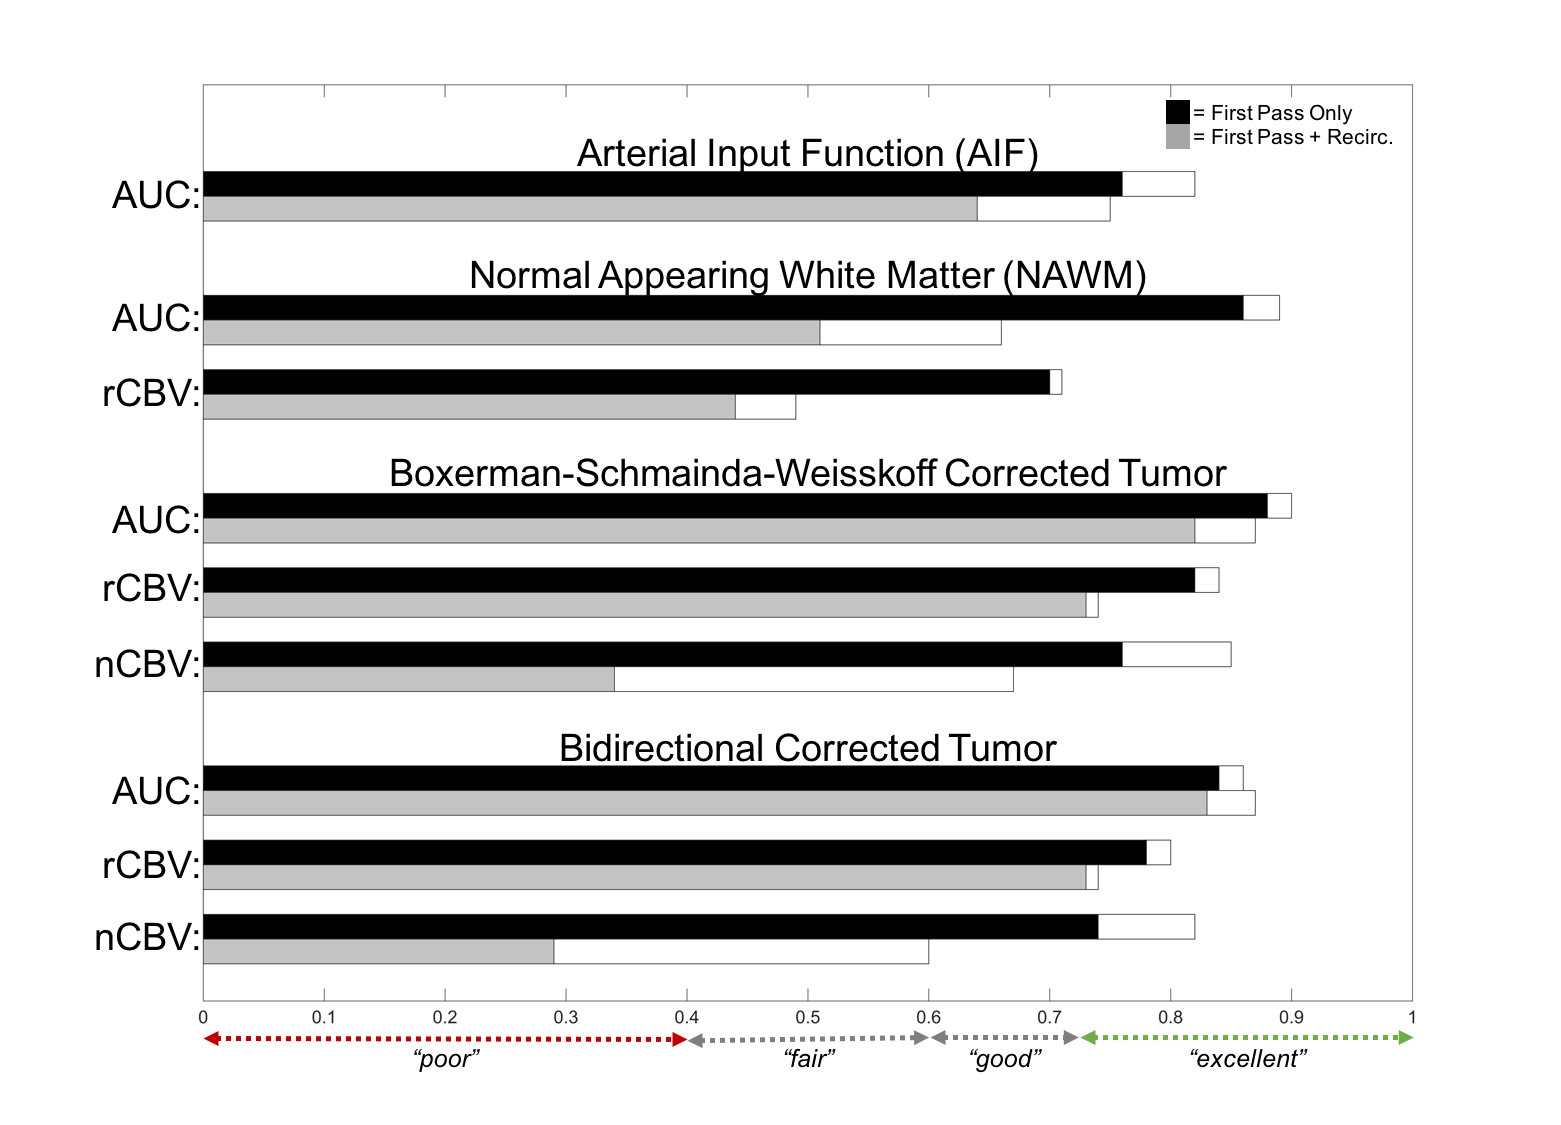
Figure 2 compares the ICC results for each ROI. ICC values were also calculated excluding Preload 0 to demonstrate consistency across preload schemes (Preloads 1-5). For both rCBV and nCBV, ICC increases to “excellent” agreement when the integration limits used are restricted to the “First Pass Only”. This improved ICC is especially true for the nCBV when all preloads are considered, and excluding Preload 0 further increases the consistency in nCBV over the reminding preload schemes. We hypothesize that this improved agreement over the “First Pass Only” is because the expected CA concentration in NAWM is much lower during recirculation and the signal measured may not be an accurate representation of the actual CA concentration due to the known non-linear relaxation rates at low concentrations. This result suggests that normalization to the AIF might be better for CBV comparisons across patients and sites. There was strong statistical agreement between the BSW and BD leakage correction methods. In the case of “First Pass Only” integration limits, the LCCC between BSW and BD was 0.98 for all imaging metrics. In the case of “First Pass + Recirculation” integration limits, the LCCC between BSW and BD was 0.97 for the AUC and rCBV, and 0.98 for nCBV.
Conclusion
Leakage corrected CBV measurements exhibit high consistency across variable preload doses, particularly when DSC-MRI data is integrated under the first pass only and normalized to the AIF.Acknowledgements
This project was funded by NIH/NCI R01 CA158079.References
1. Weisskoff RM, Boxerman JL, Sorensen AG, Kulke STC RB. Simultaneous blood volume and premeatbility mapping using a single Gd-based contrast injection. In: Proceedings of the Second Annual Meeting of Society of Magnetic Resonance. San Francisco, USA.; 1994.
2. Schmainda KM, Rand SD, Joseph AM, et al. Characterization of a first-pass gradient-echo spin-echo method to predict brain tumor grade and angiogenesis. AJNR Am J Neuroradiol. 2004;25(9):1524-1532.
3. Boxerman JL, Schmainda KM, Weisskoff RM. Relative cerebral blood volume maps corrected for contrast agent extravasation significantly correlate with glioma tumor grade, whereas uncorrected maps do not. Am J Neuroradiol. 2006;27(4):859-867.
4. Leu K, Boxerman JL, Lai A, et al. Bidirectional Contrast agent leakage correction of dynamic susceptibility contrast (DSC)-MRI improves cerebral blood volume estimation and survival prediction in recurrent glioblastoma treated with bevacizumab. J Magn Reson Imaging. March 2016.
Figures