4172
Repeatability of ktrans derived from DCE-MRI in newly diagnosed glioblastoma across multiple baseline images and processing methods.Andrew L Beers1, Yi-Fen Yen2, Kyrre Eeg Emblem3, Elizabeth R Gerstner4, Bruce Rosen2, and Jayashree Kalpathy-Cramer2
1Radiology, Massachusetts General Hospital, Boston, MA, United States, 2Radiology, Massachusetts General Hospital, 3Oslo University Hospital, 4Neurology, Massachusetts General Hospital
Synopsis
We evaluate the reproducibility of ktrans values derived from dynamic contrast MRI images in patients with newly diagnosed glioblastoma. Particular focus is put on the reproducibility across choices of T1 values and arterial input functions (AIFs) to the Tofts-Kermode model. Reproducibility is assessed across multiple pre-therapy baseline visits in a 45 patient cohort. Our model based on static population AIFs and static global T1 values had excellent reproducibility compared to other models including unique individual AIFs and T1 maps. There is relatively little concordance between all tested models, but individual AIFs led to higher mean ktrans values.
Purpose
We evaluated the repeatability of ktrans obtained from enhancement regions in dynamic contrast-enhanced MRI (DCE-MRI) images of patients with newly diagnosed glioblastoma. Each patient had two pre-therapy baseline scans in the context of a clinical trial. Ktrans data were obtained from the modified Tofts-Kermode model using different arterial input functions (AIFs) and T1 tissue mappings [1]. Four ktrans values were extracted, based on having either a population-based arterial input function (AIF) or an automatically determined individual-level AIF, and either a global assumed T1 value or an individual variable flip angle T1 map. In addition to assessing repeatability, we also assessed the correlations between all combinations of T1 and AIFs. Ktrans has previously been implicated as a predictive imaging biomarker for patients with glioblastoma and other tumors, and assessing their repeatability in vivo, both across patient visits and processing methods, is essential in determining their statistical power in clinical settings [2]. Repeatability has previously been examined for many sites and tissues [3], but few studies have assessed repeatability with a large patient cohort on a 3T scanner. Furthermore, concerns over gadolinium dosage make such an imaging set unlikely to be recreated [4].Methods
Forty-five patients with newly-diagnosed glioblastoma (age: 22-74 years, mean: 56 years) across two IRB approved studies were included in this evaluation. Two baseline scans were acquired before treatment onset, two to four days apart without any interventions or changes in therapy. DCE-MRI images were retrieved with a repetition time of 6.8ms, echo-time of 2.73ms, and a flip angle of 10 degrees all on a 3T Siemens scanner. A neuro-oncologist drew regions of interest outlining the contrast-enhancing tumor on post-contrast T1-weighted images, which were then registered to the space of the DCE-MRI images. Ktrans maps were generated by an in-house Matlab script that performs perfectly on the QIBA v6 DCE-MRI phantom using the modified Tofts-Kermode model [5]. Population-based AIFs were derived from the Parker model [6], individual AIFs were averaged between automatically selected voxels within a manual ROI via nordicICE [7], T1 maps were derived from acquired variable flip angle maps via Freesurfer’s T1 Mapping tool (angles = 2,5,10,15,30) [8], and global static T1 was set to 1500ms. T1 maps, automatic AIFs, and parametric maps were visually inspected for accuracy, and unusable AIFs and images were excluded. This left a double-baseline cohort of n=43 patients for static T1 and population AIF, n=38 for T1 mapping, n=34 for automatic AIFs, and n=26 for automatic AIFs with T1 mapping. Repeatability was assessed via the Bland-Altman repeatability coefficient (RC), a measure of expected error between repeat measurements (CI = .95%), and inter-correlation was assessed via the concordance correlation coefficient (CCC). Scaling differences were assessed by voxel-wide means calculated for voxels with ktrans ranging from 0 to 1.Results
The median RC (repeatability) for median ktrans values within the enhancement ROI was 0.0035 for population AIF and static T1, 0.0117 for population AIF and T1 mapping, 0.0145 for automatic AIF and static T1, and 0.0153 for automatic AIF and T1 mapping. Strongest concordance was found between both T1 methods using an automatic AIF (CCC = 0.74), while lowest concordance was found between the method using a population AIF with T1 mapping and the method using an individual AIF with a static T1 (C = 0.15). Methods using a population AIF had a voxel-wide mean-value of 0.077, while methods using an individual AIF had a voxel-wide mean-value of 0.119.Discussion
Our RC results indicate that there is good repeatability for ktrans using a population AIF with a global static T1 within tumor-enhancing regions of glioblastomas. Automatically-detected AIFs and variable flip angle T1-mapping also have good repeatability according to RC, but a higher failure rate in finding usable AIFs and T1 maps. Their RC is relatively lower than the RC for population AIF and static methods. Different methods often had low concordance (CCC) values, suggesting that methodological choices in calculating ktrans may have a significant impact on its utility as an imaging biomarker. Automatic AIF methods produced higher median ktrans than population AIF methods, suggesting that ktrans values between two studies each using one of these methods may not be directly comparable.Acknowledgements
This study was supported by NIH R01CA129371, K23CA169021, U01CA154601, S10RR023043, and P41RR14075References
1. Tofts P, Kermode A. Measurement of blood–brain barrier defect by magnetic resonance imaging and gadolinium-DTPA in patients with multiple sclerosis and brain tumors. Magn Reson Med. 1991;17:357–67. 2. Jia, Zhongzheng, Daoying Geng, Tianwen Xie, Jiaoyan Zhang, and Ying Liu. "Quantitative Analysis of Neovascular Permeability in Glioma by Dynamic Contrast-enhanced MR Imaging." Journal of Clinical Neuroscience 19.6 (2012): 820-23. Web. 3. Jackson, A., G. C. Jayson, K. L. Li, X. P. Zhu, D. R. Checkley, J. J L Tessier, and J. C. Waterton. "Reproducibility of Quantitative Dynamic Contrast-enhanced MRI in Newly Presenting Glioma." The British Journal of Radiology BJR 76.903 (2003): 153-62. 4. Martin, Diego R., Saravanan K. Krishnamoorthy, Bobby Kalb, Khalil N. Salman, Puneet Sharma, John D. Carew, Phillip A. Martin, Arlene B. Chapman, Gaye L. Ray, Christian P. Larsen, and Thomas C. Pearson. "Decreased Incidence of NSF in Patients on Dialysis after Changing Gadolinium Contrast-enhanced MRI Protocols." Journal of Magnetic Resonance Imaging 31.2 (2010): 440-46. Web. 5. https://sites.duke.edu/dblab/qibacontent/ 6. Parker GJ, Roberts C, Macdonald A, Buonaccorsi GA, Cheung S, Buckley DL, Jackson A, Watson Y, Davies K, Jayson GC. "Experimentally-derived Functional Form for a Population-averaged High-temporal-resolution Arterial Input Function for Dynamic Contrast-enhanced MRI." National Center for Biotechnology Information. U.S. National Library of Medicine, n.d. Web. 09 Nov. 2016. 7. http://www.nordicneurolab.com/#contact 8. http://freesurfer.net/Figures
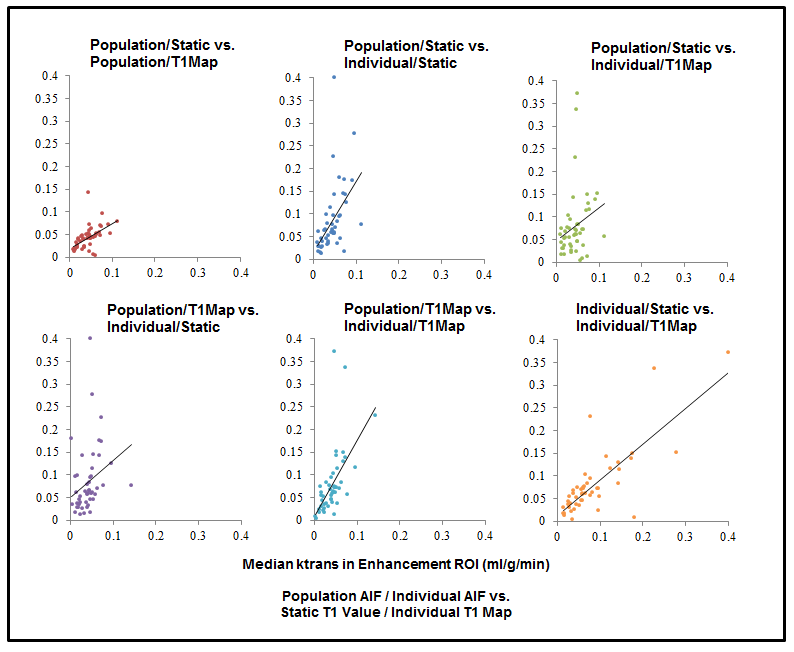
Scatter plots for median
ktrans values within tumor enhancing regions calculated according to four
different methods. Population refers to a population AIF generated by the
Parker model. Individual refers to automatically acquired AIFs from nordicICE.
Static refers to a global static T1 of 1500ms. T1Map refers to T1 maps
generated by variable flip angles via Free Surfer. Concordance coeffecients
(CCC), from top-left clockwise: 0.28, 0.26, 0.12, 0.15, 0.40, 0.74.
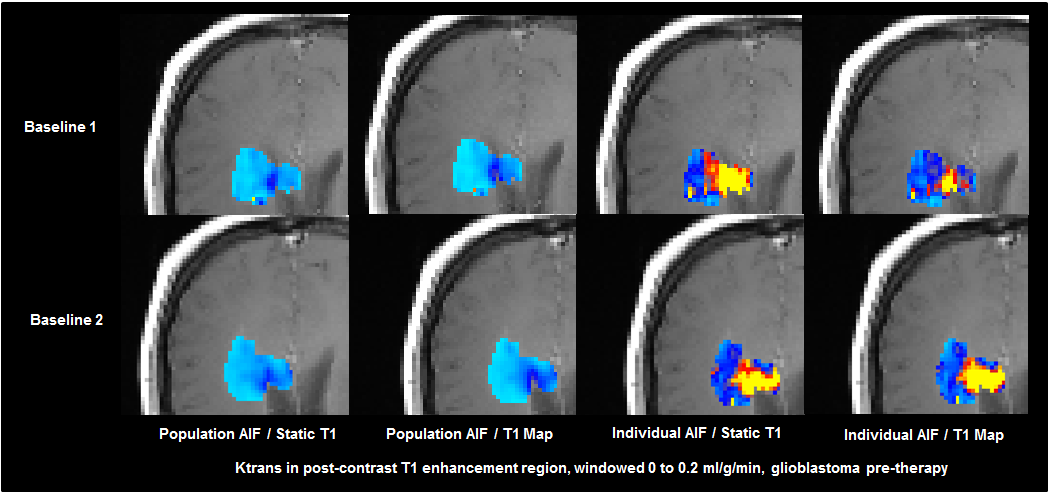
Ktrans parameter map on two axial slices from two separate baseline T1 post-contrast scans. Ktrans values are windowed from 0 to 0.2, with yellow representing > 0.2. Population AIF refers to a population AIF generated by the Parker model. Individual AIF refers to automatically acquired AIFs from nordicICE. Static T1 refers to a global static T1 of 1500ms. T1Map refers to T1 maps generated by variable flip angles via Free Surfer.

Bland-Altman plot for median ktrans values in the tumor enhancing region of two consecutive baseline studies. The x-axis represents the average of the two median values from both baseline scans. The y-axis represents the median value of the first scan subtracted from the second. Reproducibility coeffecients, from top-left, clockwise: .0035, .0117, .0145, .0153.