4170
Three-dimensional pseudo-continuous arterial spin labeling(3D-pcASL) in differentiating tumor progression from treated effects in glioma1Department of Radiology, Peking Union Medical College Hospital, Beijing, People's Republic of China, 2Department of Radiology, Beijing Chao-Yang Hospital, Beijing, People's Republic of China, 3Department of Neurosurgery, Peking Union Medical College Hospital, Beijing, People's Republic of China
Synopsis
This study investigates the role of 3D-pcASL in discriminating between glioma progression(TP)and treatment related changes(TRC). We found that the maximum CBF (absolute value and its normalized values) in the lesion from 3D-pcASL were significantly higher in the TP group than in the TRC group. The ROC curve analysis showed the maximum CBF has an excellent performance in differentiating TP from TRC in patients with newly diagnosed glioma who have undertaken radiotherapy or chemoradiotherapy.
Purpose
The differentiation of tumor progression from treated effects (pseudoprogression and radiation necrosis) in patients with glioma is still challenging. To our knowledge, there is no study about the role of three-dimensional pseudo-continuous arterial spin labeling (3D pc-ASL), in the differential diagnosis of tumor progression and treated effects in the patients with glioma under radiation or chemoradiotherapy. Therefore, the purpose of this study is to explore the value of 3D-pcASL on this.
Methods
Thirty-one patients with histopathologically confirmed glioma and under post-surgery chemoradiotherapy were prospectively enrolled. Patients who didn’t have adequate MRI follow-up scans with contrast enhancement and 3D-pcASL data, and those who had MRI images of poor quality for analysis were excluded.
All follow-up MRI scans including 3D-pcASL and conventional T1WI, T2WI, FLAIR and contrast-enhancing T1WI were accomplished on a Discovery 750 3.0T ( GE Healthcare, Milwaukee, WI, USA ) scanner with an 8-channel phase-array head coil. ASL used a pulse sequence with background suppression and a spiral trajectory of k-space. The parameters of 3D pc-ASL were as follows: TR=4844 ms; TE=10.5 ms; post-labelling delay time=2025 ms; FOV=24×24 cm; matrix=512 points × 8 arms; slice thickness=4.0 mm; slice gap=0; NEX=3, and 40 pairs of tag and control images were acquired in about 4.7 min, with whole brain covered.
All the 3D-pcASL images were imported into a GE AW 4.5 workstation ( GE Healthcare, Milwaukee, WI, USA ) and post-processed with the 3D ASL Functool software to generate CBF maps of all patients. Then all the conventional images and CBF maps were analyzed using OsiriX ( Pixmeo, Switzerland ) .
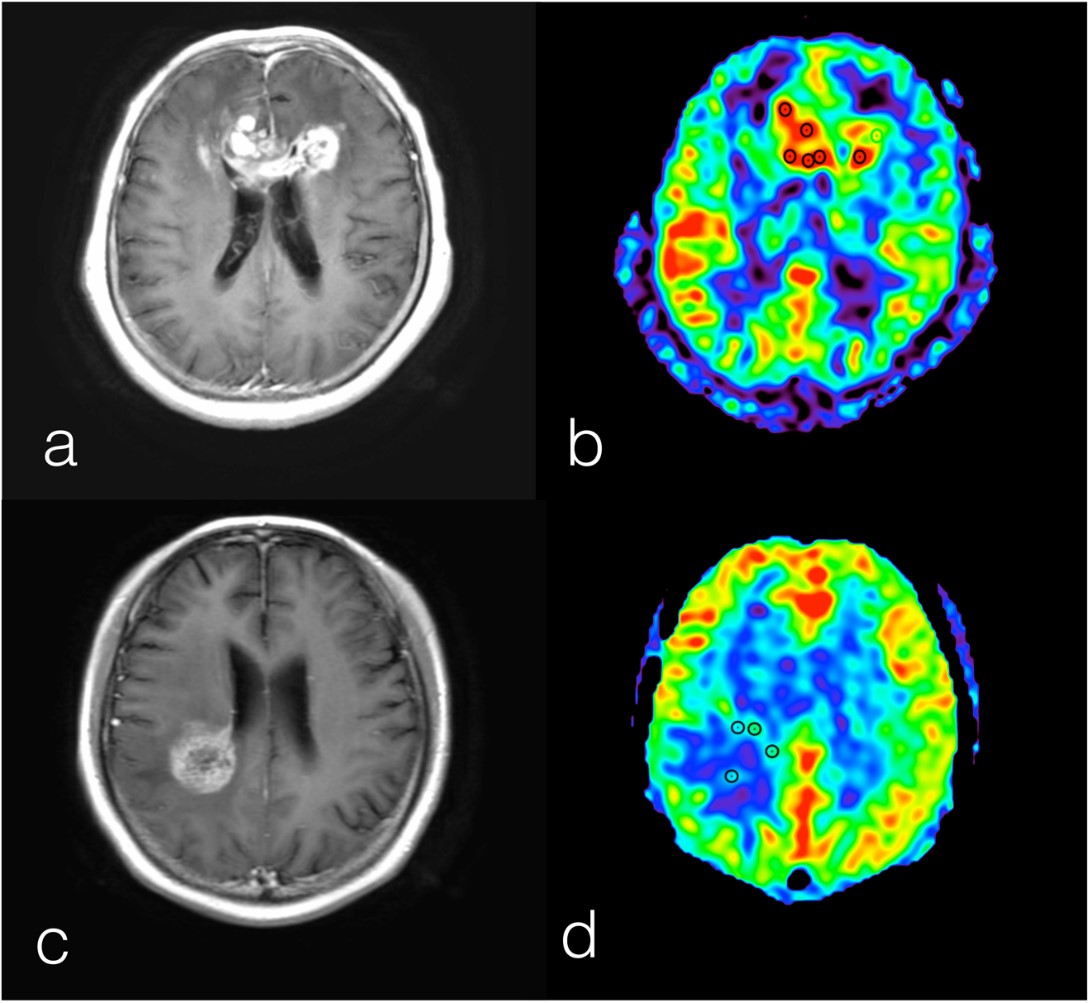
Firstly, a few round regions of interest (ROI) of 20~21mm2 were placed on the “hot spot” areas with the highest signal intensity in the lesion on each slice of the CBF maps. the maximum CBF of all ROIs was used in the data analysis. Secondly, two oval ROIs around 3cm2 were placed on the center of cerebellum hemisphere. The average CBF values of both ROIs were extracted and the mean value of both ROIs was recorded as aCBF_cb. Thirdly, an ROI (2.6~2.7cm2 ) was placed on the normal appearing white matter ( NAWM ) region contralateral to the lesion on the CBF maps to measure average CBF value as aCBF_wm. Thus, relative mCBF to cerebellum (rmCBF_cb) and NAWM (rmCBF_wm) was calculated as: rmCBF_cb=mCBF/aCBF_cb, rmCBF_wm=mCBF/aCBF_wm, respectively.
Vessels, cystic and hemorrhagic regions in the lesion, choroid plexus, and residual cavities of surgery were avoided during the ROIs placement. Clinical characteristics an CBF parameters between the tumor progression (TP) and treatment related changes ( TRC ) group were compared and the area under the receiver operating characteristic (ROC) curve ( AUC ) was used to evaluate the diagnostic performance of each CBF parameter to differentiate TP from TRC.
Results
In the 31 patients enrolled, 23 were diagnosed as TP and 8 cases as TRC. there is no statistical difference between the two groups in the distribution of age (P=0.112) , gender ( P=0.40 5) , KPS ( P=0.221) , or the time interval from radiotherapy initiation to the time of new enhancing lesions ( P=0.652 ) .
Figure 1 shows examples of TP and TRC.
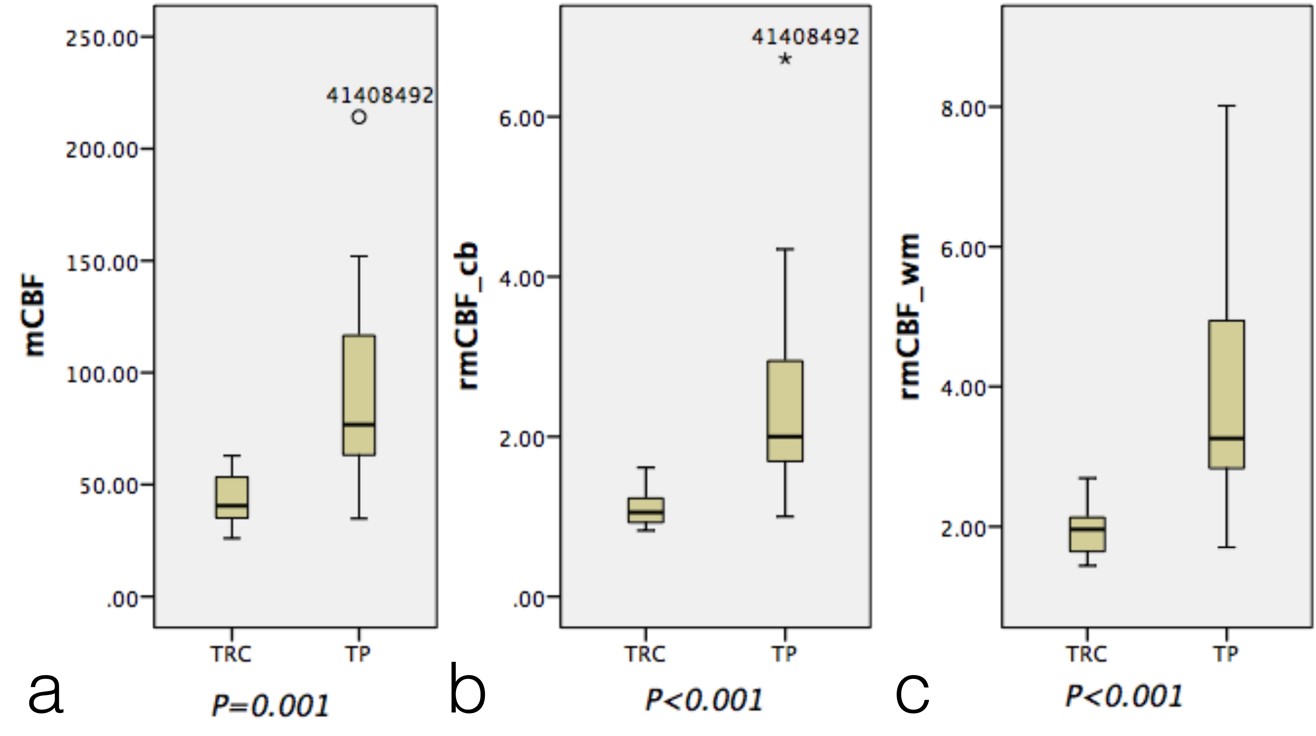
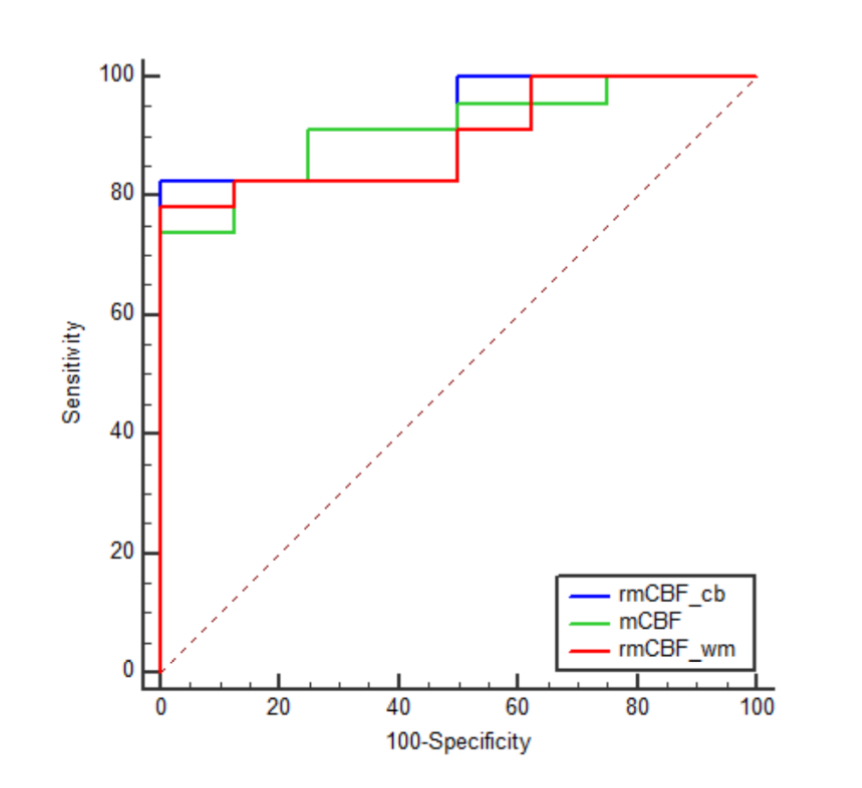
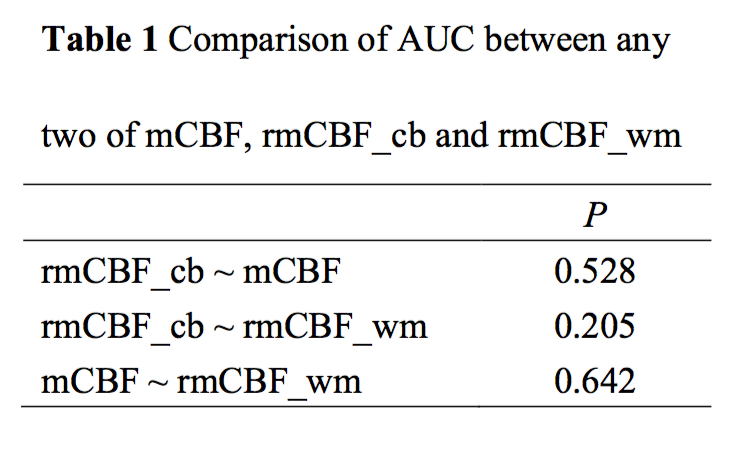
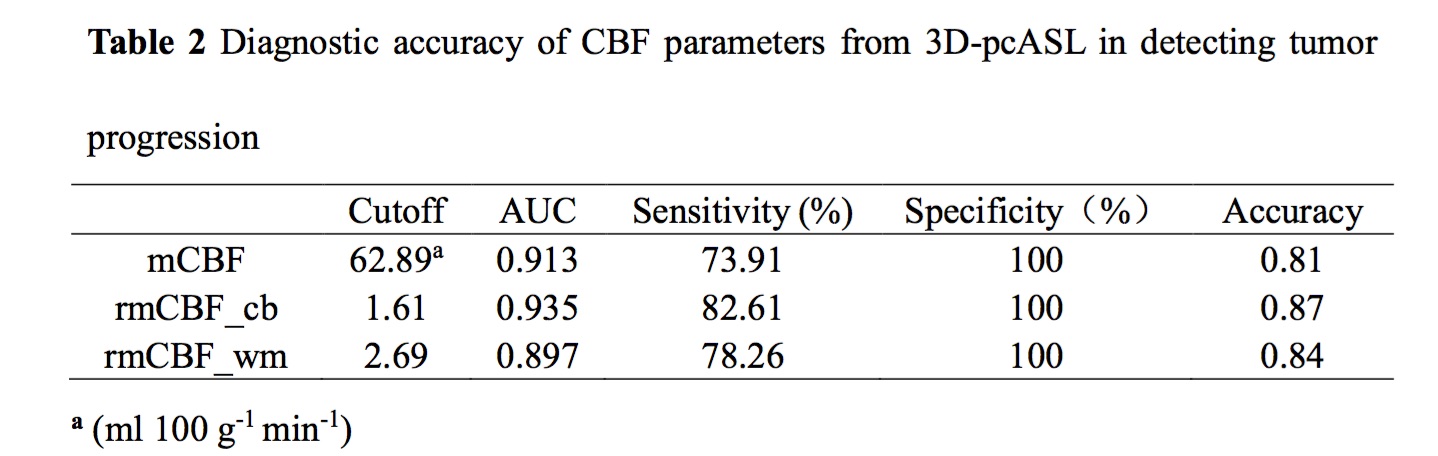
The means of mCBF ( 88.00 ml 100g-1 min-1 ±41.14[standard deviation] vs 43.35 ml 100g-1 min-1 ± 12.64,P=0.001 ), rmCBF_cb ( 2.43 ± 1.30 vs 1.11 ± 0.26, P<0.001 ) and rmCBF_wm ( 3.87 ± 1.69 vs 1.95 ± 0.39, P<0.001 ) in the TP group were all significantly higher than in the TRC group (Figure 2) The AUC of mCBF, rmCBF_cb and rmCBF_wm in detecting tumor progression were 0.913 ( 95% confidence interval[CI] [0.755,0.984],P<0.0001 ) , 0.935 ( 95% CI [0.785, 0.992],P<0.0001 ) and 0.897 ( 95% CI [0.734, 0.977],P<0.0001 )( Figure 3). However, no significant difference is found between any two AUC of the three parameters (Figure 4). The optimal cutoffs with the best sensitivity and specificity for mCBF, rmCBF_cb, and rmCBF_wm in detecting tumor progression are shown in Figure 5.
Discussion
Recurrent tumor has elevated vascular density while the treatment related changes often show low perfusion due to vascular obstruction, ischemia and infarction[1], which explains the higher CBF parameters in TP than those in TRC in our study. mCBF_cb had a tendency towards the highest AUC, which needs to be further confirmed in studies of a larger sample size. CONCLUSION The mCBF (absolute and normalized values) in the lesion from 3D-pcASL might help to differentiate TP from TRC in patients with newly diagnosed glioma under radiotherapy or chemoradiotherapy.Acknowledgements
None.References
[1] Yoo R, Choi S H. Recent Application of Advanced MR Imaging to Predict Pseudoprogression in High-grade Glioma Patients[J]. Magnetic Resonance in Medical Sciences.Figures