4167
ADC-Map Based Computer Aided Radiological Diagnostics (CARD) for the Initial Differential Diagnosis of Medulloblastoma versus Pilocytic Astrocytoma – A Reproducibility Study.1Neuroradiology, University Hospital Bern, Bern, Switzerland, 2Neurosurgery, University Hospital Bern, Bern, Switzerland, 3Department of Biostatistics, Institute of Epidemiology, Biostatistics and Prevention, University of Zürich, Zürich, Switzerland, 4Institute for Data Analysis and Process Design, ZHAW, Switzerland, 5Neuroradiology, University Bern, University Hospital, Bern, Switzerland, 6Neurosurgery, University Hospital Bern, Bern, 7Radiooncology, University Bern, University Hospital, Bern, Switzerland, 8Neuroradiology, University Hospital Bern, Switzerland
Synopsis
The diagnosis of brain tumors using visual criteria is very challenging. A novel computational method for computer aided radiologic diagnostics (CARD) is described based on quantitative textural features from ADC-maps, and a machine learning algorithm (Random-Forest classification). The reproducibility of the method was examined with 3 human raters was performed, and the Fleiss'-Kappa-test revealed high inter-rater agreement of κ=0.821 (p-value<<0.001) and an intra-rater agreement of κ =0.822 (p-value<<0.001). The method significantly improves the differential diagnosis of medulloblastoma versus pilocytic-astrocytomas.
Introduction
Imaging-based radiological diagnosis of contrast enhancing brain tumors is frequently very challenging since these tumors have often similar appearance in MR-images. Substantial improvements in initial brain tumor diagnostics can be obtained by combining region based quantitative image analysis1 of MR-images with machine learning methods2 for computer aided radiological diagnostics (CARD)3,4. Since the above cited methods depend on manually drawn contours that segment the whole tumor affected region in ADC-maps, it is justified to scrutinize the reproducibility of the such obtained Random Forest-classifiers. More specific it was examined what the intra- and inter-rater variability is on the Random Forest2 (RF) prediction quality for the differential diagnosis of medulloblastoma (MDB) versus pilocytic astrocytoma (PA).Methods
The ADC-maps (5mm slices, 256x256 pixel matrix, TE=89ms, TR=3000ms) of a total of 30 patients having histological confirmed brain tumors (16 MDB, and 14 PA patients), acquired on different 1.5T scanners of the same manufacturer, in a time interval of 10 years were included in the study. The ADC-maps were contoured in a locally developed JAVA application that performs the following steps:
(a.) Data-loading of ADC-maps from the file system;
(b.) ADC-map normalization – is performed such that the mean value of the ADC-map pixels within a contoured region of normal appearing white matter (NAWM) is set to a predefined reference value. This data normalization is necessary to eliminate difference in signal levels in the ADC-maps recorded on different MR-scanners, software versions, and head coil setups;
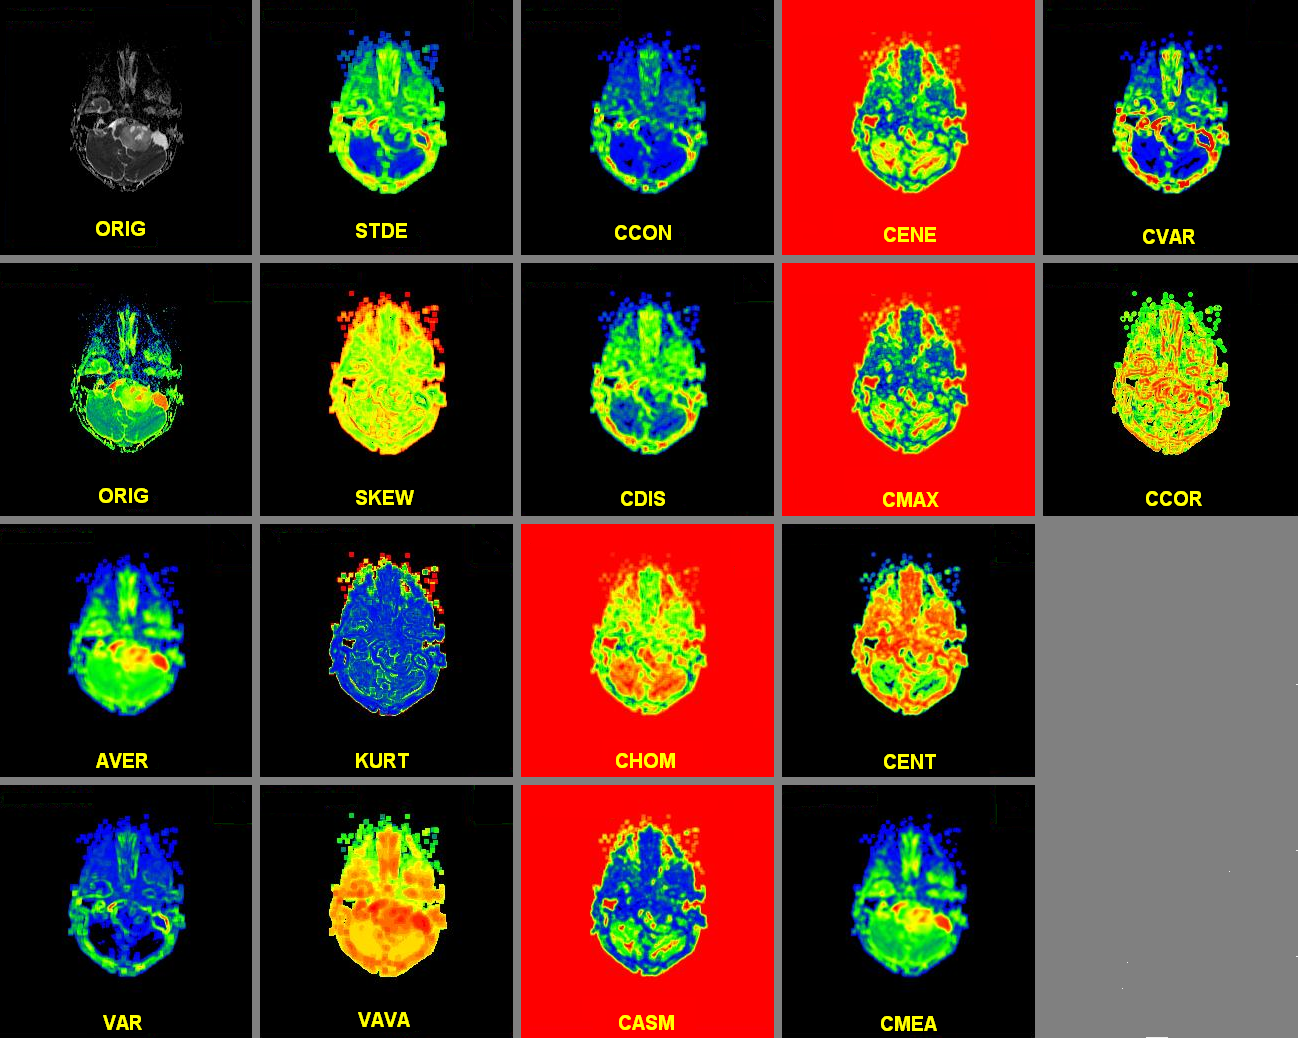
(c.) Contour definition and feature storage – after normalization, the radiologist defines, in every slice where the tumor is visible, a contour around the complete tumor affected zone (including cystic components, edema and high cellular density tumor-areas). From the normalized ADC-map, 16 texture maps are derived for each pixel based on a 5x5 pixel neighborhood: 6 histogram-based texture maps, and 10 cooccurence matrix-based texture-maps. An example of these texture maps for a PA-patient is displayed in Figure 1. For each set of pixels enclosed by the user-defined contour in each texture map, the following statistical texture-parameters (indicated in small italic symbols) were derived: (i.) mean, (ii.) standard deviation, (iii.) variance, (iv.) skewness, (v.) kurtosis and (vi.) variance-of- variance are computed. This results in a theoretical maximum of 17x6=102 computed texture-parameters. Finally a total of 94 texture-parameters were used per patient (omitting the variance-of-variance parameters, which have low variable-importance) as input for the RF-classifiers.
(d.) Classification – The default settings of the RF-algorithm2 were used (using the “R”-implementation with 1000 trees, and maximum three depth).
Results
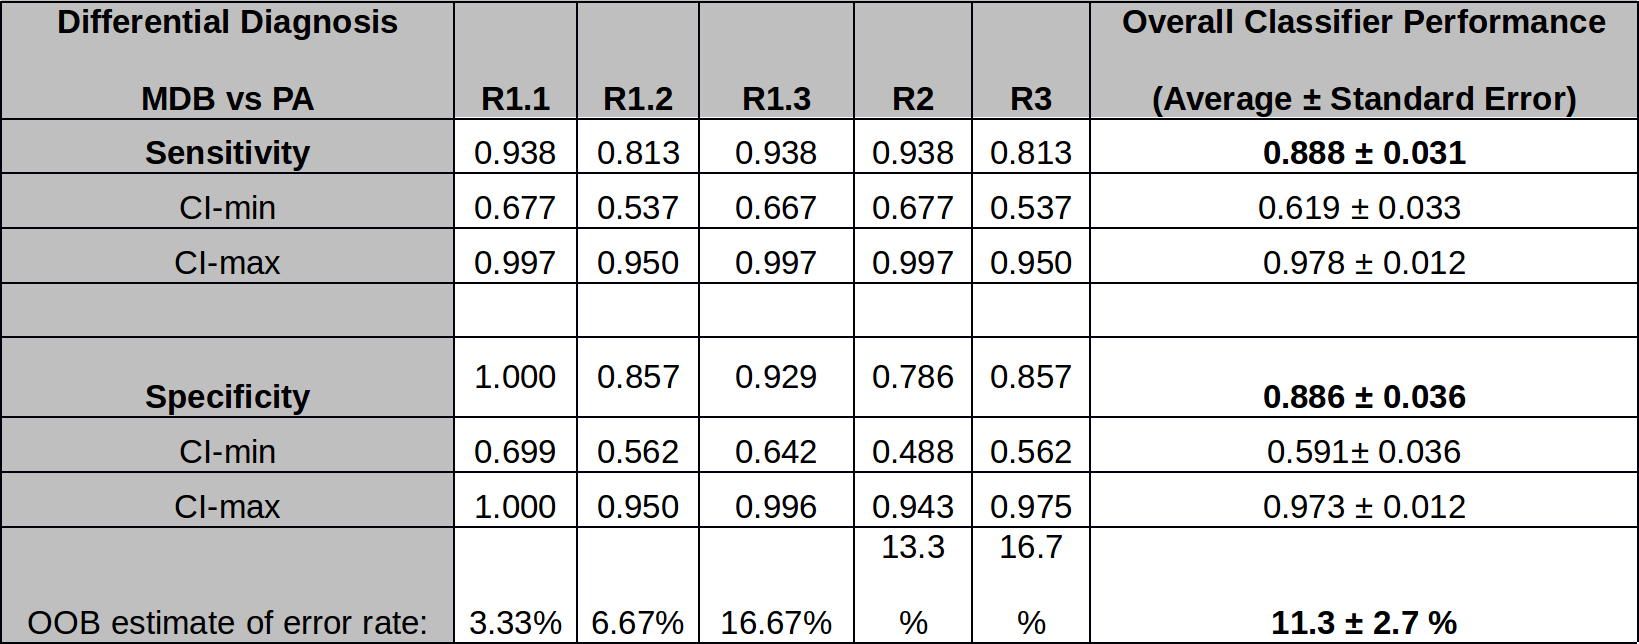
Classification Performance – For the RF-classifiers for MDB vs PA differential-diagnosis an overall average classification error-rate performance for 5 times repetitive contouring (thus averaging over inter- and intra-rater results) of 11.3±2.7% was found. The average sensitivity was 0.888±0.031 and average specificity was 0.886±0.036. The scores of the individual classifiers are listed in Table 1.
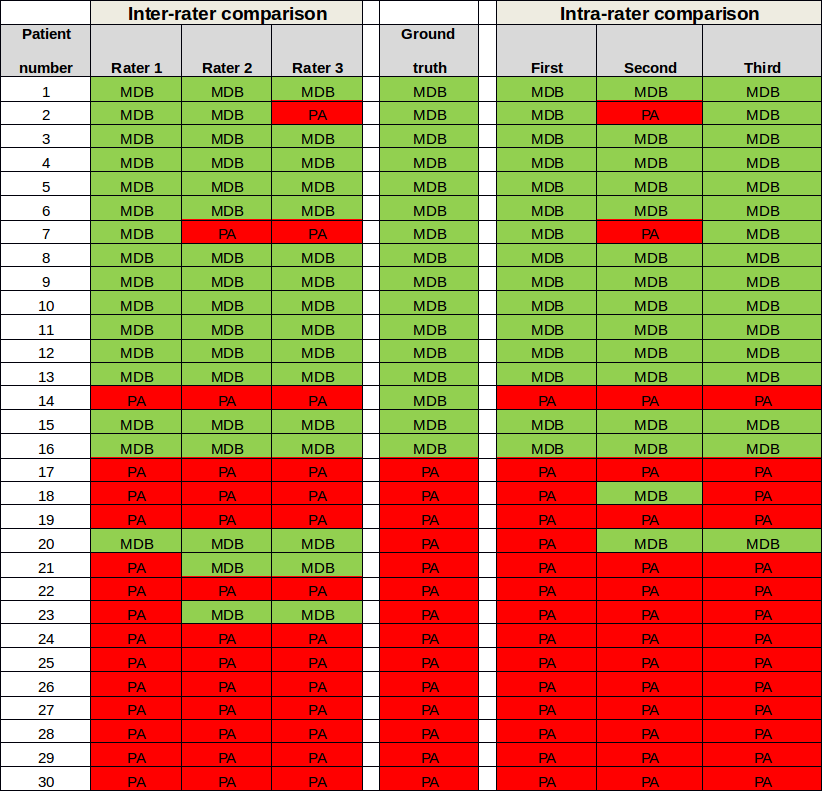
Inter-rater Variability – Three raters (R.1, R.2, R.3) have segmented the tumors and used the RF-classification for a CARD-diagnosis. The Fleiss' Kappa-test were used to quantify the agreement of the diagnosis results revealed κ=0.821 with z=7.79 and a p-value=6.88x10⁻¹⁵ (Subjects=30).
Intra-rater Variability – One rater has segmented the tumors on different days three times and used for each segmentation run the RF-classification for a CARD diagnosis. The Fleiss' Kappa-test were used to quantify the agreement of the diagnosis results revealed κ=0.822 with z=7.15 and p-value=6.22x10⁻¹⁵ (Subjects=30). For a graphical interpretation of the classifier performance as a function of the rater compared to the ground-truth, the is displayed in Table 2.
Discussion
Since the CARD-method depends on manual segmentation of the complete tumor affected area, the classification performance could, in principle, strongly depend on the individual segmentation of each individual rater. Therefore in this study a reliability analysis was performed to investigate the reproducibility of the CARD-diagnosis. For the inter- and intra-rater reproducibility a Fleiss' Kappa-test value of κ=0.821 (p-value<<0.001), respectively κ=0.822 (p-value<<0.001) was found, which means that there is a very high agreement in obtained classifiers5. Since the inter-rater and intra-rater reproducibility seems to be nearly identical, one may conclude that small differences in the human contoured tumor volumes do not significantly affect classification-performance. Additionally one rater can reproduce its own contouring as good as different raters amongst each others. Conclusion
Manual segmentation of the “whole tumor-affected brain-volume” can be reproduced to a high level of agreement in ADC-maps, resulting in reproducible RF-classifiers to decide differential-diagnoses of brain tumors in CARD.Acknowledgements
Funding of the Swiss National Foundation (grant number 140958) is acknowledged.References
1. Haralick RM, Shanmugam K. Textural Features for Image Classification. Syst Man Cybern. 1973;3(6):610-621. doi:10.1109/TSMC.1973.4309314.
2. Breiman L. Random forests. Mach Learn. 2001;45(1):5-32. doi:10.1023/A:1010933404324.3. Slotboom J, Pica A, Wiest R, et al. Towards Computer Aided Neuroradiological Diagnostics of Brain Tumors. Neuro Oncol. 2014;16(suppl 2):ii85-ii85. doi:10.1093/neuonc/nou174.327.
4. Slotboom J, Pedrosa de Barros N, Bauer S, et al. Computer Aided Radiological Diagnostics: Random Forest Classification of Glioma Tumor Progression using Image Texture Parameters derived from ADC-Maps. In: Proceedings of the 23rd Annual Meeting of the ISMRM. ; 2014:2262.
5. Viera AJ, Garrett JM. Understanding interobserver agreement: The kappa statistic. Fam Med. 2005;37(5):360-363. doi:Vol. 37, No. 5.
Figures