4161
Altered Structural Connectivity Networks in Young Adults Perinatally-infected with HIV1Radiology, University of Miami, Miami, FL, United States, 2Pediatrics, University of Miami, Miami, FL, 3Pediatrics, University of Missouri, Kansas City, MO, 4Developmental and Behavioral Sciences, Children's Mercy, Kansas City, MO
Synopsis
Milder forms of HIV-associated neurocognitive disorders (HAND) are frequently observed in approximately half of the HIV-infected individuals, even with treatment for HIV infection. Cognitive deficits observed in them can be associated with injury to the frontal and temporal lobes of their brains. The goal of this study was to assess the impact of HIV infection on vulnerable structural connections in these lobar regions in adults perinatally-infected with HIV. Our results indicate that altered connectivity in frontal lobe regions with differentiated modularity and significant alterations in hub patterns at the temporo-parietal junction occurred in the HIV group.
Purpose
The aim of this study was to assess the impact of HIV infection on the whole-brain cortical structural connectivity networks in adults perinatally-infected with HIV.Methods
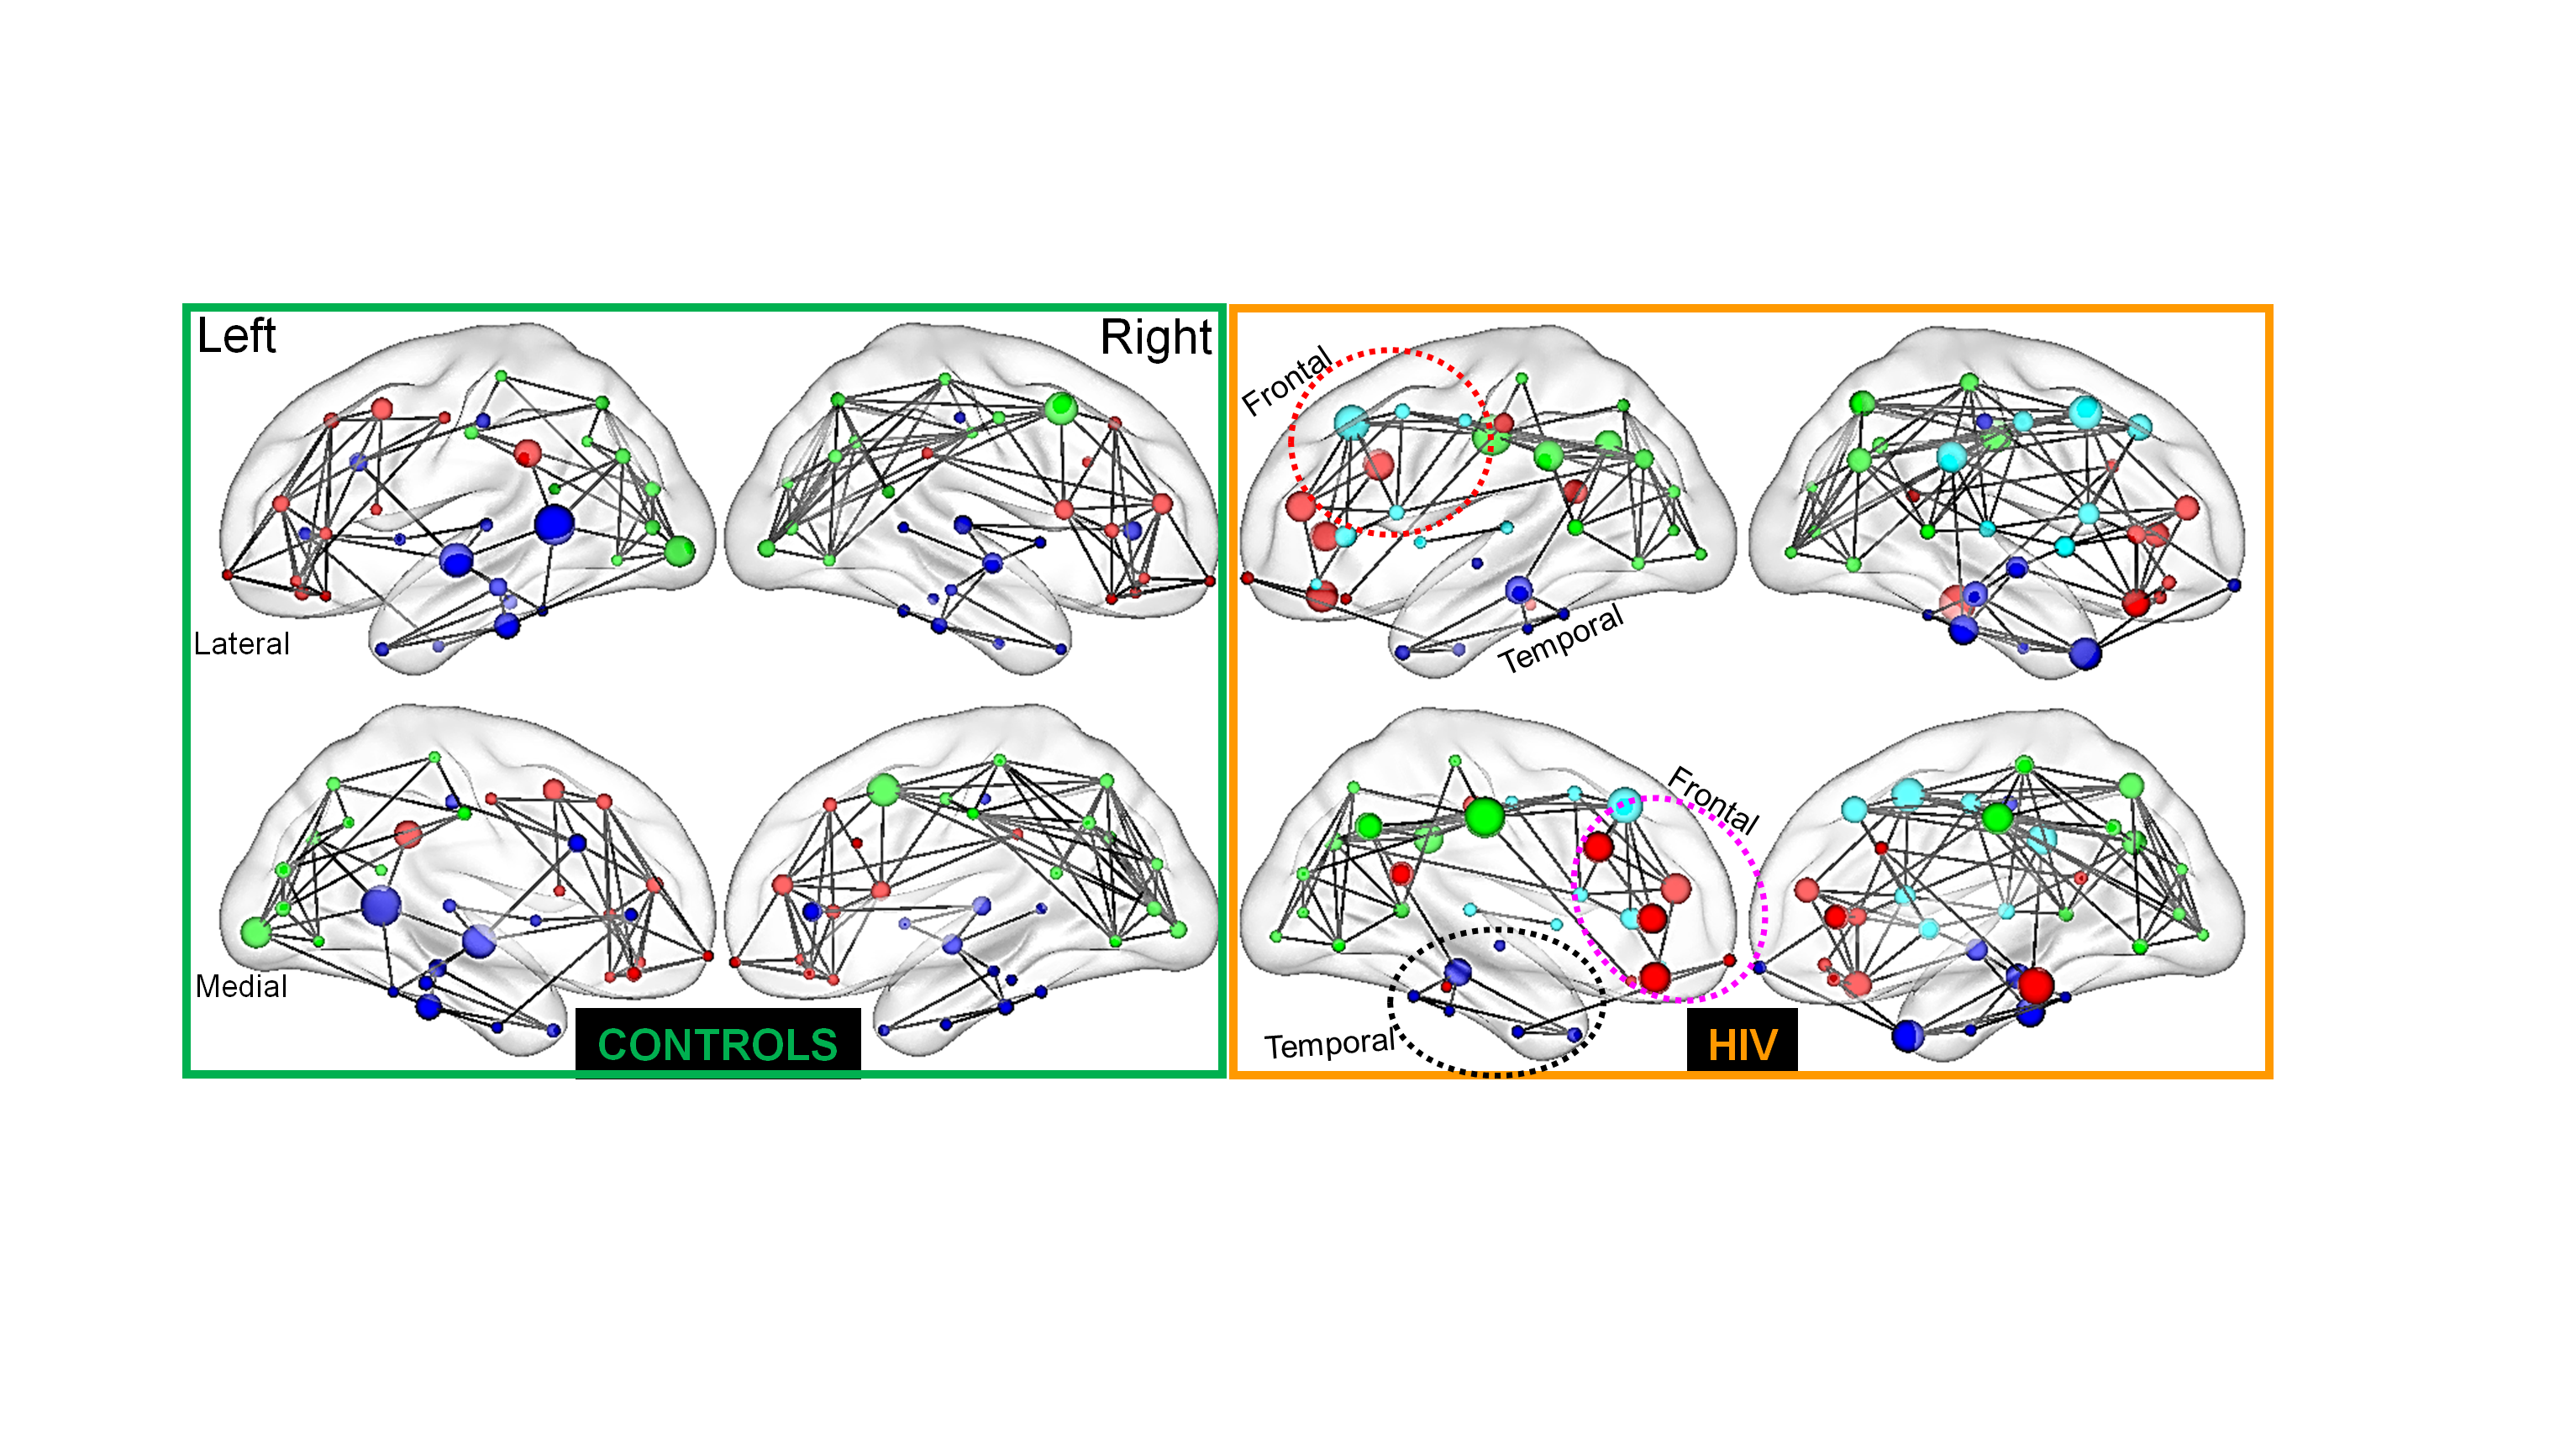
T1-MRI data (1 mm3; TR/TE: 2300/2.38 ms) of the brain of 28 individuals perinatally-infected with HIV (20.3±1.9 years) and 29 healthy normal subjects (20.9±1.7 years), acquired at 3 Tesla, were used for this analysis. We used FreeSurfer and its pipeline processing approach to process the T1-MRI that produced cortical thickness values for 68 cortical gray matter regions as defined in the Desikan-Killiany atlas. 1 The regional cortical thickness data were corrected for gender and mean overall cortical thickness using linear regression. 2,3 A whole-brain network comprised of nodes and edges (Figure 2) was constructed with the 68 regions as the nodes of a network for each group (HIV or Control). The edges of the network were constructed, first, by calculating the Pearson correlation coefficient of the cortical thicknesses of each pair of nodes in the network. Secondly, an appropriate fixed sparsity threshold was chosen to convert the coefficient values between any two distinct regions to a binary map for each group. The coefficient value was set to 1 if the absolute value of it was greater than the chosen threshold, and only the coefficient values of 1 in this map produced edges of the network. 4-6 We used a fixed sparsity to threshold network graphs for both the groups that overcomes differences in number of edges in distinct graphs, and for group comparisons to reflect changes due to alterations in topological organization. 6,7
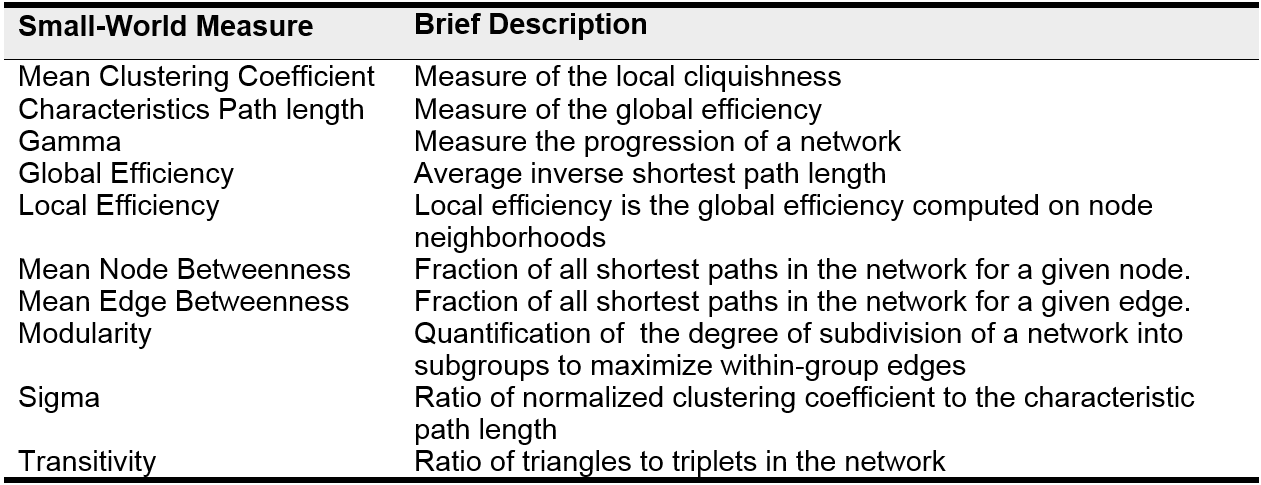
We used Graph Analysis Toolbox (GAT 8) for the construction of networks and evaluation of their small-world properties using standard approaches, 7 and BrainNet Viewer 9 to visualize the networks. We evaluated few small-world network metrics that include mean clustering coefficient, average path length, gamma value, global efficiency, local efficiency, mean node betweenness, mean edge betweenness, modularity, and sigma and transitivity. 10,11 A brief description of these measures is provided in Table 1.
Results and Discussion
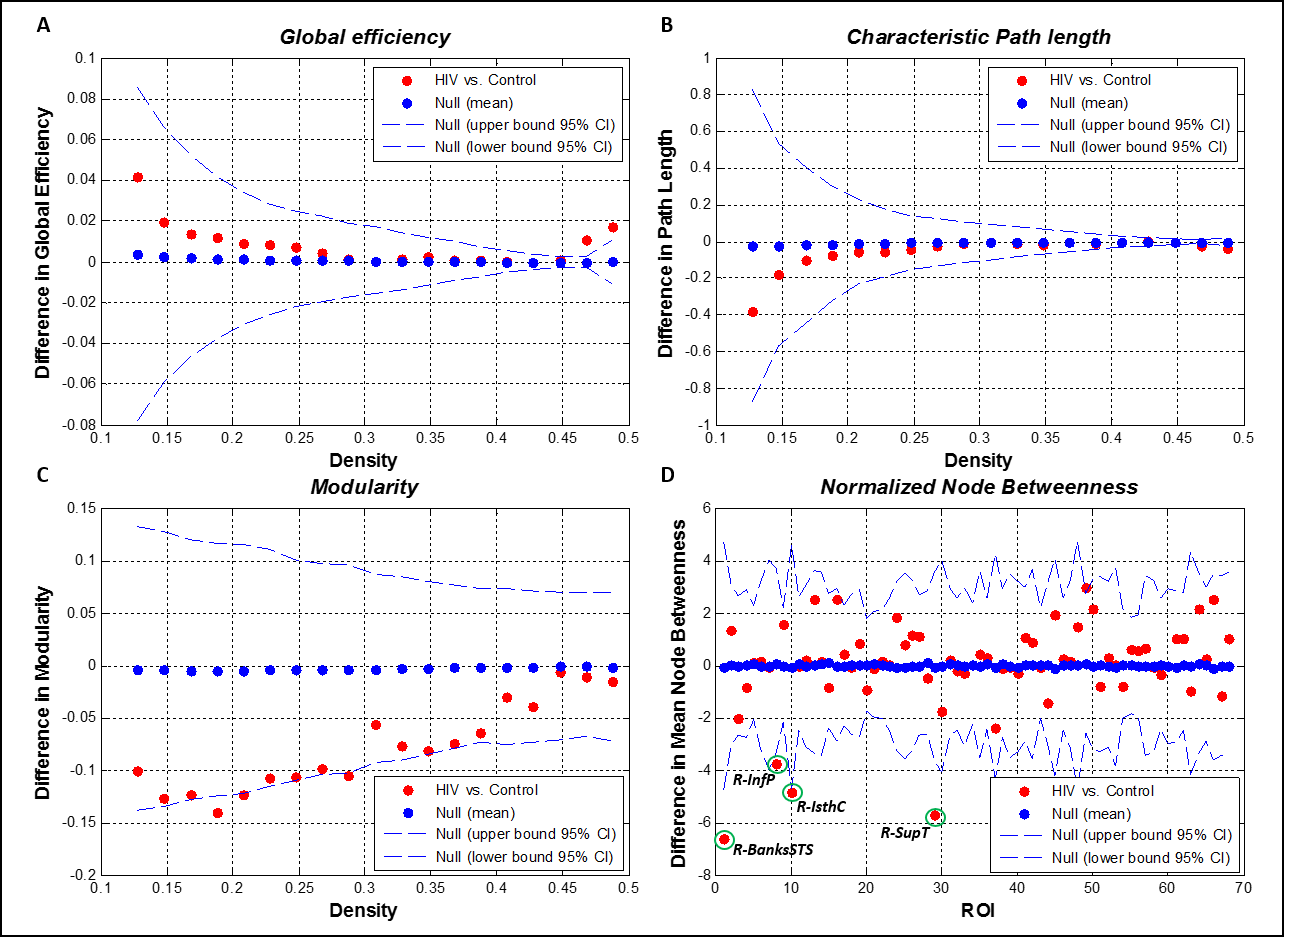
As shown in Figure 1, our results indicate significant differences in global efficiency, characteristic path length and modularity between the brain networks of HIV+ and control groups. Furthermore, significant differences were found for regional normalized betweenness in the right hemispheric brain regions such as posterior banks of the superior temporal sulcus (R-BanksSTS), inferior parietal (R-InfP), isthmus cingulate (R-IsthC) and superior temporal (R-SupT), and these regions are marked by green circles in Figure 1 D. Our results (not shown) also indicated that local network properties such as mean clustering coefficient and local efficiency were not statistically different between the HIV+ and control groups. The above results suggest that the alterations found in the brain network connectivity are not localized in HIV infection, unlike found in pathologies such as Alzheimer’s disease, but reflect subtle and more widespread changes due to the presence of HIV throughout the brain.
In Figure 2 are shown the results of modularity analysis that maximizes the number of within-group edges and minimizes the number of between-group edges. There are two findings from this figure. First, we observed an additional module in the frontal lobe for the HIV+ group (cyan, marked with a red circle on the right panel), compared to the control group. This additional frontal lobe module may be related to neuropsychological deficits found in individuals with HIV infection that are associated with frontal lobe impairment. Secondly, we found two distinctive features in the distribution of hubs in the HIV group as compared to the control group. These are: 1) HIV group shows a loss of hubs in the temporal lobe (marked with black circle), and 2) an increased accumulation of hubs in the frontal lobe of the HIV group (marked with purple circle). Since hubs are characterized by increased nodal betweenness and hypothesized to be nodes of the brain network with integrative functions, any change in them will have remarkable impacts on the stability and efficiency of the network. 12 These additional hubs in the frontal region can be attributed to neuropsychological deficits frequently observed in individuals with HIV infection that are related to frontal lobe impairment. Furthermore, the increased hub density in the frontal lobe of HIV group is speculated to indicate development of new compensatory connectivity networks that may enable HIV+ subjects to use additional cognitive resources. 5
Acknowledgements
This study was funded by the Miami Center for AIDS Research (CFAR) at the University of Miami Miller School of Medicine, under a National Institutes of Health Grant [P30 AI073961].References
1. Desikan RS et al. Neuroimage 2006;31(3):968-980.
2. Goryawala M et al. Biomed Phys Eng Express 2015;1(1):1-14.
3. Zhou Q et al. The Scientific World Journal 2014;2014.
4. He Y et al. J Neurosci 2008;28(18):4756-4766.
5. He Y et al. Cereb Cortex 2007;17(10):2407-2419.
6. Yao Z et al. PLoS Comput Biol 2010;6(11):e1001006.
7. Kaiser M. Neuroimage 2011;57(3):892-907.
8. Hosseini SM et al. PLoS One 2012;7(7):e40709.
9. Xia M et al. PLoS One 2013;8(7):e68910.
10. Rubinov M, Sporns O. Neuroimage 2010;52(3):1059-1069.
11. Sporns O et al. Trends Cogn Sci 2004;8(9):418-425.
12. Achard S et al. J Neurosci 2006;26(1):63-72.
Figures