4160
Volumetric MR analysis of brain areas identifies SCA 1, 2 and 3 by applying random forest classifier1Physiology, All India Institute of Medical Sciences (AIIMS), NewDelhi, India, 2Pediatrics, All India Institute of Medical Sciences (AIIMS), New Delhi, India, 3Center for Biomedical Engineering (CBME), Indian Institute of Technology (IIT), New Delhi, India, 4Center for Biomedical Engineering (CBME), All India Institute of Medical Sciences (AIIMS), NewDelhi, India, 5NMR, All India Institute of Medical Sciences (AIIMS), NewDelhi, India, 6Neurology, All India Institute of Medical Sciences (AIIMS), NewDelhi, India
Synopsis
Brain volumetric analysis of SCA 1, 2 and 3 shows differential measurements with reference to cortical thinning and volumes of brain stem and cerebellum. Therefore, to find a solution to classify SCA1, 2 and 3, we have applied machine learning approach for feature selection followed by random forest modeling using volumetric features of the brain.
Keywords: SCA, volumetric, cortical and subcortical brain areas, Boruta, random forest classifier
Introduction: Cerebellar and brain stem atrophies are well known in spinocerebellar ataxia (SCA) types 1, 2 and 3 patients by various neuroimaging studies1,2,3, but very little is known about cortical and subcortical volumetric analysis. It has been revealed that cortical and subcortical areas are differentially involved in SCA 1, 2 and 3. To resolve these differences and to see whether these could be predictive of SCA subtypes, we did extensive feature selection using a battery of techniques followed by a classification model using the Random Forest classifier4,5. It was seen that the model was correctly able to differentiate SCA 1 from SCA 2 with 87.5% accuracy. However, due to lower sample size and possibly overlapping volumetric features, SCA 3 was not differentiable from SCA 1.
Methods: MRI was performed by using a 3T scanner (Philips, Achieva) to obtain 3D T1-weighted scans of the whole brain and analysed by Freesurfer (version 5.3) software in genetically proven SCA (n = 49, age = 34 ± 9.4 yrs). MRI parameters used in T1-weighted scans were: Voxel size = 0.6×0.6×1, FOV = 240×240×180 and flip angle = 8ᵒ. Volumetric analysis was conducted on 136 areas of brain in SCA1 (n=18), SCA2 (n=25) and SCA3 (n=6). Dimensionality reduction and feature selection was done using a battery of standard statistical and machine learning models such as chi-square, information gain, entropy based methods and Boruta algorithm3. Features from Boruta were found to be overlapping with other techniques and were carried forward for predictive modeling. Data were divided into training and testing sets and a Random Forest algorithm was applied in the classification mode using SCA 1, SCA 2 and SCA 3 as the response variables upon the training set. Accuracies were validated on the held out testing set.
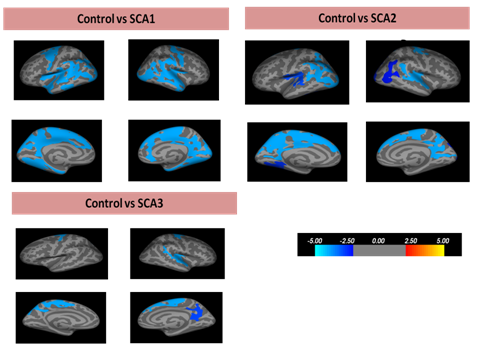
Result: Significant cortical thinning in different areas have been seen in left hemisphere (Lh)and right hemisphere (Rh) in all SCA patients when compared with control (Figure 1). In SCA1,Lh_entorhinal (p < 0.001), Lh_paracentral (p < 0.001), Rh_parahippocampal (p < 0.001) and Rh_parsopercularis (p = 0.047) showed thinning. In SCA2, Lh_precuneus (p < 0.001), Lh_lateraloccipital (p < 0.001), Lh_precentral (p = 0.013 ),Lh_superiortemporal (p < 0.001),Lh_lingual (p = 0.001), Rh_paracentral (p < 0.001), Rh_insula (p < 0.001), Rh_lateraloccipital (p < 0.001) and Rh_inferiorparietal (p = 0.002) appeared thinning. In SCA3, Lh_superiorparietal (p < 0.001), Lh_superiortemporal (p = 0.002), Rh_insula (p < 0.001), Rh_paracentral (p < 0.001), Rh_precuneus (p < 0.001) and Rh_pericalcarine (p = 0.002) were also found thinning.
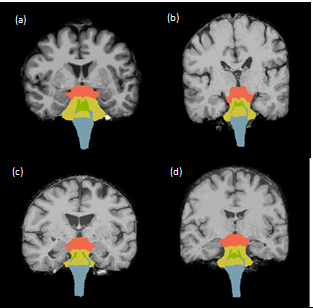
In case of subcortical analysis, significant volume loss was seen in right and left cerebellum cortex, cerebellum white matter, pallidum, thalamus,hippocampus and amygdala. The volume of midbrain (p < 0.001), SCP (p < 0.001), pons (p < 0.001), medulla (p < 0.001) and whole brainstem (p < 0.001) were significantly reduced in SCA1 and SCA2 in comparison with control (Figure 2). Also midbrain, pons and whole brainstem volume have been found significantly lower (p <0.001) in SCA2 than SCA1 and SCA3.
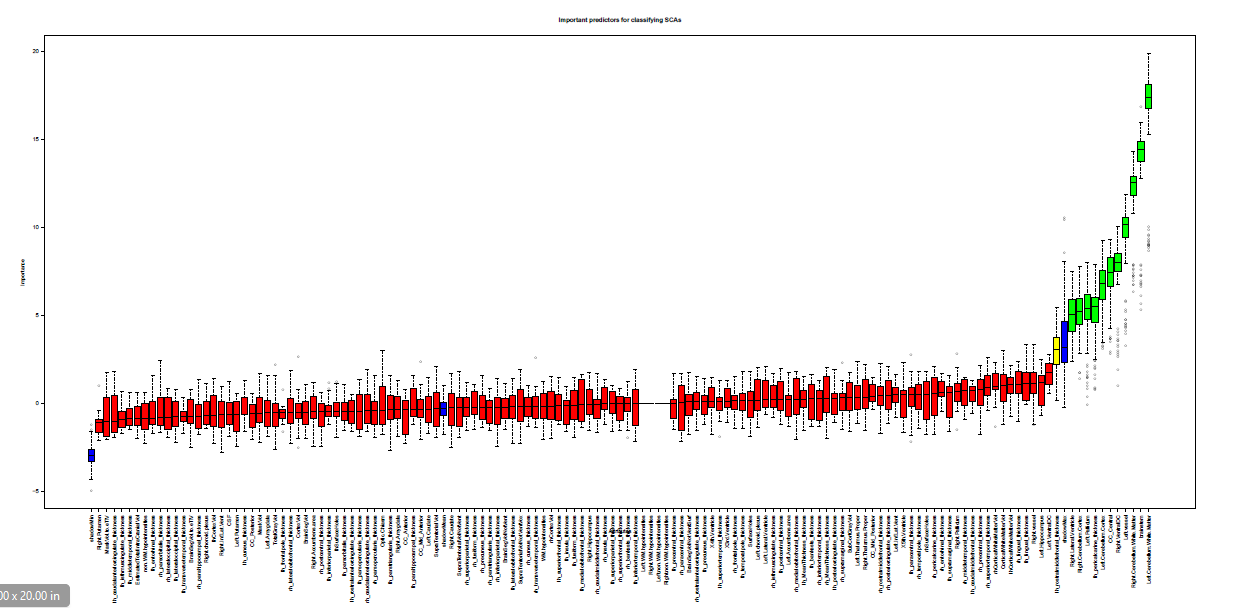
It was seen from the overlap of feature selection methods that Boruta’s output overlapped with most other feature sets hence this subset was used as predictors for further modeling.Feature selection using Boruta revealed significant predictive value of different brain regions in SCAs. These are: right lateral ventricle, right cerebellum cortex, left pallidum, left hemisphere pericalcarine thickness, left cerebellum cortex, corpous callosum central, right ventral diencephalon, left vessel, right cerebellum white matter, brainstem and left cerebellum white matter (Figure 3).
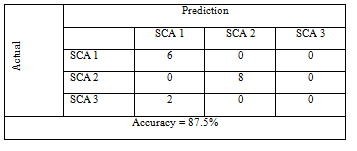
Being a multinomial classification problem, Random Forest model was best suited and attained a class-wise accuracy 87.5% in the training set (Table 1). Validation of the model was also done upon a held-out test set where similar accuracy of distinction between SCA 1 and SCA 2 were observed. However, SCA 3 was practically indistinguishable from SCA 1. This may be because of the low patient numbers and/or overlapping volumetric features.
Conclusion: This is the first example of volumetric analysis of brain MRI leading to classification models that could differentiate and predict SCA 1 or SCA 2 using a handful of features selected by rigorous statistical and machine learning methods. Such analyses may lead to providing quick decision support to the neurologists in difficult to recognize cases without the additional cost of genetic testing.
Acknowledgements
Highly obliged for the study conducted in autonomic function lab, Department of Physiology for patient testing and patient recruitment in department of neurology in All India Institute of Medical Sciences (AIIMS), New Delhi, India. MRI has been done in the department of NMR in AIIMS as well. Dr Farooq is thankfully acknowledged for the genetic testing of SCAs in Institute of Genomics and Integrative Biology (IGIB), New Delhi, India.References
1. De Rezende TJ, D'Abreu A, Guimarães RP, Lopes TM, Lopes-Cendes I, Cendes F, Castellano G, França MC Jr. Cerebral cortex involvement in Machado-Joseph disease. Eur J Neurol. 2015 Feb; 22(2): 277-83.
2. Rüb U, Schöls L, Paulson H, Auburger G, Kermer P, Jen JC, Seidel K, Korf HW, Deller T. Clinical features, neurogenetics and neuropathology of the polyglutamine spinocerebellar ataxias type 1, 2, 3, 6 and 7. Progress in neurobiology. 2013 May 31;104:38-66.
3. Jacobi H, Hauser TK, Giunti P, Globas C, Bauer P, Schmitz-Hübsch T, Baliko L, Filla A, Mariotti C, Rakowicz M, Charles P, Ribai P, Szymanski S, Infante J, van de Warrenburg BP, Dürr A, Timmann D, Boesch S, Fancellu R, Rola R, Depondt C, Schöls L, Zdzienicka E, Kang JS, Ratzka S, Kremer B, Stephenson DA,Melegh B, Pandolfo M, Tezenas du Montcel S, Borkert J, Schulz JB, Klockgether T. Spinocerebellar ataxia types 1, 2, 3 and 6: the clinical spectrum of ataxia and morphometric brainstem and cerebellar findings. Cerebellum. 2012 Mar;11(1):155-66.
4. Kursa MB, Rudnicki WR. Feature selection with the Boruta package. Journal of Statistical Software. 2010 Sep;36 (11).
5. Breiman L. Random forests. Machine learning. 2001 Oct 1;45(1):5-32.
Figures