4158
The Grey Matter Density of the Thalamus Correlates with the Cirrhotic Indexes and Child-Pugh Score in Cirrhotic Patients: A Voxel-Based Morphometry Study.1ZhongDa Hospital, Nanjing, People's Republic of China, 2Information Department, ZhongDa Hospital, Nanjing, People's Republic of China, 3Radiology Department, ZhongDa Hospital, Nanjing, People's Republic of China
Synopsis
Altered brain structure in cirrhotic patients have been seen in previously reported studies. Many studies focus on the grey matter change of the caudate putamen, while few study investigate the relationship of thalamus grey matter change and cirrhotic symptoms. Our study reveal that the grey matter density of thalamus is closely correlated with the clinical makers of the cirrhosis, which may help to clarify the mechanism of the thalamus structural change.
Purpose
To investigate the relationship between regional grey matter density and clinical markers or performance of neuropsychological tests in cirrhotic patients with and without minimal hepatic encephalopathy (MHE).Methods
45 cirrhotic patients without MHE ( age = 49.8 ± 8.97, No-HE group ), 33 cirrhotic patients with current MHE ( age = 51.7 ± 8.43, MHE group ) and 21 healthy controls ( age = 51.5 ± 7.67, Control group ) were enrolled in the study. Total bilirubin levels, albumin levels, ALT levels, AST levels, ratio of AST and ALT, blood coagulation time and Child-Pugh Score were collected from 54 of the cirrhotic patients ( 21 in MHE group, 33 in No-HE group ). Neuropsychological tests including Number Connection Test A, Number Connection Test B, Digit Symbol Test and Block Design Test were used to evaluate the cognitive state of all the subjects.
MR imaging data were acquired with a 3.0 T Siemens MRI scanner. The DARTEL method in SPM8 package were used to do segmentation and normalization of the 3d T1 images. Smoothed grey matter density images of the three groups were analyzed with an ANOVA test to detect brain regions of significant grey matter density difference. Multiple comparison correction were performed by using family wise error rate correction with a cluster defining threshold P=0.001 ( two tail ), corresponding to a cluster level of P=0.05. Post-hoc t tests with bonferroni correction were used to compare the intergroup difference within the mask of the ANOVA results.
The grey matter density of brain regions of significant difference in ANOVA test were extracted and compared among groups. Within group Pearson correlations were performed between the regional grey matter density and clinical markers, and also with the performance of the neuropsychological tests. Multiple correlation correction were performed with a false discovery rate ( FDR ) correction.
Results
Decreased grey matter density are found in bilateral striatum, left hippocampus, cerebellar vermis and most notably in putamen when the cirrhotic patients are compared to the healthy controls, while the bilateral thalamus and the calcarine cortex exhibit significant increased grey matter density( Fig1, Fig2 ). The grey matter change of the thalamus ranks the highest difference level of the ANOVA analysis.
The grey matter density of the thalamus correlates with the Child-Pugh Score in MHE group ( r= 0.632, P = 0.002, Q = 0.046, Fig 3. ), and it correlates with AST/ALT in both the No-HE group ( r = 0.497, P = 0.003, Q = 0.048, Fig 4. ) and MHE group( r = 0.657, P = 0.001, Q = 0.046 ). The grey matter density of the thalamus also correlates with blood coagulation time ( r = 0.633, P = 0.001, Q = 0.003 ) and negatively correlates with albumin levels ( r = -0.555, P = 0.001, Q = 0.017) in No-HE group. In MHE group, thalamus grey matter density still has a certain degree of correlation with the blood coagulation time ( r = 0.578, P = 0.006, Q = 0.088 ) and albumin levels ( r = -0.448, P = 0.042, Q = 0.36 ), but do not pass the FDR correction. There is no correlation between thalamus grey matter density and the neuropsychological tests performance, and there also do not exist a correlation between grey matter density of other brain regions and clinical makers or neuropsychological tests performance.
Discussion
The brain areas of altered grey matter density detected by VBM analysis were largely coincident with previous report studies1-4. Symmetrical grey matter alterations appeared in the cirrhotic patients, the alteration was greater and more extensive in MHE group than No-He group. The grey matter density of the thalamus closely correlated with the clinical marks which reflect the degree of cirrhosis. In MHE group, thalamus grey matter density also had a relationship with liver function classification.Conclusion
The degree of cirrhosis and live function impairment can be directly reflected by thalamus grey matter density. This may help to clarify the mechanism of the increased thalamus volume in cirrhotic patients. Despite the grey matter change of the caudate putamen, the grey matter change of the thalamus may also play a very important role in encephalopathy of the cirrhotic patients.Acknowledgements
No acknowledgement found.References
1. Guevara M, Baccaro ME, Gómez-Ansón B, et al. Cerebral magnetic resonance imaging reveals marked abnormalities of brain tissue density in patients with cirrhosis without overt hepatic encephalopathy. J Hepatol. 2011;55(3):564-73.
2.Chen, H. J., Zhu, X. Q., Shu, H., et al. Structural and functional cerebral impairments in cirrhotic patients with a history of overt hepatic encephalopathy. Eur J Radiol. 2011;81(10):2463-2469.
3.Zhang, L. J., Qi, R., Zhong, J. , et al. The effect of hepatic encephalopathy, hepatic failure, and portosystemic shunt on brain volume of cirrhotic patients: A voxel-based morphometry study. PLoS One. 2012;7(8):e42824.
4.Tao, R., Zhang, J., You, Z., et al. The thalamus in cirrhotic patients with and without hepatic encephalopathy: A volumetric MRI study. Eur J Radiol. 2013;82(11):e715-20.
Figures
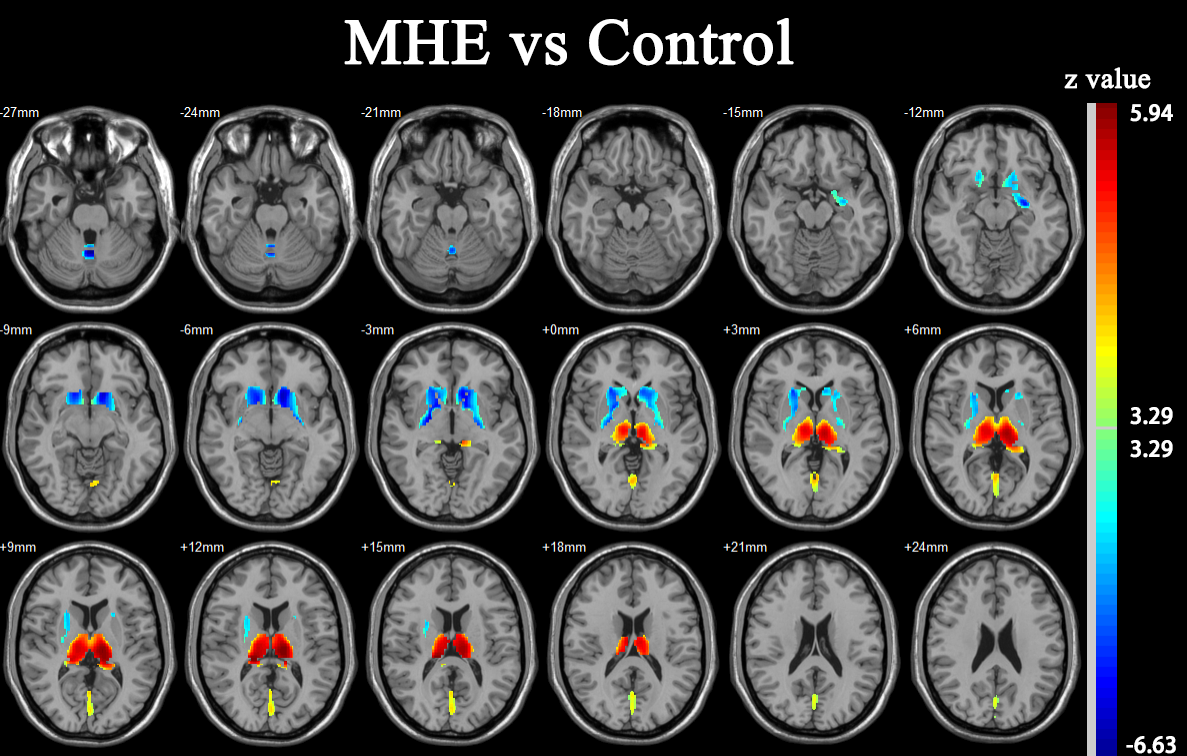
Figure. 1
Z value map of post-hoc t test between MHE group and control group. voxel P=0.001, cluster P=0.05/3, FWE corrected. Red indicates increased grey matter density in MHE group compared with control group, while blue indicates decreased grey matter density.
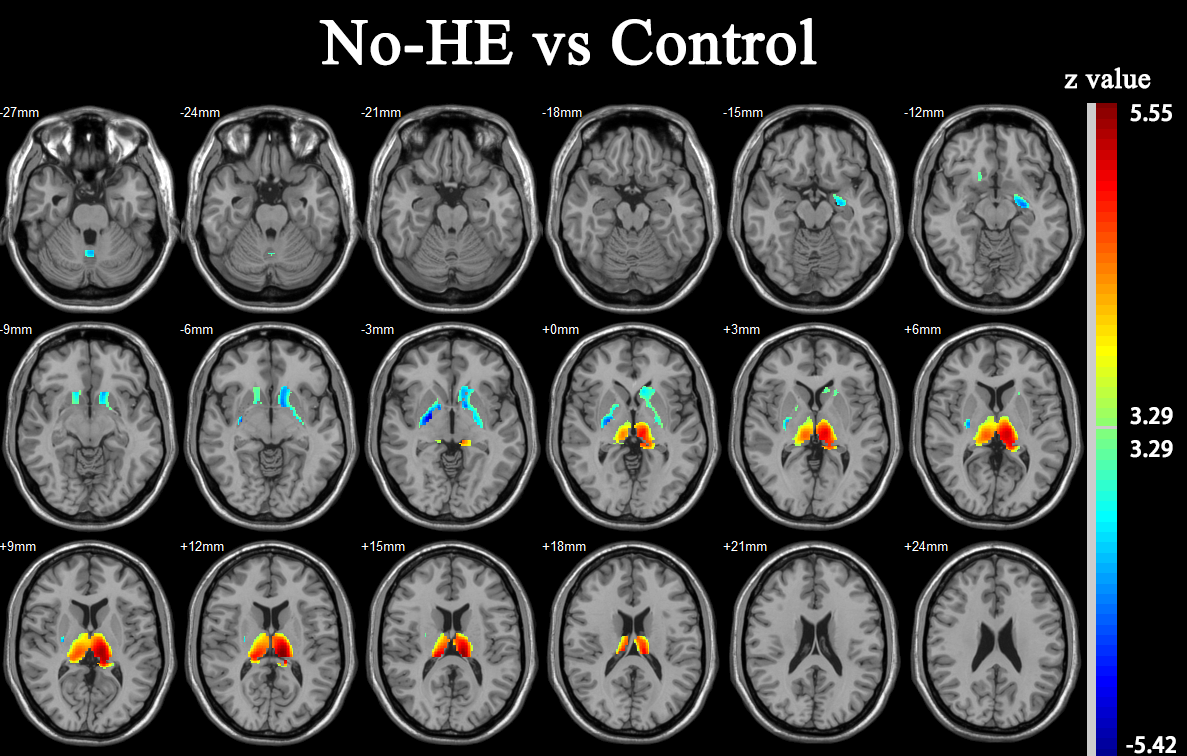
Figure. 2
Z value map of post-hoc t test between No-HE group and control group. voxel P=0.001, cluster P=0.05/3, FWE corrected. Red indicates increased grey matter density in No-HE group compared with control group, while blue indicates decreased grey matter density.
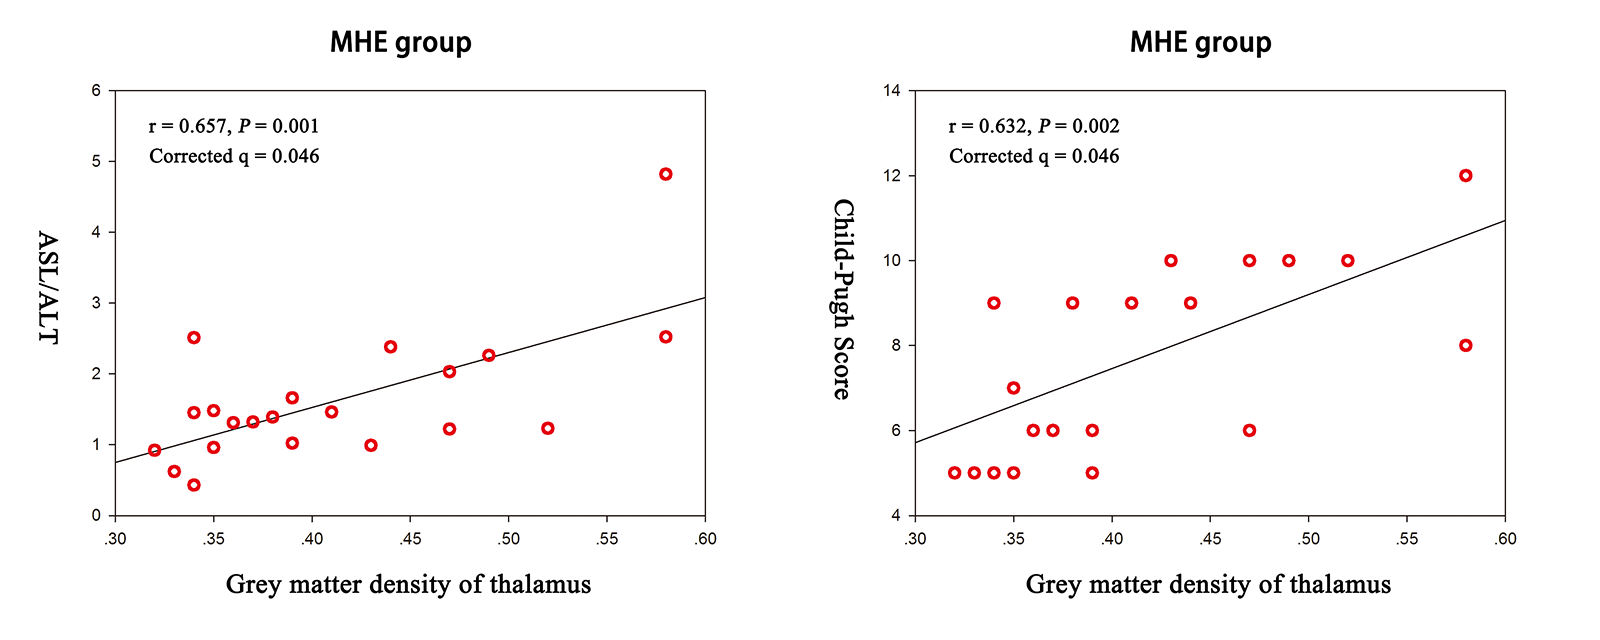
Figure. 3
Correlation analysis in MHE group, the scatter diagram indicates thalamus grey matter density correlates with the AST/ALT ratio and Child-Pugh score.
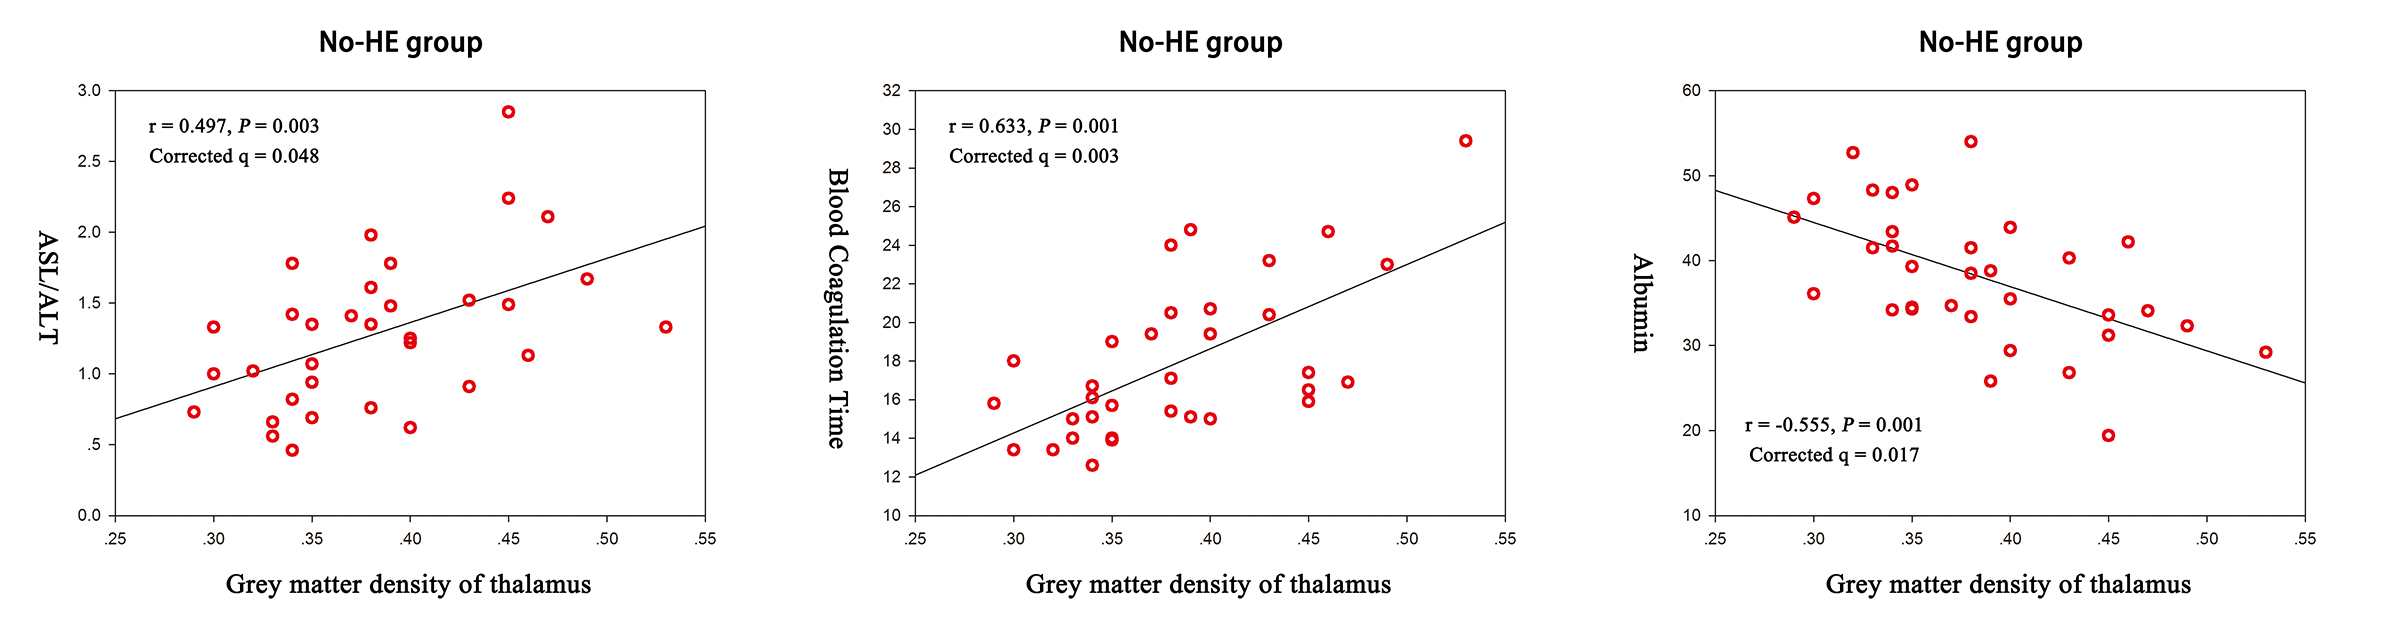
Figure. 4
Correlation analysis in No-HE group, the scatter diagram indicates thalamus grey matter density correlates with the AST/ALT ratio, Blood coagulation time and albumin level.