4157
Structural and Functional MRI Characterization of Trial Spinal Cord Stimulation Responders in Failed Back Surgery Syndrome1Biophysics, Medical College of Wisconsin, Milwaukee, WI, United States, 2Radiology, Medical College of Wisconsin, Milwaukee, WI, United States, 3Neuropsychiatric Institute and Medical School, Southeast University, Nanjing, People's Republic of China, 4Neurosurgery, Medical College of Wisconsin, Milwaukee, WI, United States
Synopsis
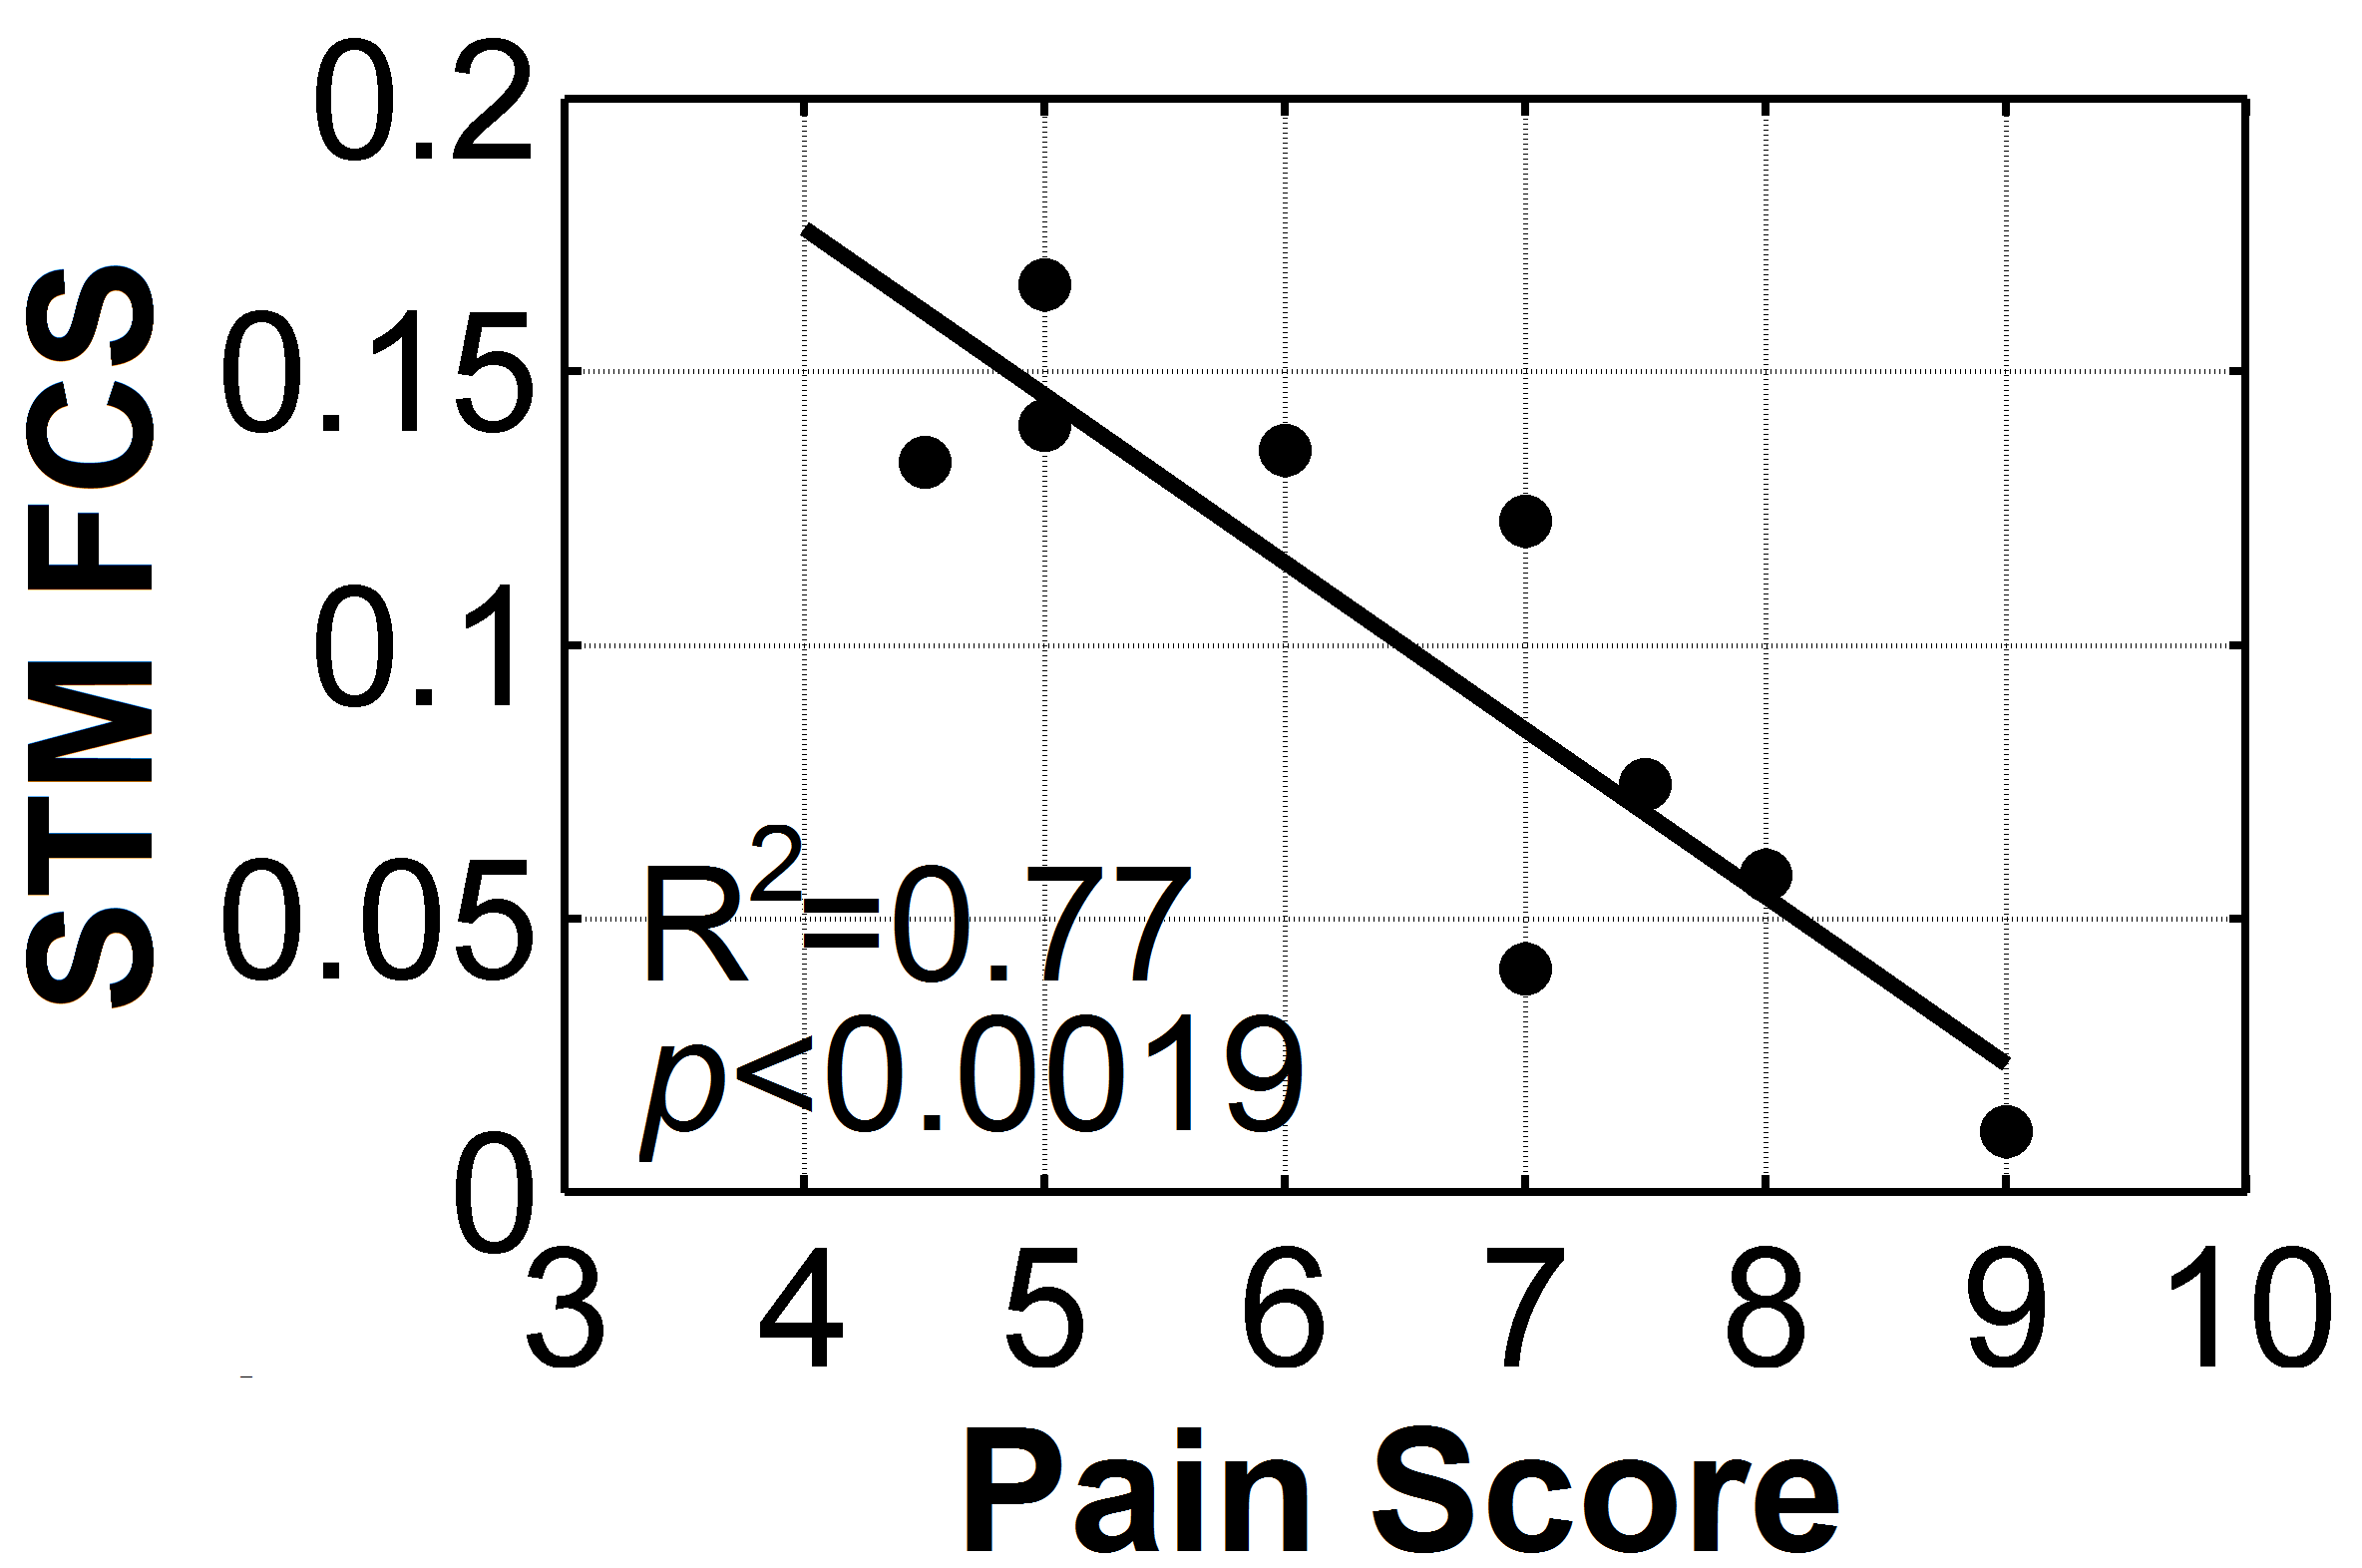
Chronic pain is an important and growing problem in aging populations. A key challenge to treating chronic pain is the absence of effective, objective methods of assessment. This study, from a homogeneous group of chronic pain patients with failed back surgery syndrome, demonstrated that the functional interaction strength between the limbic striatum and neocortex were very tightly correlated with the patients’ pain scores. We believe this index may form the basis for an objective, non-invasive biomarker for chronic lower back pain, and may be generalizable to other types of chronic pain.
Introduction
Chronic back pain is a burden to society and difficult to treat. Chronification of pain may involve structural and brain network connectivity changes that include transitions from somatomotorsensory to more emotionally related brain networks. Spinal cord stimulation (SCS) can be effective in treating failed back surgery syndrome (FBSS) patients. Despite responding successfully to a brief SCS trial (SCSr), 30%–50% of implanted patients fail to achieve satisfactory long-term pain relief. Improved pain control may be achieved with alternate, bursting patterns of SCS, which may preferentially affect emotional components of chronic pain. Our goal is to begin to utilize functional imaging to help guide SCS management.Methods
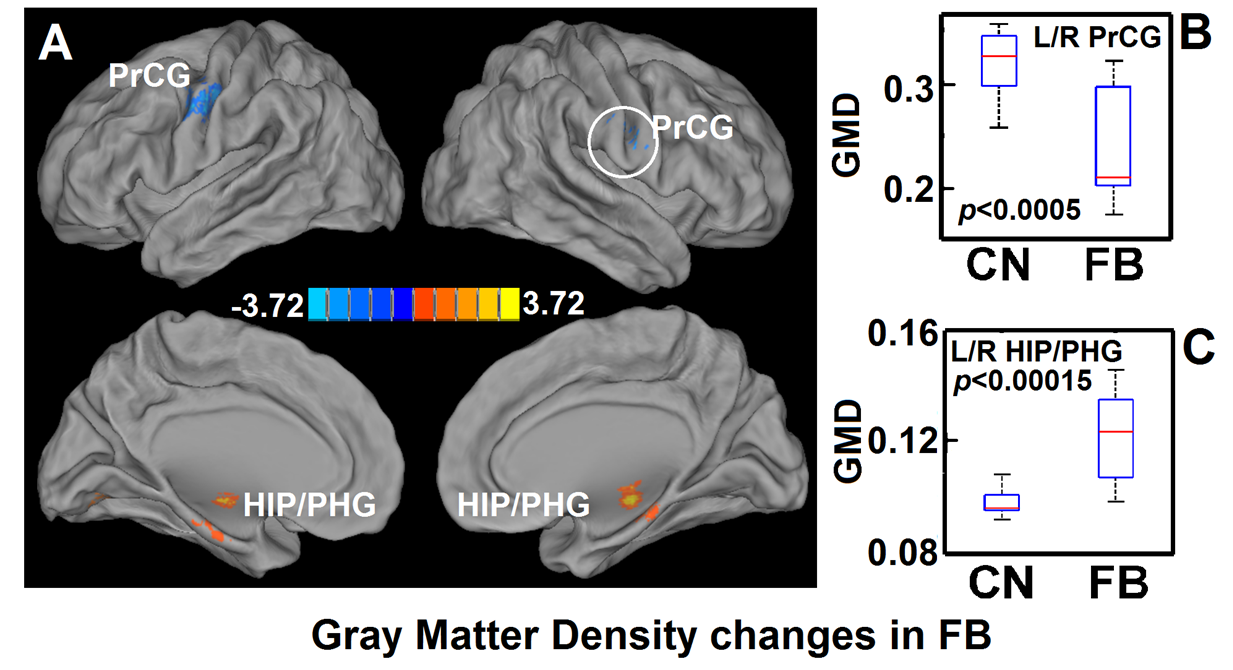
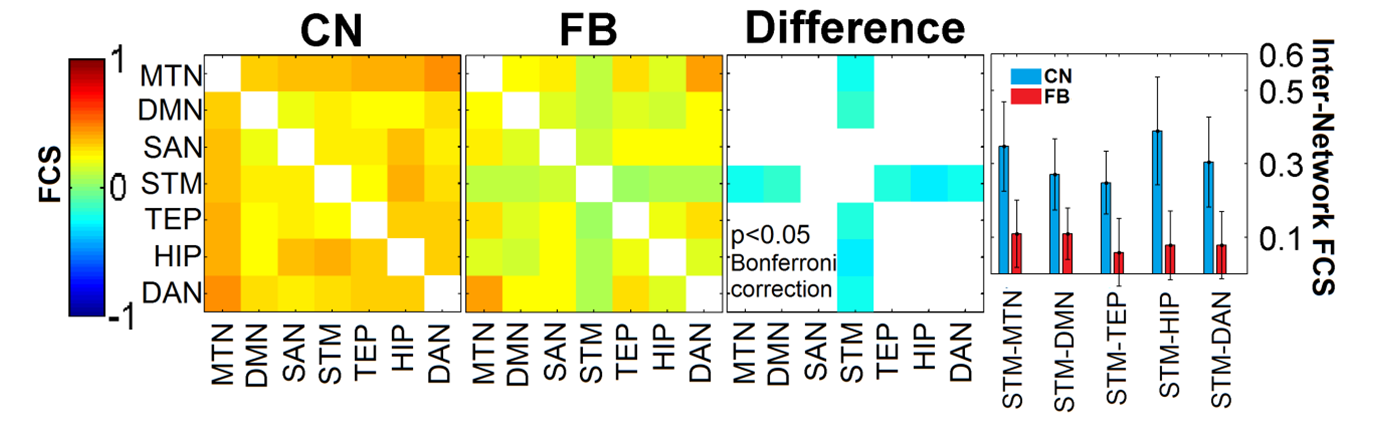
Subjects and Imaging: Prior to SCS permanent implant, anatomical and resting-state functional connectivity MRI were performed on 10 SCSr FBSS patients. Twelve age-matched controls without implants were included in the imaging study. Structural Image Analysis: Gray matter density (GMD) was calculated using the voxel-based morphometry (VBM) [1] toolbox in matlab with SPM8. Nonparametric, two-sample t-test was performed between two groups using the FSL randomise program [2] with 5000 randomized permutations. Resting-State Functional Network Definition: A total of seven resting-state networks (RSN) were analyzed: motor network (MTN), default mode network (DMN), salience network (SAN), striatum network (STM), temporal network (TEP), hippocampus network (HIP), and dorsal attention network (DAN). The TEP and HIP networks are separated from the memory network because we found that hippocampal regions had significant GMD changes in the FBSS group (Fig. 1A). Reginal Functional Connectivity (RFC): The regional functional connectivity strength is calculated by the Pearson correlation coefficient between the blood-oxygen-level-dependent time series from two brain regions for each subject. The time series for each region in each subject was obtained by averaging the time series of all voxels within that region. Internetwork Functional Connectivity Strength (FCS): The internetwork FCS between networks A and B were produced by the summation of all possible RFCs between brain regions Ai and Bi, which belong to networks A and B, respectively. Statistical Analysis for Internetwork FCS: The Wilcoxon signed-rank test was performed to test the group difference of each internetwork FCS. A multiple comparison correction was performed using the Bonferroni method with p<0.05 to avoid false positives. We applied a within-group linear regression model to test the relationship between the STM FCS and the pain score for FBSS subjects. The STM FCS was determined by summing the internetwork FCSs between STM and all other six networks.Results
Significantly decreased GMD in the bilateral precentral gyri (Figs. 1A,B) and increased GMD in the HIP/PHG areas (Figs. 1A,C) were found in the SCSr FBSS group. The internetwork FCS of STM-MTN, STM-DMN, STM-TEP, STM-HIP, and STM-DAN were significantly (p<0.05 Bonferroni corrected) decreased in the FBSS group compared to the normal group (Fig. 2). The FCS of STM was negatively correlated with the pain scores (Fig. 3), with (R2=0.77 p<0.0019).Conclusions
This study is the first ever to report that, in SCSr FBSS patients, decreased FCS between the striatum and other functional networks is inversely correlated with pain scores, which may reflect the mechanisms of pain chronification. The finding of increased HIP GMD in these patients is consistent with previous reports in animals [3] and humans [4] of hippocampal neurogenesis with persistent pain.Acknowledgements
No acknowledgement found.References
1. Ashburner J. (2009). Computational anatomy with the SPM software. Magn Reson Imaging. 27(8):1163–74.
2. Winkler AM, Ridgway GR, Webster MA, Smith SM, Nichols TE. (2014). Permutation inference for the general linear model. Neuroimage. 92:381–97.
3. Apkarian AV, et al. (2016). Role of adult hippocampal neurogenesis inpersistent pain. Pain. 157:418–28.
4. Smallwood RF, et al. (2013). Structural brain anomalies and chronicpain; a quantitative metaanalysisof gray matter volume. J Pain. 14(7): 663–75.
Figures