4155
Reorganization of Brain Connectivity in the Speech and Language Network in the Non-fluent variant of PPA1Memory and Aging Center, Neurology, University of California, San Francisco, San Francisco, CA, United States, 2Memory Unit, Department of Neurology, Hospital de la Santa Creu i Sant Pau - Biomedical Research Institute Sant Pau – Universitat Autonoma de Barcelona, Spain, 3Fundació ACE, Alzheimer Research Center, Institut Català de Neurociències Aplicades, Barcelona, Spain Cognition and Brain Plasticity Group, Bellvitge Biomedical Research Institute, Barcelona, Spain
Synopsis
Graph theory analysis is a method recently introduced to study the brain as a network. In this study we investigate the topological distribution of the speech and language functional network in nfvPPA patients characterized by isolated and progressive language impairments. We identified the hubs of the speech and language network in healthy controls and nfvPPA. In patients, the network presented an abnormal topological distribution where right-sided brain regions were recruited. These findings suggest that in nfvPPA this network reorganizes in the presence of localized gray matter volume loss.
Purpose
Our aim was to elucidate interactions and reorganization of large-scale speech and language networks in patients with non-fluent/agrammatic variant primary progressive aphasia (nfvPPA). This neurodegenerative disorder is an important model for mapping reorganization because it is characterized by isolated and progressive speech and language impairments with anatomical damage in specific regions: the inferior frontal gyrus (IFG), dorsal insula, supplementary motor area (SMA), striatum, inferior parietal and temporal regions1,2. These regions support speech and language functions and are functionally and structurally linked in the healthy brain. While these regions are structurally and functionally damaged in nfvPPA, what is currently unsolved is whether and how this network re-organizes itself with a different topology to address this damage. We employ graph theory, a recently-introduced mathematical method, to investigate brain architecture using network models3.Methods
Task-free functional MRIs were acquired with a 3T Siemens Trio at UCSF in 20 patients with nfvPPA and 20 matched healthy controls. Images were acquired using T2*-weighted echo-planar sequence including 240 volumes with 36 AC/PC-aligned axial slices in interleaved order (slice thickness = 3 mm with 0.6 mm gap; field of view = 230 x 230 mm; matrix = 92 x 92; TR = 2000 ms; TE = 27 ms; flip angle = 80°). Image processing was performed as previously described4. Seed-based connectivity analysis was conducted in the group of healthy controls to extract the speech and language network, with the seed in the left pars opercularis of the IFG (IFG op). The whole network was divided into 110 spheres with 3.5 mm of radius to represent the nodes of the network. Association matrices (based on functional connectivity strength) were derived from the Z score of Pearson correlations between each pair of nodes selected. These matrices were then thresholded to produce binary adjacency matrices at thresholds ranging from 0 to 0.2 with a 0.01 increment. All network-metrics were obtained by integrating the thresholds considered overall. For each group-network (controls and nfvPPA), we identified the most highly connected regions (hubs) by calculating nodal parameters such as number of links connected to a node (degree) and the fraction of all shortest paths that pass through a node (betweenness centrality). A node was defined as a hub if any of the two nodal parameters was at least 1 standard deviation higher than the average of the corresponding measure over the entire network. We also calculated global network parameters such as global efficiency and assortativity. The network analyses were performed with the Brain Connectivity toolbox5.Results
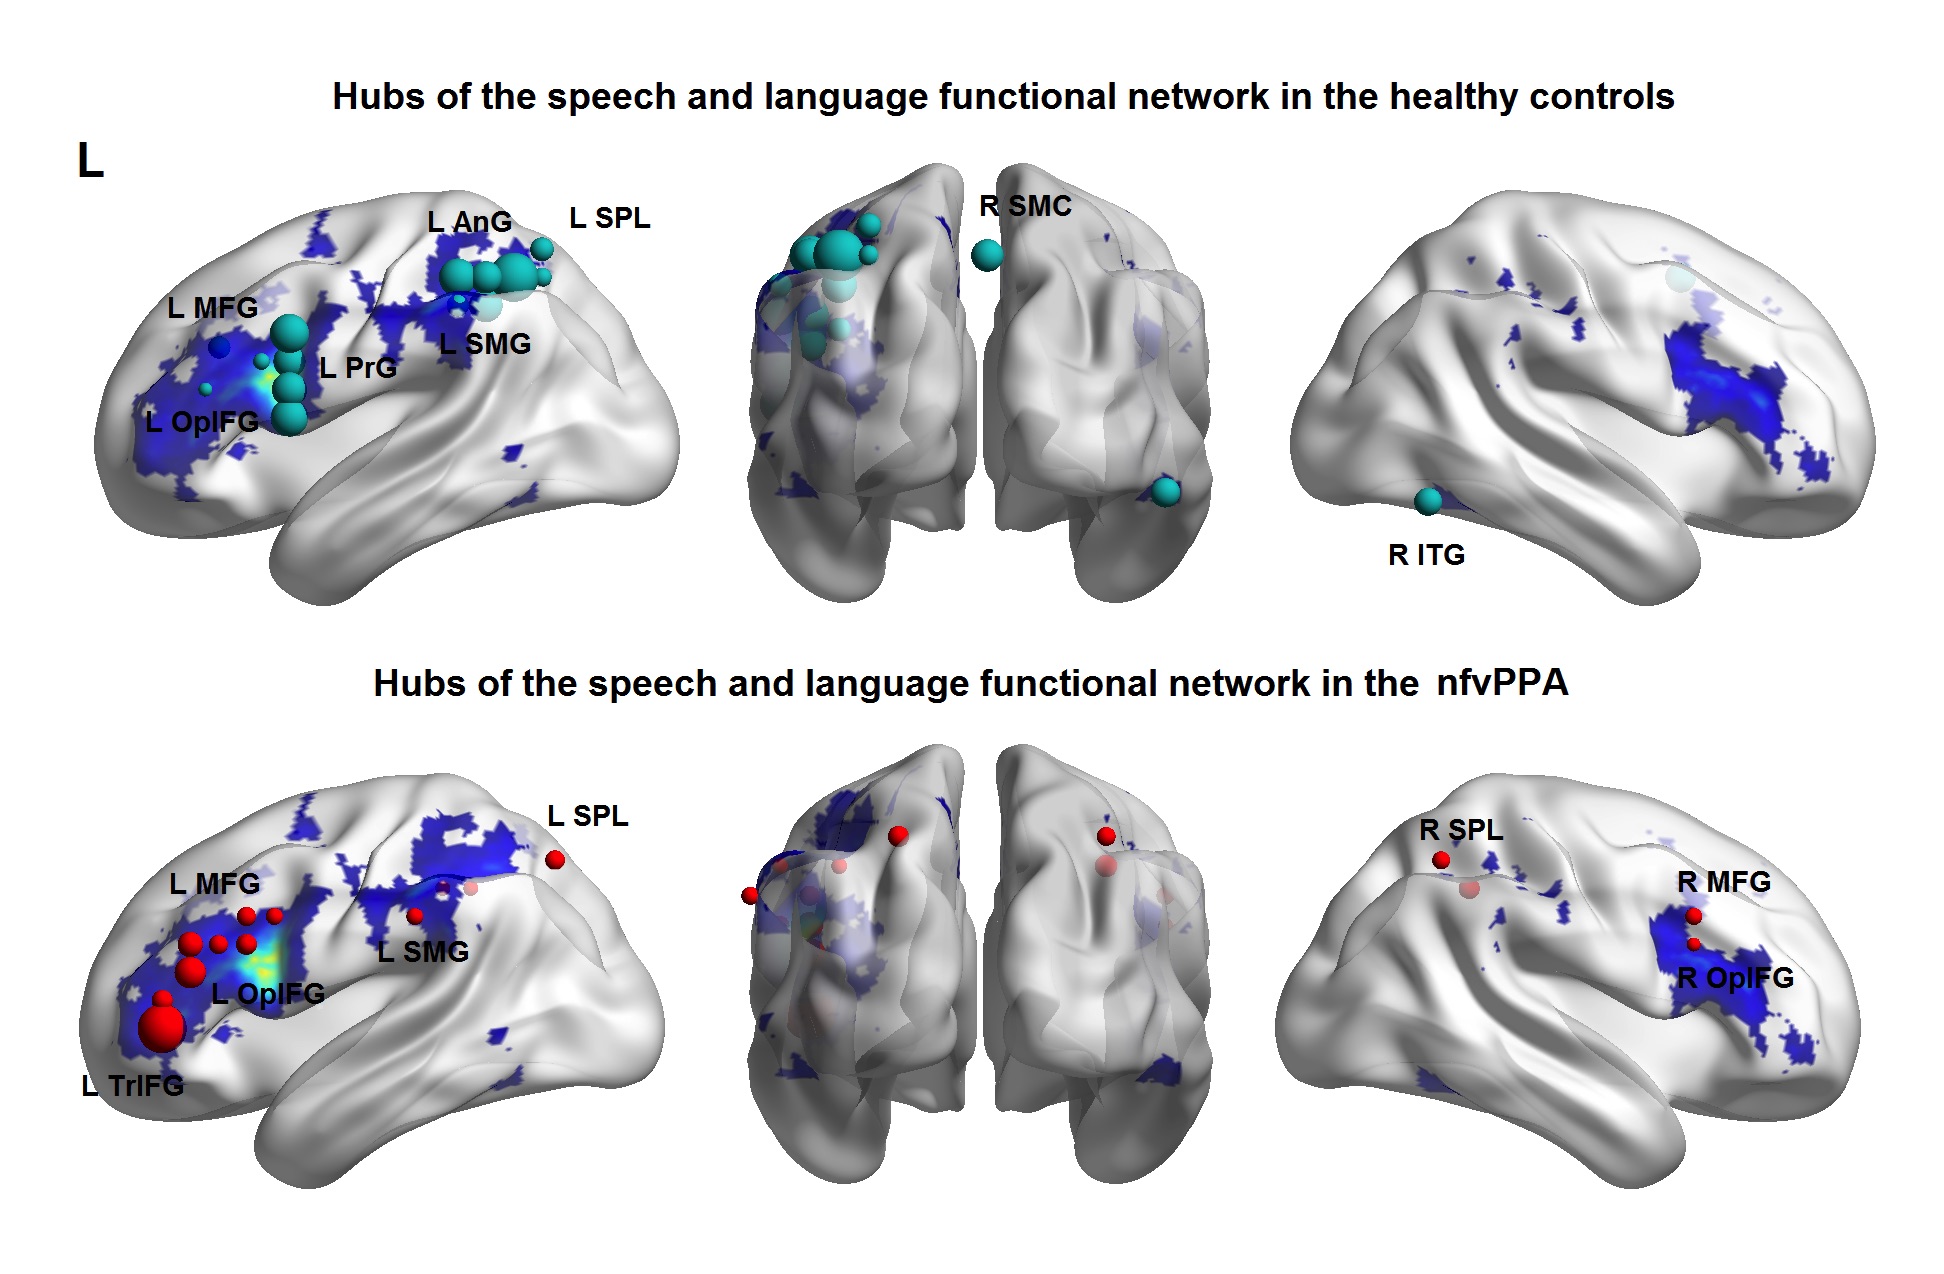
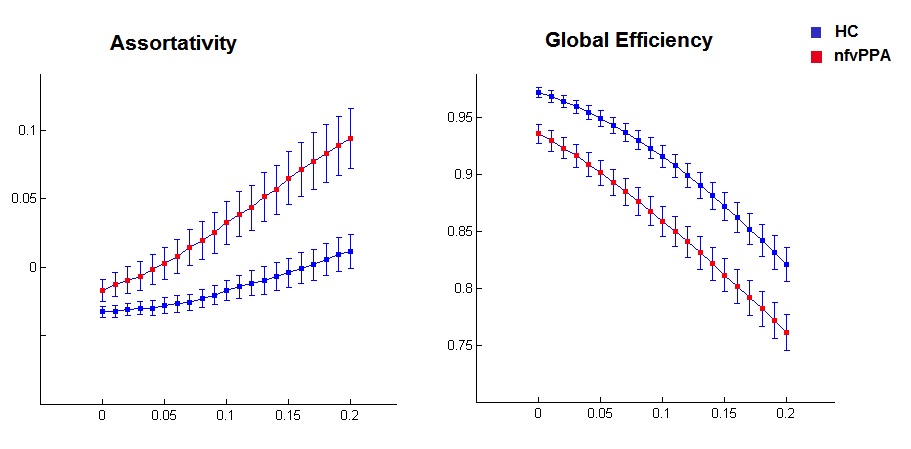
The speech and language functional network anchored in the IFG op in healthy controls has been previous published4 and showed connected regions bilaterally in the inferior, middle and superior frontal gyri, precentral cortex, supplementary motor, superior and inferior parietal lobule, middle/inferior temporal gyrus, anterior dorsal insula, and striatum. Graph theory analysis within this network revealed hubs in the left IFG op, precentral gyrus, middle frontal gyrus (MFG), superior parietal lobule (SPL), angular and supramarginal gyri, right SMA and right inferior temporal gyrus in the healthy controls (Figure 1). On the other hand, in the nfvPPA group, our analysis revealed a loss of hubs in the left precentral gyrus, right SMA, and in the right inferior temporal gyrus and added hubs in right-sided regions such as IFG, MFG and SPL (Figure 1). Global efficiency was significantly reduced across the range of thresholds (0.0 < thre < 0.2, 0.001 < P < 0.009) and assortativity increased (0.05 < thre < 0.2, 0.04 < P < 0.004) in nfvPPA compared to controls (Figure 2).Discussion
Our findings showed a general dysfunction within the speech and language network in nfvPPA characterized by a decrease of global efficiency, increased assortativity and loss of hubs in the left side of the brain. This suggests that the network’s hubs become abnormally clustered with high degree nodes that tend to connect to other nodes with the same high degree (assortative network) but are less efficiently wired6. On the other hand, the recruitment of right-side brain hubs in nfvPPA may suggest that the network reorganizes itself in regions less affected by gray matter volume loss.Conclusion
Graph theory can be a useful tool to investigate functional abnormalities at the level of large-scale networks. Disruption of particular network hubs may help to explain syndromic presentations.Acknowledgements
The study was supported by grants from the National Institutes of Health (NINDS R01 NS050915, NIA P50 AG03006, NIA P50 AG023501, NIA P01 AG019724, K24 DC015544); State of California (DHS04-35516); Alzheimer's Disease Research Centre of California (03–75271 DHS/ADP/ARCC); Larry L. Hillblom Foundation; John Douglas French Alzheimer's Foundation; Koret Family Foundation; Consortium for Frontotemporal Dementia Research; and McBean Family Foundation and a Career Scientist Award (NFD) from the US Department of Veterans Affairs Clinical Sciences R&D Program.References
1. Grossman M, Mickanin J, Onishi K, et al. Progressive nonfluent aphasia: language, cognitive, and pet measures contrasted with probable Alzheimer's disease. J Cogn Neurosci. 1996; 8:135–54.
2. Gorno-Tempini ML, Ogar JM, Brambati SM, et al. Anatomical correlates of early mutism in progressive nonfluent aphasia. Neurology. 2006; 67:1849–51.
3. Sporns O. Networks of the Brain. 2009.Cambridge MA, USA: The MIT Press
4. Mandelli ML, Vilaplana E, Brown JA, et al. Healthy brain connectivity predicts atrophy progression in non-fluent variant of primary progressive aphasia. Brain. 2016; 139(10):2778-2791.
5. Rubinov M, Sporns O. Complex network measures of brain connectivity: Uses and interpretations. NeuroImage. 2010; 52:1059-69.
6. Newman, M.E. Assortative mixing in networks. Phys. Rev. Lett. 2002; 89, 208701.
Figures