4148
Altered Dynamic Functional Connectivity State Patterns of Patients with Idiopathic Parkinson’s Disease1Radiology, Ruijin Hospital,Shanghai Jiao Tong University School of Medicine, Shanghai, People's Republic of China, 2Center for Advanced Neuroimaging, University of California, Riverside, Riverside, CA, United States, 3Department of Biomedical Engineering, Georgia Institute of Technology and Emory University, Atlanta, GA, United States, 4Center for Advanced Neuroimaging, University of California, Riverside, Riverside, Riverside, CA, United States, 5MR Research, GE Healthcare, Shanghai, People's Republic of China, 6Department of Bioengineering, University of California, Riverside, Riverside, Riverside, CA, United States
Synopsis
Parkinson’s disease (PD) is a neurodegenerative disorder characterized by nigral-striatal dopamine deficiency and motor symptoms. Neuroimaging studies have shown that functional connectivity within cortical-striatal networks and related connections are disturbed in PD. But these are based on conventional static resting-state analyses which assume functional connectivity being static over time. Recent studies have demonstrated that resting state brain activity is highly dynamic. In this work, we applied Gaussian Hidden Markov Model to investigate dynamic functional connectivity in PD and compared it with that in normal controls. Our results show alterations in sensorimotor, DMN, and visual networks in PD.
Introduction
Parkinson’s disease (PD) is a progressive neurodegenerative movement disorder affecting 1% of the adult population over the age of 65. Nigral-striatal dopamine deficiency is a hallmark of PD and is thought to cause wide-spread brain network alterations centered in cortical-striatal and sensorimotor regions. Resting-state functional MRI (rs-fMRI) can measure these alterations and has revealed changes in sensorimotor, visual, and default mode (DMN) networks in PD[1-3].
rs-fMRI studies utilized methods assuming that functional connectivity is static but there is mounting evidence that functional connectivity is dynamically changing over time. Hence, the conventional static rs-fMRI approaches may not fully characterize the dynamic nature of brain connectivity, which is thought to be critical to cognition and behavior[4]. Here, we apply a Gaussian hidden Markov model (GHMM), as described previously[5], to investigate the spatial-temporal dynamics of functional connectivity arising from PD. This approach may provide new insights into the neurobiological underpinnings of PD.
Methods
Participants
Twenty-three idiopathic PD patients were recruited from Ruijin Hospital. PD diagnosis was determined using the UK Brain Bank criteria. Exclusion criteria were as follows: (1) Mini-Mental State Exam (MMSE) score less than 24; (2) a history of other neurological diseases. Sixteen gender- and age-matched healthy controls with normal neurological status also participated in this study. All subjects provided written informed consent for participation.
Data Acquisition
MRI scanning was performed on a 3-Tesla MR system (Signa HDxt, GE) equipped with an eight-channel phased array head coil. Rs-fMRI was acquired using an echo planar imaging (EPI) sequence, and the participants were explicitly instructed to keep their eyes closed, remain awake, , and move as little as possible. The parameters for EPI sequence were as follows: TR=2000ms, TE=30ms, axial slices=37, acquisition matrix=64×64, field of view=256mm, flip angle=90°, thickness=4mm, and scanning time=14min). Three-dimensional T1-weighted images (TR/TE=5.52ms/1.724ms, acquisition slices=196, matrix=256×256, FOV=256mm, flip angle=12°, slice thickness=1mm) were acquired for spatially normalizing the functional images.
fMRI data processing
rs-fMRI data were pre-processed using Statistical
Parametric Mapping-8. For each subject, the
first 10 volumes of data were discarded. Standard preprocessing steps (slice
time correction, motion correction, regressing out nuisance signals,
normalization, smoothing with a 4 mm Gaussian filter, and detrending) were
performed on the data. Time courses from 236 regions of interest were
extracted. The mean value of each time course was subtracted and the standard
deviations were normalized to 1. Upon normalization, a sequential modeling
tool, GHMM, was applied to analyze these time courses, as described in [5].
Results
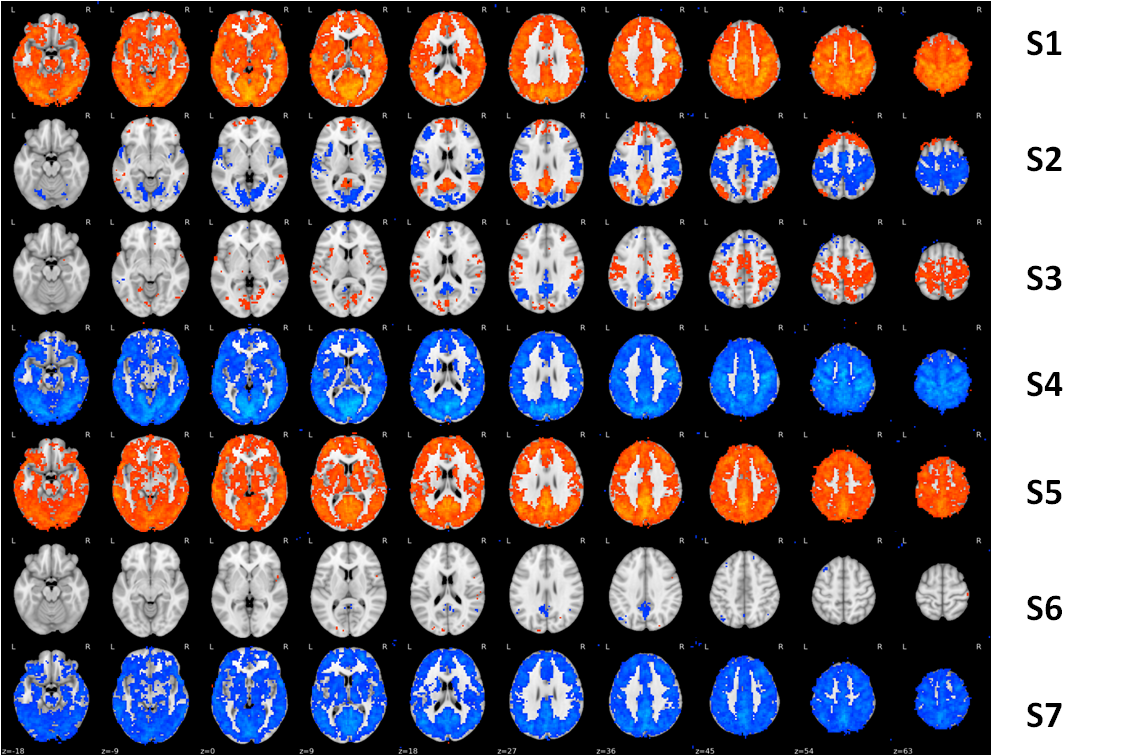
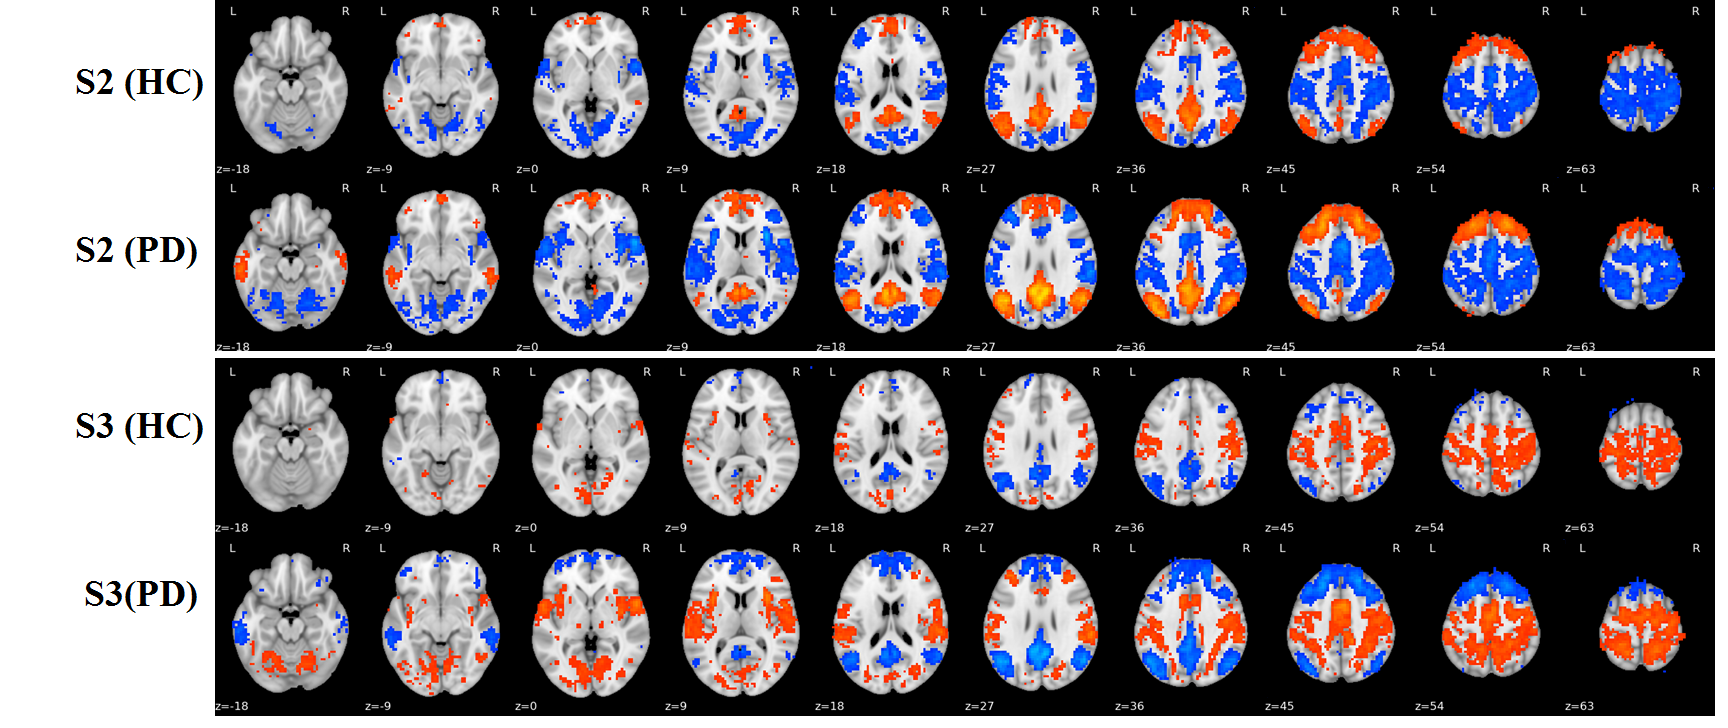
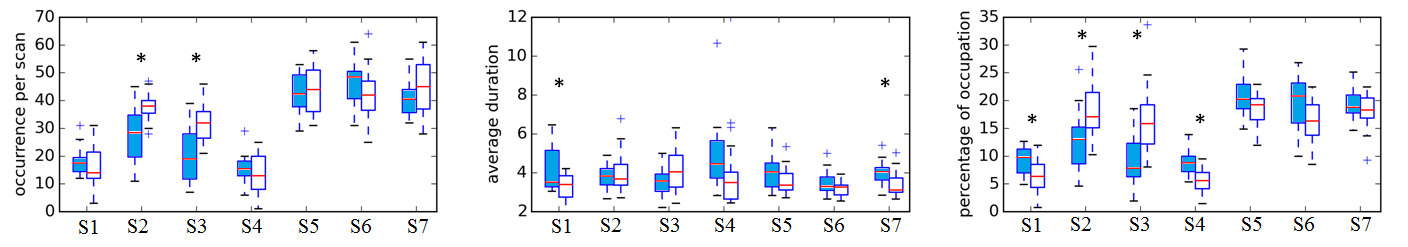
From the 264 ROIs, 7 stable and highly reproducible brain states were detected independently in both cohorts, denoted as S1-S7 in the order of descending stability and are shown in Figure 1. Activation (S1, S3, and S5) and deactivation (S2, S4, and S7) in sensorimotor network were higher in PD than in controls (results in S2 and S3 were shown in Figure 2). Elevated activation (S1 and S5) and deactivation (S4 and S7) were found in the posterior-DMN and visual networks of PD patients. Furthermore, both the occurrence per scan and the percentage of occupation of S2 (DMN and PFC activation, sensorimotor and visual network deactivation) and S3 (DMN and PFC deactivation, sensorimotor and visual networks activation) were found to be higher in PD (Figure 3), while the duration of S1, S4, and S7 was decreased in PD (Figure3).Discussion
We applied a dynamic FC analysis approach and independently identified 7 highly reproducible FC states in our cohorts of PD patients and matched controls. Our results suggest that patients with PD exhibit alterations within sensorimotor, posterior-DMN, and visual networks and show different dynamic characteristics in the corresponding states from controls. These results are partly corroborated by prior PD studies[1,3,6]. The finding of altered sensorimotor network in PD is consistent with the hallmark motor symptoms in PD and supported by previous studies[6]. Our results of changes in the dynamics of the DMN are also consistent with the disruption of DMN in PD patients reported by functional imaging studies[1].Conclusion
This study revealed changes in the resting-state dynamics of the sensorimotor and DMN networks, providing a possible neurobiological basis for motor and executive impairments in PD. Characterization of dynamic FC provides an additional vehicle for studying PD.Acknowledgements
XH and JL are supported in part by the Michael J. Fox Foundation (MJF 10854). The study was supported in part through State Key Clinical Department of Medical Imaging.References
1. van Eimeren, T., Monchi, O., Ballanger, B., & Strafella, A. P. (2009). Dysfunction of the default mode network in Parkinson disease: a functional magnetic resonance imaging study. Archives of neurology, 66(7), 877-883. 2. Tessitore, A., Amboni, M., Esposito, F., Russo, A., Picillo, M., Marcuccio, L., ... & Barone, P. (2012). Resting-state brain connectivity in patients with Parkinson's disease and freezing of gait. Parkinsonism & related disorders, 18(6), 781-787. 3. Wu, T., Wang, L., Chen, Y., Zhao, C., Li, K., & Chan, P. (2009). Changes of functional connectivity of the motor network in the resting state in Parkinson's disease. Neuroscience letters, 460(1), 6-10. 4. Hutchison, R. M., Womelsdorf, T., Allen, E. A., Bandettini, P. A., Calhoun, V. D., Corbetta, M., ... & Handwerker, D. A. (2013). Dynamic functional connectivity: promise, issues, and interpretations. Neuroimage, 80, 360-378. 5. Chen, S., Langley, J., Chen, X., & Hu, X. (2016). Spatiotemporal Modeling of Brain Dynamics Using Resting-State Functional Magnetic Resonance Imaging with Gaussian Hidden Markov Model. Brain connectivity, 6(4), 326-334. Donzuso, G. (2015). Sensorimotor connectivity in Parkinson’s disease: the role of functional neuroimaging. Levodopa-induced Dyskinesias in Parkinson’s Disease: Current Knowledge and Future Scenarios, 47.Figures