4146
Characterizing diffusion MRI based structural connectome of the human brain in Parkinson’s disease1Electronics and Telecommunication, Symbiosis Institute of Technology, pune, India, 2Department of Neurology, NIMHANS, Banglore, 3Department of Neurology, NIMHANS, Banglore, India
Synopsis
This study aims at assessing the large scale structural network changes in Parkinson’s disease. The structural connectome is computed using probabilistic fiber tracking on diffusion MRI between 95 regions of interest. Graph theoretic analysis on the connectome is carried out at several levels of granularity: global, local (nodal) and lobar. We find that patients with PD demonstrate lower network clustering capability and lower neural connectivity as well as significantly reduced nodal influence of the hippocampus. Additionally, widespread patterns of reduced connectivity are observed in the temporal and occipital areas. These deficits could potentially mark the non-motor symptoms indicated in PD.
Background and Objective
In Parkinson’s disease (PD), a neurodegenerative disorder of the motor system, diffusion MRI has demonstrated deficits in anisotropy as well as increased diffusivity in the sub-cortical structures, primarily in the substancia nigra.1 However, PD is not limited to motor deficiencies but also presents non-motor symptoms such as depression, psychosis, olfactory dysfunction and cognitive impairment.2 These non-motor symptoms underscore PD as a multi-systemic disorder emerging from dysfunction of several network components. Therefore, to decipher the underlying neuropathology it is crucial to employ novel network based methods that can elucidate associations between specific network changes. Advances in fiber tractography with diffusion MRI can be utilized to compute a structural connectome (SC) which facilitates understanding of complex interactions among brain regions. The goal of this study is to characterize the structural connectome (SC) in PD and using several topological measures at global, local and lobar levels.Methods
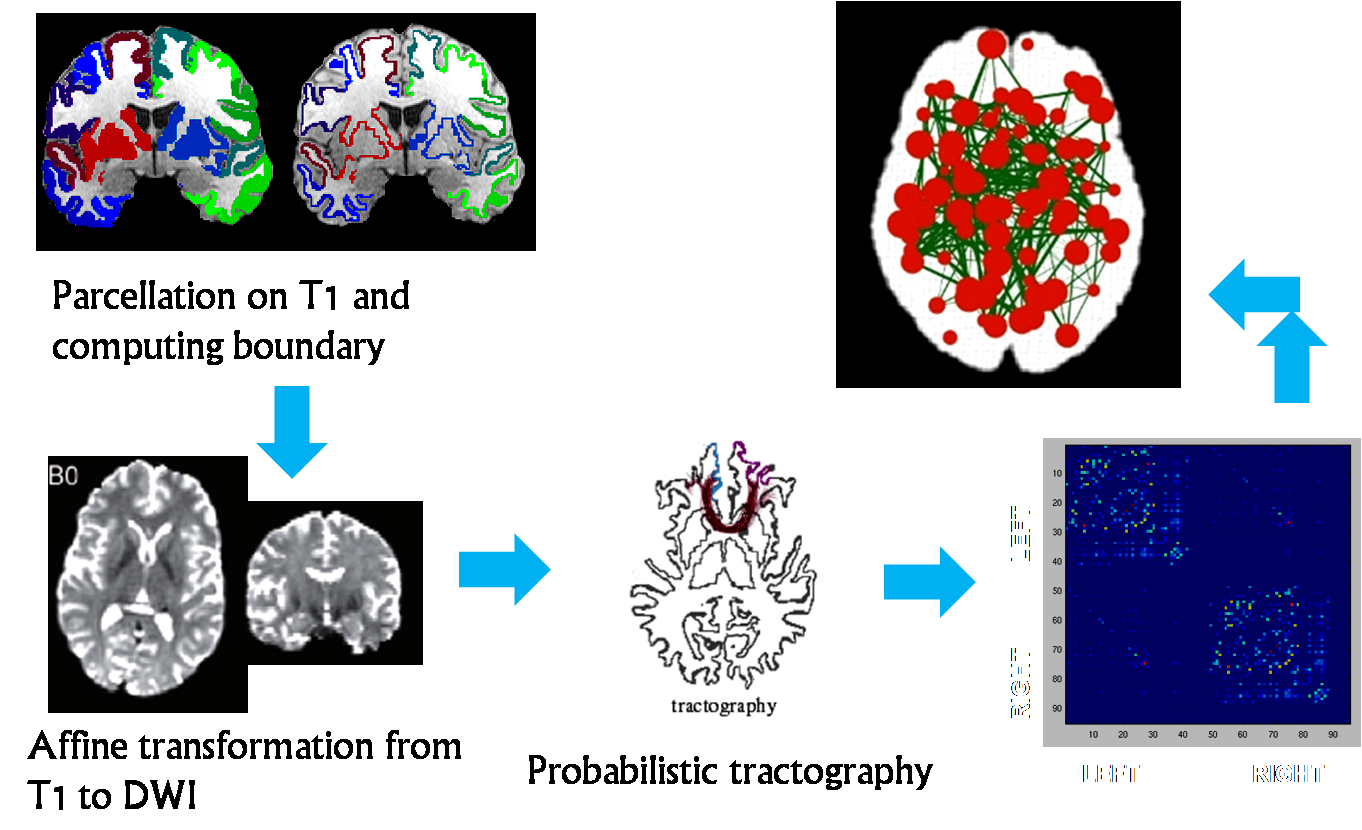
Our data consisted of 65 controls (age 49.8 ± 9.04, 53 Males) and 65 PD patients (age 52.8±10.5, 51 Males) with mean UPDRS scores of 18.53 ± 8.83 that fulfilled the standard criteria for PD diagnosis (OFF state). All the patients were screened for the presence of cognitive impairment using MMSE and a score of <26 was set as an exclusion criteria. These subjects were scanned on a 3T Philips AcheivaTM scanner with a 32 channel head coil. DTI was performed along 15 directions with a b-value of 1000s/mm2 in addition to b=0 s/mm2. 3D T1TFE images were acquired with TR/TE = 8.1/3.7 ms and voxelsize =1 x 1 x 1 mm. For creating the structural connectome (figure 1), cortical parcellation and sub-cortical segmentation was obtained using Freesurfer 3 on structural T1 images and a total of 95 ROI's were extracted to represent the nodes of the structural network that include 68 cortical regions and 27 subcortical structures. The quality of the parcellation was manually checked for each subject and then transferred to the diffusion MRI space using an affine transform. To calculate the edges of the graph, probabilistic fiber tracking 4 on the diffusion MRI was performed by seeding each node and then computing the number of fibers that reached every other node. The edge strength therefore indicates the number of fibers traveling between the two nodes.5 We obtained a 95*95 connectome for each subject which is a symmetric matrix with zero diagonal (no self connections). These connectomes were analyzed at several levels of granularity including macroscopic (global), local and lobar features. The global features involved computing network density, clustering coefficient, global efficiency and modularity. Nodal measures of degree, strength, local efficiency and centrality were computed while lobar participation of each node was calculated using participation coefficients (PC). For each measure an ANCOVA model was utilized to examine the group differences while accounting for age. Subsequently, a False Discovery Rates (FDR) 6 based correction was employed to account for multiple comparisons.Results
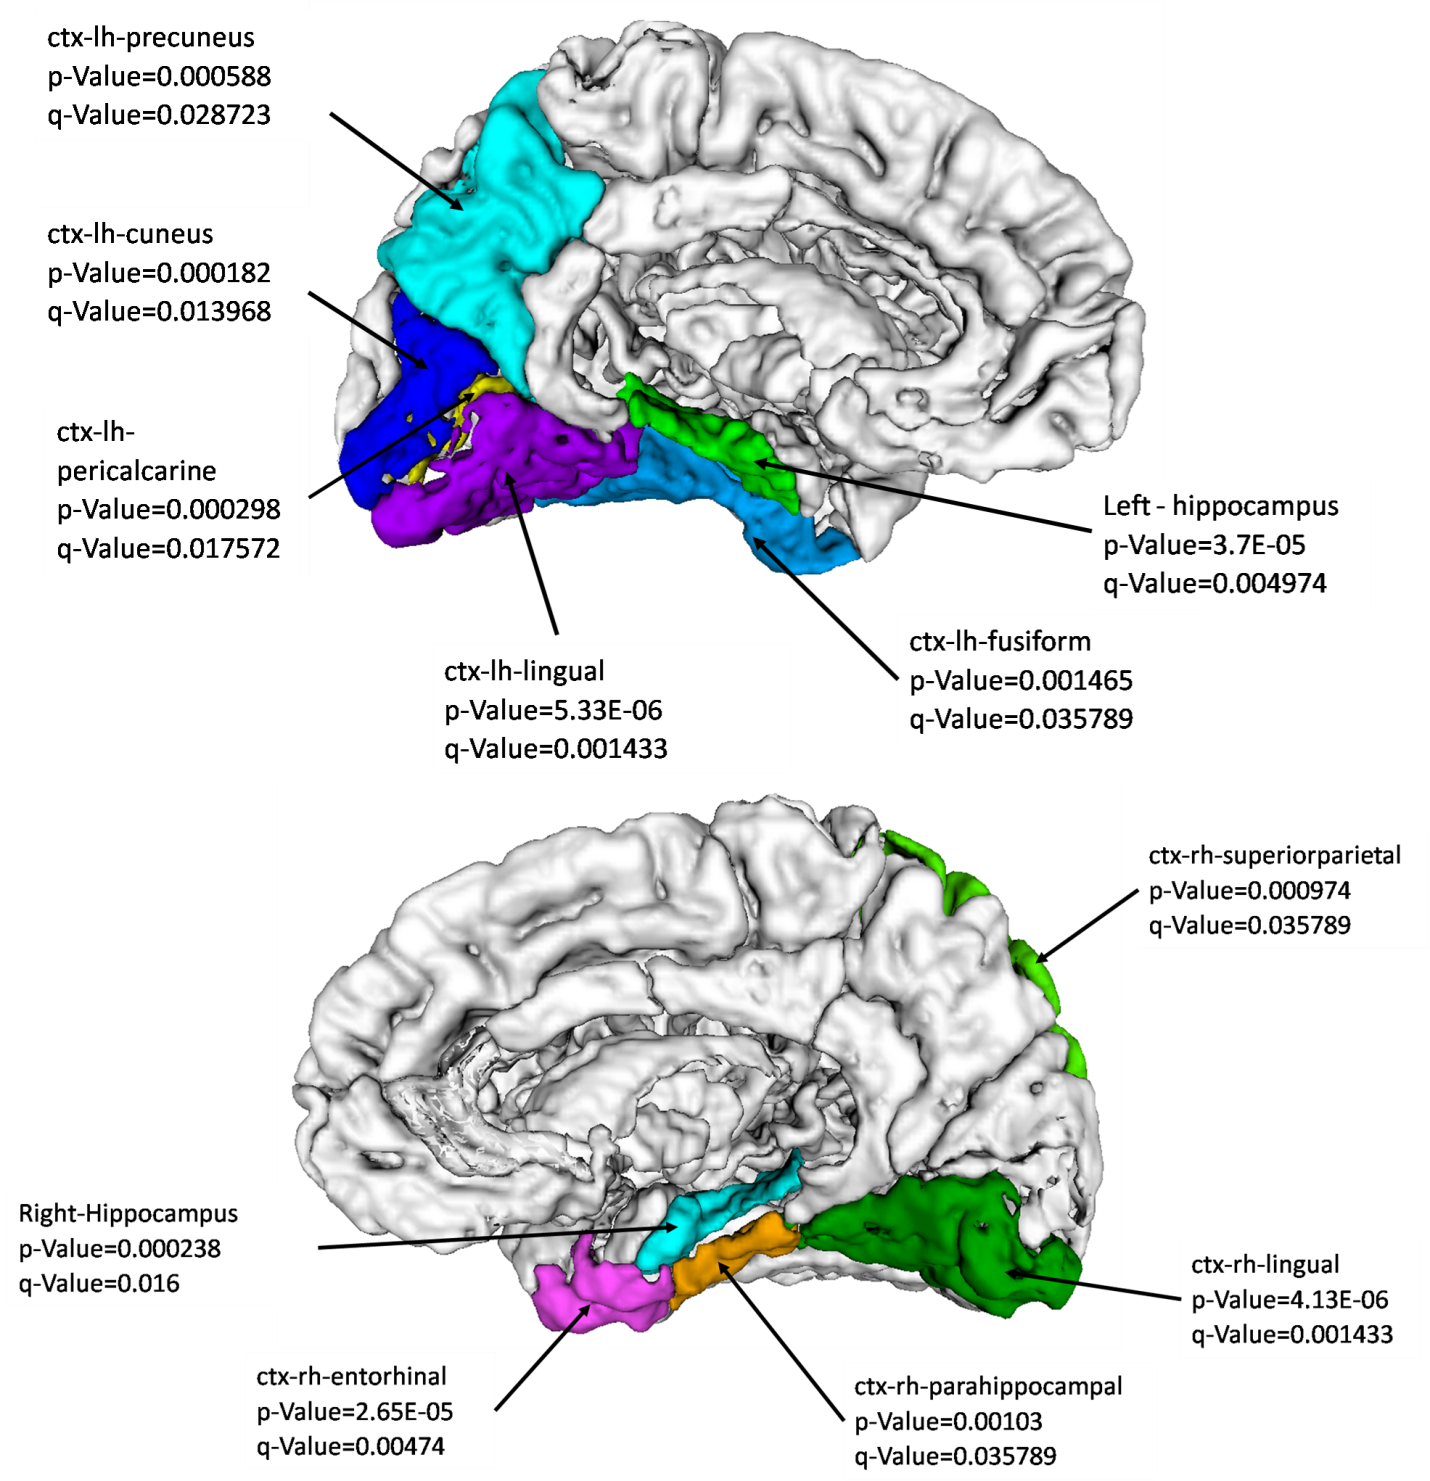
At the global network level, the clustering coefficient was significantly higher in controls when compared to the patients (p-value = 0.03). At the nodal level, figure 2 shows the nodes with significantly higher nodal strength in controls (q-value < 0.05). These nodes include hippocampi, lingual area, right entorhinal, right parahippocampal and superiorparietal, left pericalcarine and precuneus. Controls demonstrated significantly high local efficiency (p-value = 0.0013, q-value =0.035) in the hippocampus. Lobar PCs demonstrated significant differences in the hippocampi ( left p-value =0.0008, q-value =0.03, right p-value=0.001, q-value = 0.035) and left precuneus ( p-value =0.0011, q-value= 0.035) with higher PCs in controls than in patients.Discussion
The current study focused on investigating the SC of the brain in PD. At the global network level, PD patients displayed significantly reduced clustering coefficient as compared to controls, illustrating reduced capacity of network segregation in patients. At the nodal and lobar level, significantly lower neural connectivity and lower nodal influence of the hippocampus in PD was observed. Deficits in cognitive and working memory abilities are core dynfucntion of PD and can potentially be linked to lower hippocampal connectivity.7 Other areas of the brain that include entorhinal, lingual, parahippocampal, precunus and superiorparietal, left pericalcarine regions also demonstrated decreased connectivity in PD. Trends in decreased connectivity in PD in the regions in basal ganglia were observed however were not significant. In conclusion, we analyzed SCs of PD patients computed using 95 nodes and probabilistic fiber tracking and demonstrated widespread patterns of network abnormality in the PD brain.Acknowledgements
We would like to acknowledge BRAF-CDAC India for providing parallel computing servicesReferences
1. Pyatigorskaya, N., Gallea, C., Garcia-Lorenzo, D., Vidailhet, M., & Lehericy, S. A review of the use of magnetic resonance imaging in Parkinson’s disease. Therapeutic advances in neurological disorders. 2013, 1756285613511507
2. Schwarz, S. T., Abaei, M., Gontu, V., Morgan, P. S., Bajaj, N., & Auer, D. P. Diffusion tensor imaging of nigral degeneration in Parkinson's disease: a region-of-interest and voxel-based study at 3T and systematic review with meta-analysis. NeuroImage: Clinical.2013; 3, 481-488
3. Fischl B, Sereno MI, Dale AM Cortical surface-based analysis. II: Inflation, flattening, and a surface- based coordinate system. Neuroimage. 1999 ;9(2):195–207
4. Zhang, Y., et al., Diffusion tensor imaging of the nigrostriatal fibers in Parkinson's disease. Mov Disord. 2015; 30(9): p. 1229-36.
5. S.M. Smith, M. Jenkinson, M.W. Woolrich, C.F. Beckmann, T.E.J. Behrens, H. Johansen-Berg, P.R. Bannister, M. De Luca, I. Drobnjak, D.E. Flitney, R. Niazy, J. Saunders, J. Vickers, Y. Zhang, N. De Stefano, J.M. Brady, and P.M. Matthews. Advances in functional and structural MR image analysis and implementation as FSL. NeuroImage, 2004; 23(S1):208-19
6. Genovese, Christopher R., Nicole A. Lazar, and Thomas Nichols. "Thresholding of statistical maps in functional neuroimaging using the false discovery rate." Neuroimage. 2002; 15(4): 870-878.
7. Hutchings, F., et al., Predicting Surgery Targets in Temporal Lobe Epilepsy through Structural Connectome Based Simulations. PLoS Comput Biol. 2015; 11(12): p. e1004642.
Figures