4144
Co-activation Pattern Analysis in Parkinson’s Disease1Cleveland Clinic Lou Ruvo Center for Brain Health, Las Vegas, NV, United States, 2University of Colorado Boulder, Boulder, CO, United States
Synopsis
In this study, we explored the dynamics of Parkinson’s disease (PD) brain network function utilizing the co-activation pattern (CAP) analysis emphasizing sensorimotor network (SM) function during resting-state. We modified the routine to calculate group dominant CAPs (d-CAPs) and proposed a novel way to obtain within-subject CAP switching-rate. Reduced dynamics of the SM network in PD was demonstrated by both decreased number of d-CAPs and decreased switching-rate, which corroborates electrophysiologic data.
Introduction
The dynamics of the brain’s intrinsic networks have been recently studied using co-activation pattern (CAP) analysis1, 2. Such methods are important in studying brain diseases known to impact brain dynamics. Parkinson’s disease (PD), as previously reported from electrophysiologic studies, is known to involve changes in synchronization within and between brain regions, changes in phase-amplitude coupling between brain regions, and appears to limit the overall dynamic range of brain networks3, 4. Thus, in this study we explored the dynamics of PD brain network function utilizing the CAP approach emphasizing sensorimotor network (SM) during resting-state. We modified the approach to calculate group dominant CAPs (d-CAPs) and proposed a novel way to obtain within-subject CAP switching-rate, which quantifies the state alternation. We hypothesized there is a decrease in d-CAPs number and switching-rate in PD as a reflection of reduction in whole-brain dynamics.Methods
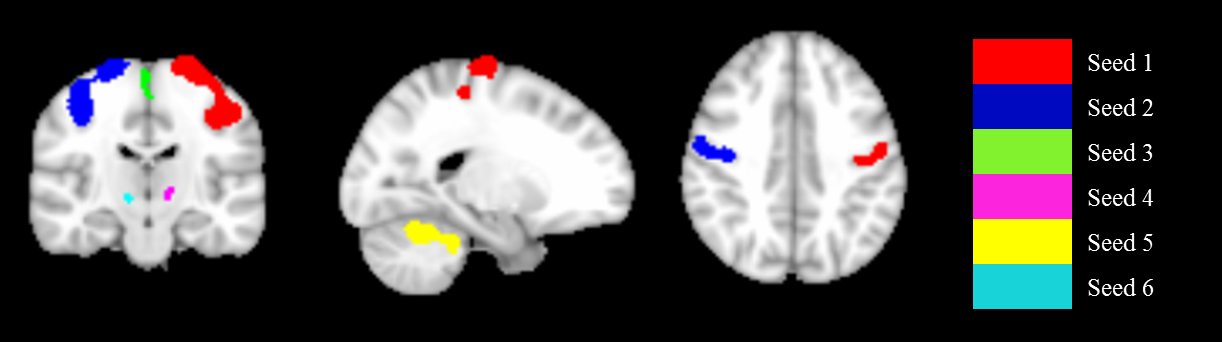
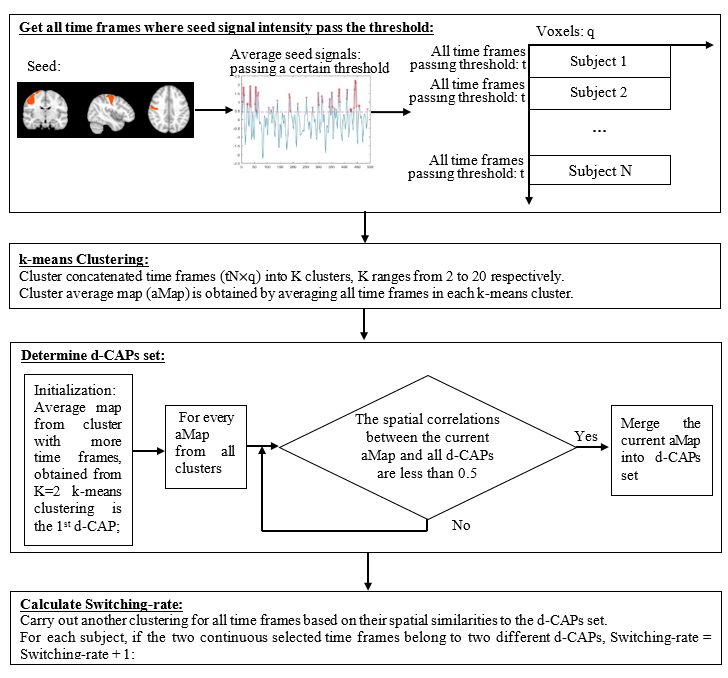
Data Acquisition: A total of 36 subjects (18 NCs (14 males; 64.25±9.50 years), 18 PD-subjects (14 Males; 65.83±7.98 years; UPDRS-III: 38.28±6.95; duration of the disease: 2.48±1.32 years)) obtained from Parkinson’s Progression Markers Initiative (PPMI) database5 were included in this study. Resting-state functional MRI was performed on 3T Siemens Trio scanner (TR/TE/Flip Angle/Resolution=2.4s/25ms/80deg/3.3mm3, 210 time frames). Preprocessing: All time frames were slice-timing corrected and realigned to the mean EPI image in SPM12 (http://www.fil.ion.ucl.ac.uk/spm/), further coregistered to the subjected T1 space and then normalized to the standard MNI-152 2mm-template using ANTs software (http://stnava.github.io/ANTs/). Six head motion parameters, signals extracted from subject white matter and CSF were regressed out from each dataset. All images were spatially smoothed using an 8mm 3D-Gaussian filter, band pass filtered (0.008Hz<$$$f$$$ <0.1Hz) and converted to zscore. CAP analysis: Atlases of functional ROIs reported in Shirer et al6 were obtained and the 6 ROIs extracted from SM network were used as the seeds for CAP analysis (Fig. 1). CAP analysis was carried out for PD and NC with each ROI as a seed separately. Time frames with the average seed signal intensity amongst the top 25% (51 frames) of each subject were extracted and temporally concatenated. This 25% value was selected by increasing the threshold from 5% to 95%, calculating the similarity between seed-based correlation map using all frames and average of the selected time frames, stopping when the correlation value reached 0.95 (See Fig. 3(A)). Dominant CAP (d-CAP) concept was adopted from Chen et al2 but determined in a modified way as follows: we first clustered the concatenated time frames into K clusters (K = 2 to 20), using k-means clustering based on spatial similarities of each time frame. Next, for each average cluster map obtained from k-means clustering (with all K), if the spatial correlation between the average spatial pattern of the current cluster and all existing d-CAPs were less than a certain threshold (set to 0.5 here to keep the number of d-CAPs manageable), the current cluster average map would be merged into the d-CAPs set, otherwise continued with the next cluster. After the entire d-CAPs set was obtained, another clustering was carried out for all time frames based on their spatial similarities to each d-CAP. Switching-rate was then calculated for each subject based on this new clustering result. For each subject, if the two continuous selected time frames belonged to two different d-CAPs, we considered there was a state-switch. The switching-rates for every seed were then compared between two groups separately. We included Fig. 2 to illustrate all the steps involved in our modified CAP analysis.Results
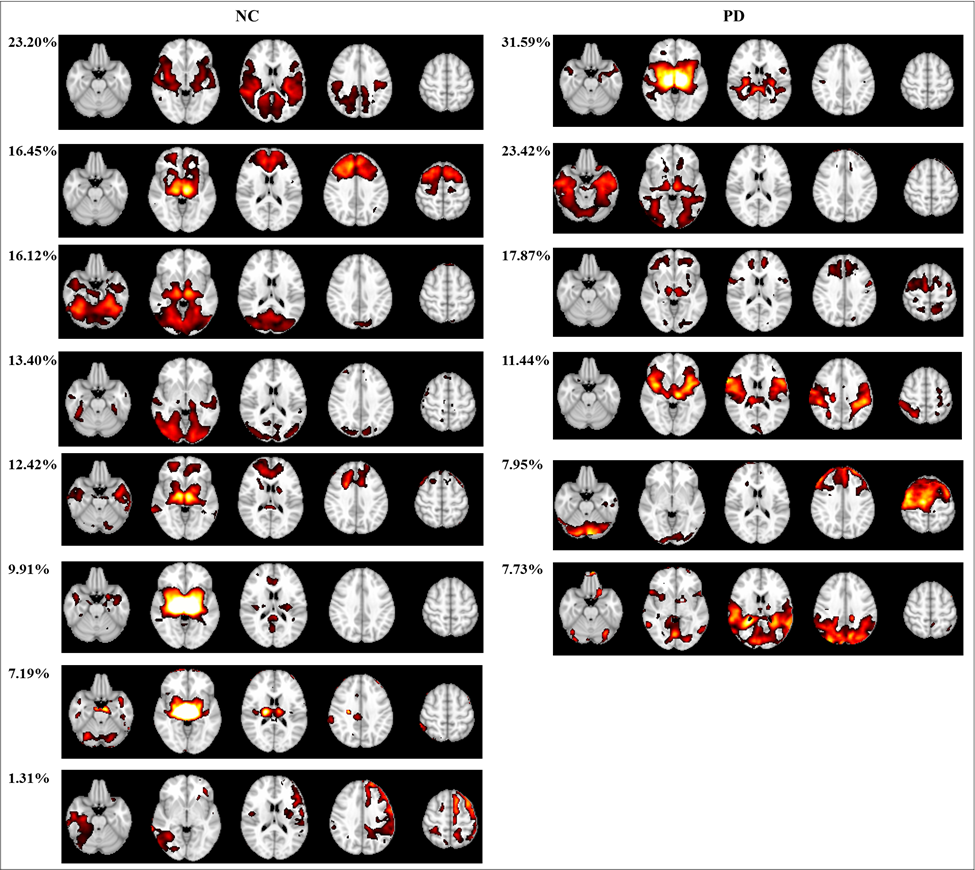
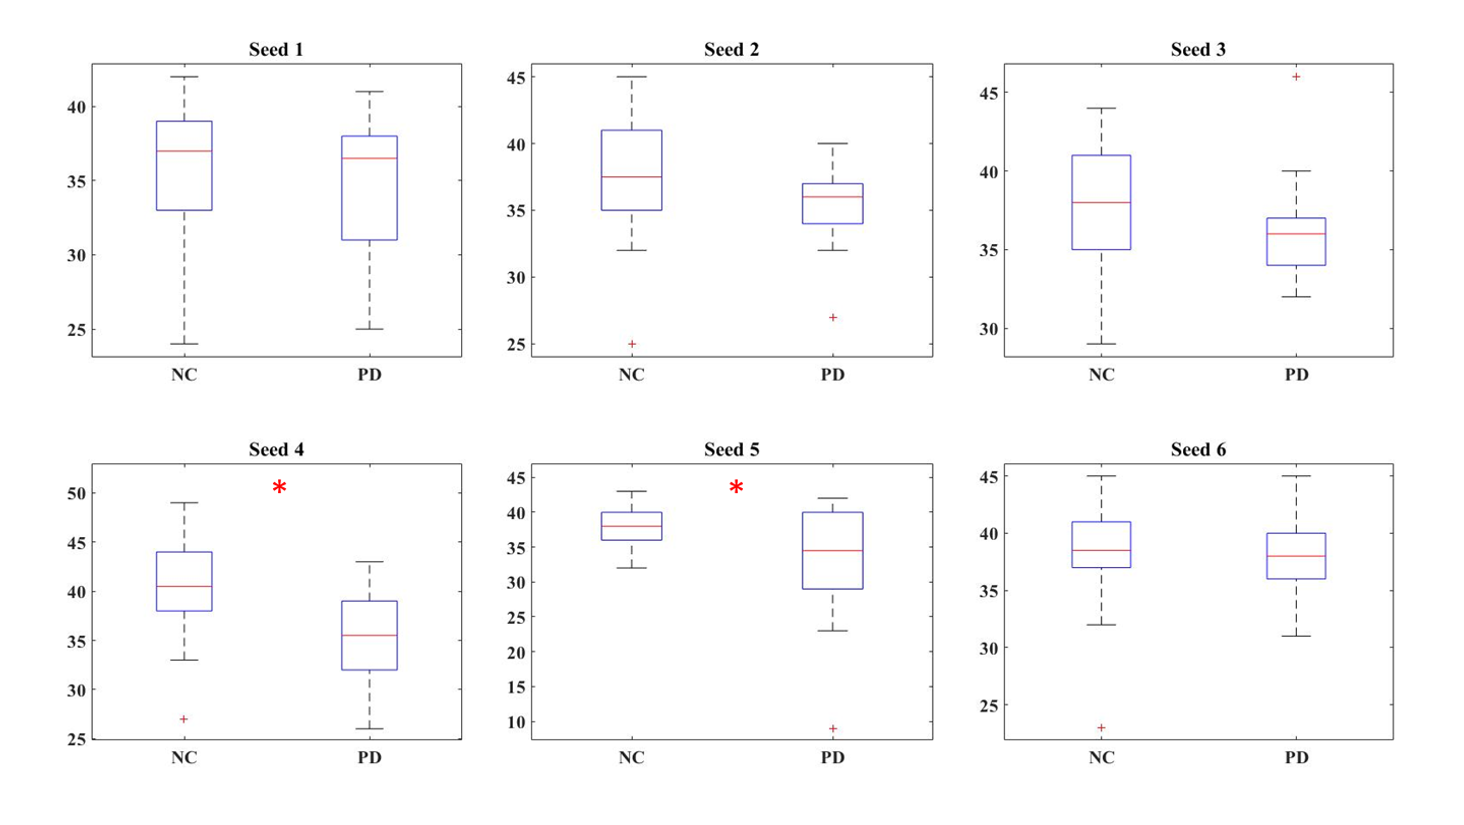
Fig.3 (B) shows the conventional seed based correlation maps and the averaging of time frames with large seed signal intensities (top 25%). Dominant CAPs for seed 4 are reported in Fig. 4 (|z-score|>2). Overall, there are fewer d-CAPs in PD for SM network, as compared to NCs. Switching-rate for PD group was overall reduced compared to NCs as shown in Fig. 5 for seed 1 to 6 separately, reaching statistical significance (p<0.05) with two seed-based CAP analysis.Discussion and Conclusion
Our results confirm that conventional seed-based correlation analysis can be reproduced by activity at a few critical time points1,2 (Fig. 3(B)). The proposed approach formed a complete routine to determine group d-CAPs and within-subject CAP switching-rate. As hypothesized, reduced dynamics of the SM network in PD is demonstrated by both decreased number of d-CAPs and switching-rates (Fig. 4, 5). This corroborates electrophysiologic data in PD, and demonstrates that such reduced network dynamics can be demonstrated using resting state fMRI.Acknowledgements
The study was supported partially by the National Institutes of Health (grant number 1R01EB014284) and by National Institute of General Medical Sciences (grant number P20GM109025). PPMI is sponsored and partially funded by The Michael J. Fox Foundation for Parkinson’s Research (MJFF). Other funding partners include a consortium of industry players, non-profit organizations and private individuals (for a full list see http://www.ppmi-info.org/about-ppmi/who-we-are/study-sponsors/).References
[1]. Liu X, and Jeff H. D. Time-varying functional network information extracted from brief instances of spontaneous brain activity. PNAS, 2013, 110(11): 4392-4397.
[2]. Chen J, et al. Introducing co-activation pattern metrics to quantify spontaneous brain network dynamics. NeuroImage, 2015, 111: 476-488.
[3]. De Hemptinne C, et al. Therapeutic deep brain stimulation reduces cortical phase-amplitude coupling in Parkinson's disease. Nature neuroscience, 2015, 18(5): 779-786.
[4]. Yanagisawa T, et al. Regulation of motor representation by phase–amplitude coupling in the sensorimotor cortex. The Journal of Neuroscience, 2012, 32(44): 15467-15475.
[5]. Parkinson Progression Marker Initiative. The Parkinson Progression Marker Initiative (PPMI). Prog Neurobiol. 2011, 95(4):629-635.
[6]. Shirer WR, et al. Decoding subject-driven cognitive states with whole-brain connectivity patterns. Cerebral Cortex. 2012, 22(1):158-65.
Figures