4143
The quantitative susceptibility mapping and non-motor symptoms of patients with early Parkinson disease1Department of Neurology, SNU-SMG Boramae Medical Center, Seoul, Korea, Republic of, 2Department of Radiology, SNU-SMG Boramae Medical Center, Seoul, Korea, Republic of, 3Department of Radiology, College of Medicine, Seoul National University, 4Department of Electrical and Computer Engineering, Seoul National University, Seoul, Korea, Republic of, 5Department of Mechanical and Aerospace Engineering, Seoul National University, Seoul, Korea, Republic of
Synopsis
This study is to evaluate the impact of quantitative susceptibility mapping (QSM) on regional distribution of iron deposition and its correlations with non-motor symptoms in patients with early Parkinson disease (PD). The QSM values of deep nuclei and clinical data using validated scales were obtained from patients. There were no differences in regional QSM values between patients and controls, and the QSM values were not correlated with any of motor or non-motor symptoms in PD patients. This study suggests that the QSM may not be a sensitive tool enough to use in patients with early PD.
Purpose
The quantitative susceptibility mapping (QSM) has been used for iron deposition in deep nuclei of patients with Parkinson disease (PD).1-11 However, there was only one study that evaluate the correlations of QSM values with non-motor symptoms (NMSs) in patients with early PD.8 The purpose of this study is to evaluate the impact of QSM on regional distribution of iron deposition and its correlations with NMSs using validated scales in early PD.Methods
The QSM images were acquired using susceptibility tensor imaging (STI) suite (Version 2.2, Updated on Jan. 8, 2014; Brain Imaging & Analysis Center, Duke University, Durham, NC, USA) on 3-Tesla magnetic resonance imaging (MRI) data from 28 patients with early PD (disease duration ≤ 5 years) and 16 normal controls.12 The QSM values were measured by region-of-interest analysis in deep nuclei: red nucleus, substantia nigra pars compacta, substantia nigra pars reticulata, dentate nucleus, globus pallidus, head of caudate nucleus, and putamen (Figure 1).13 The QSM values were classified to the ipsilateral and contralateral side of the most affected side of Parkinsonian symptoms of the patients; in controls, the mean QSM values of left and right deep nuclei were used. Demographics, disease onset, disease duration, levodopa-equivalent daily dose, Hoehn and Yahr stage, movement disorder society-sponsored unified Parkinson disease rating scale (MDS-UPDRS),14 non-motor symptoms scale (NMSS),15 and apathy scale (AS) score16 were acquired from patients by retrospective review of medical records.
For statistical analyses, the t-test and chi-squared test were used to compare age and gender differences between patients and controls; the paired t-test was used to compare ipsilateral and contralateral side of each deep nucleus in patients; the age-adjusted analysis of covariance was used to compare the QSM values of each deep nucleus of patients with those of controls; the Pearson’s correlation analysis with Bonferroni correction was used to evaluate the relationships of the QSM values and clinical data.
Results
The detailed demographic and clinical characteristics were described in Table 1. The age at acquisition of MRI was not statistically different between patients (71.1±8.5) and controls (66.4±7.7). There were no differences in the QSM values of deep nuclei ipsilateral or contralateral to the most affected side of the patients (Table 2). The QSM values in all deep nuclei were not different from those of controls (Table 3). There were no correlations of QSM values with clinical data after Bonferroni correction.Discussion
In this study, regional QSM values in deep nuclei were not different between patients and controls, and was not correlated with motor symptoms and NMSs evaluated using validated scales in patients with early PD. There have been scarce studies that applied QSM on patients with early PD.4,6,8,11 These studies reported increased iron deposition in substantia nigra, but only one study divided substantia nigra into pars compacta and reticulata in early PD patients, of which QSM value increased only in pars compacta.4 Furthermore, controversial or negative results were reported in comparison of QSM values in other deep nuclei of early PD patients and controls. In regards to NMSs, the previous study, which evaluated correlations of QSM values and NMSs in PD patients, showed positive correlations to MDS-UPDRS part I score in contrast with our results.8Conclusion
The QSM values of deep nuclei were not different between patients with early PD and controls, and had no correlations with clinical characteristics including NMSs in patients with early PD. These results suggest that the QSM may not be a sensitive tool enough to use in patients with early PD.Acknowledgements
No acknowledgement found.References
1. Azuma M, Hirai T, Yamada K, et al. Lateral Asymmetry and Spatial Difference of Iron Deposition in the Substantia Nigra of Patients with Parkinson Disease Measured with Quantitative Susceptibility Mapping. AJNR Am J Neuroradiol 2016; 37(5): 782-8.
2. Barbosa JH, Santos AC, Tumas V, et al. Quantifying brain iron deposition in patients with Parkinson's disease using quantitative susceptibility mapping, R2 and R2. Magn Reson Imaging 2015; 33(5): 559-65.
3. Du G, Liu T, Lewis MM, et al. Quantitative susceptibility mapping of the midbrain in Parkinson's disease. Movement disorders : official journal of the Movement Disorder Society 2016; 31(3): 317-24. 4. Guan X, Xuan M, Gu Q, et al. Regionally progressive accumulation of iron in Parkinson's disease as measured by quantitative susceptibility mapping. NMR in biomedicine 2016.
5. He N, Huang P, Ling H, et al. Dentate nucleus iron deposition is a potential biomarker for tremor-dominant Parkinson's disease. NMR in biomedicine 2016.
6. He N, Ling H, Ding B, et al. Region-specific disturbed iron distribution in early idiopathic Parkinson's disease measured by quantitative susceptibility mapping. Human brain mapping 2015; 36(11): 4407-20.
7. Ide S, Kakeda S, Ueda I, et al. Internal structures of the globus pallidus in patients with Parkinson's disease: evaluation with quantitative susceptibility mapping (QSM). European radiology 2015; 25(3): 710-8.
8. Langkammer C, Pirpamer L, Seiler S, et al. Quantitative Susceptibility Mapping in Parkinson's Disease. PloS one 2016; 11(9): e0162460.
9. Liu T, Eskreis-Winkler S, Schweitzer AD, et al. Improved subthalamic nucleus depiction with quantitative susceptibility mapping. Radiology 2013; 269(1): 216-23.
10. Lotfipour AK, Wharton S, Schwarz ST, et al. High resolution magnetic susceptibility mapping of the substantia nigra in Parkinson's disease. Journal of magnetic resonance imaging : JMRI 2012; 35(1): 48-55.
11. Murakami Y, Kakeda S, Watanabe K, et al. Usefulness of quantitative susceptibility mapping for the diagnosis of Parkinson disease. AJNR Am J Neuroradiol 2015; 36(6): 1102-8.
12. Li W, Wu B, Batrachenko A, et al. Differential developmental trajectories of magnetic susceptibility in human brain gray and white matter over the lifespan. Human brain mapping 2014; 35(6): 2698-713.
13. Yushkevich PA, Piven J, Hazlett HC, et al. User-guided 3D active contour segmentation of anatomical structures: significantly improved efficiency and reliability. Neuroimage 2006; 31(3): 1116-28.
14. Goetz CG, Tilley BC, Shaftman SR, et al. Movement Disorder Society-sponsored revision of the Unified Parkinson's Disease Rating Scale (MDS-UPDRS): scale presentation and clinimetric testing results. Movement disorders : official journal of the Movement Disorder Society 2008; 23(15): 2129-70.
15. Chaudhuri KR, Martinez-Martin P, Brown RG, et al. The metric properties of a novel non-motor symptoms scale for Parkinson's disease: Results from an international pilot study. Movement disorders : official journal of the Movement Disorder Society 2007; 22(13): 1901-11.
16. Starkstein SE, Mayberg HS, Preziosi TJ, Andrezejewski P, Leiguarda R, Robinson RG. Reliability, validity, and clinical correlates of apathy in Parkinson's disease. The Journal of neuropsychiatry and clinical neurosciences 1992; 4(2): 134-9.
Figures
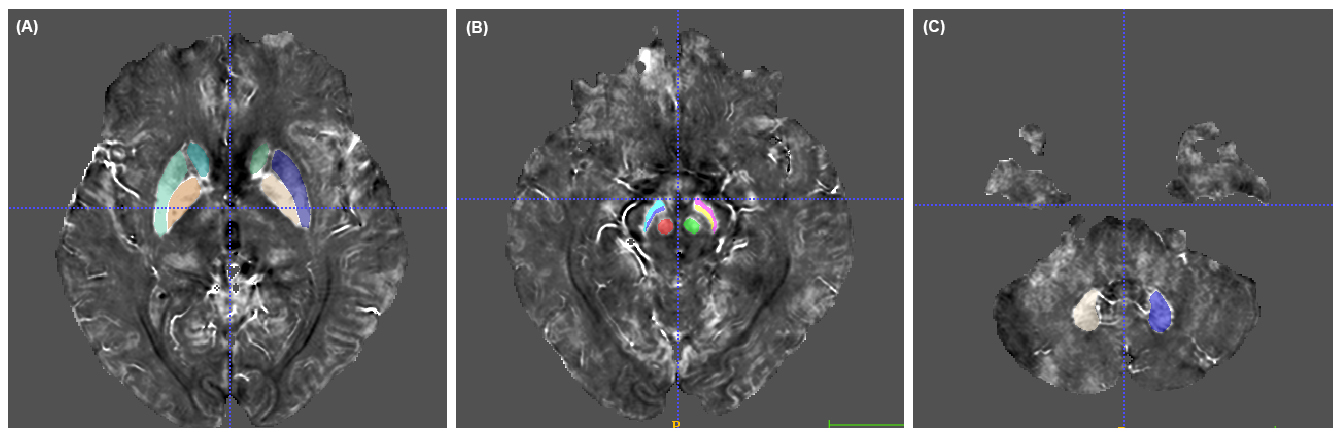
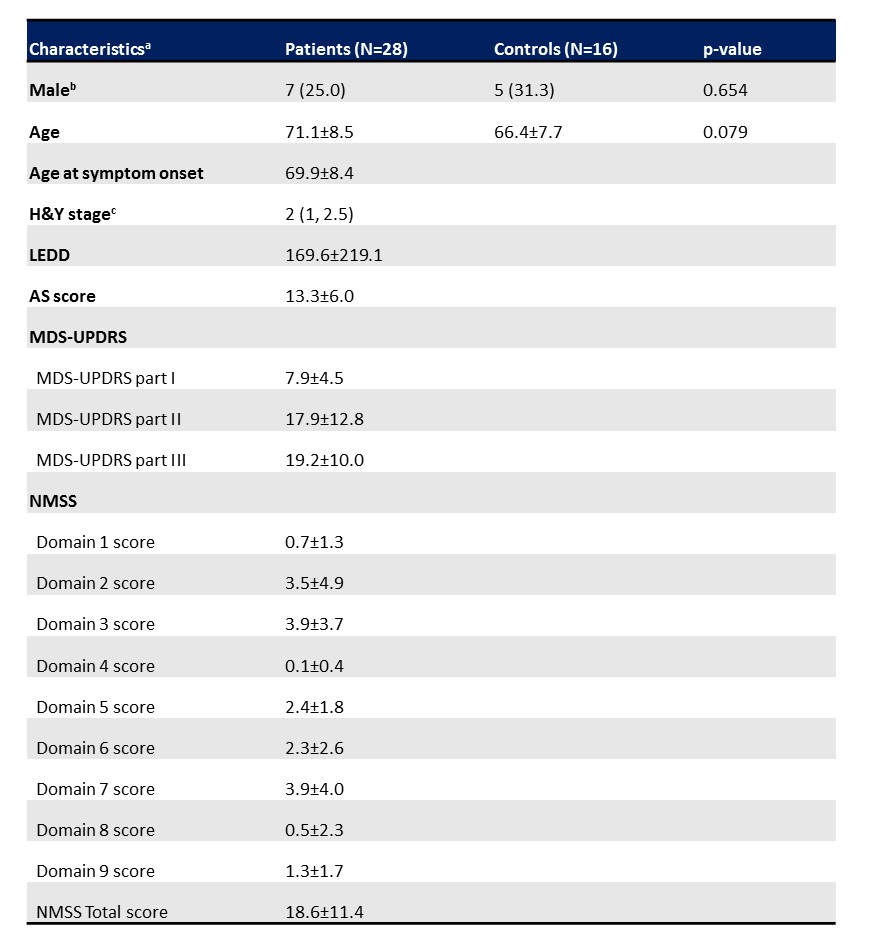
Table 1. Demographics and neurological characteristics
aData not otherwise specified are presented as the mean±SD.
bData are presented as frequency (percentage). cData are presented as median (minimum, maximum).
Abbreviation: H&Y, Hoehn and Yahr; LEDD, levodopa-equivalent daily dose; AS, apathy scale; MDS-UPDRS, movement disorder society-sponsored unified Parkinson disease rating scale; NMSS, non-motor symptoms scale; SD, standard deviation.
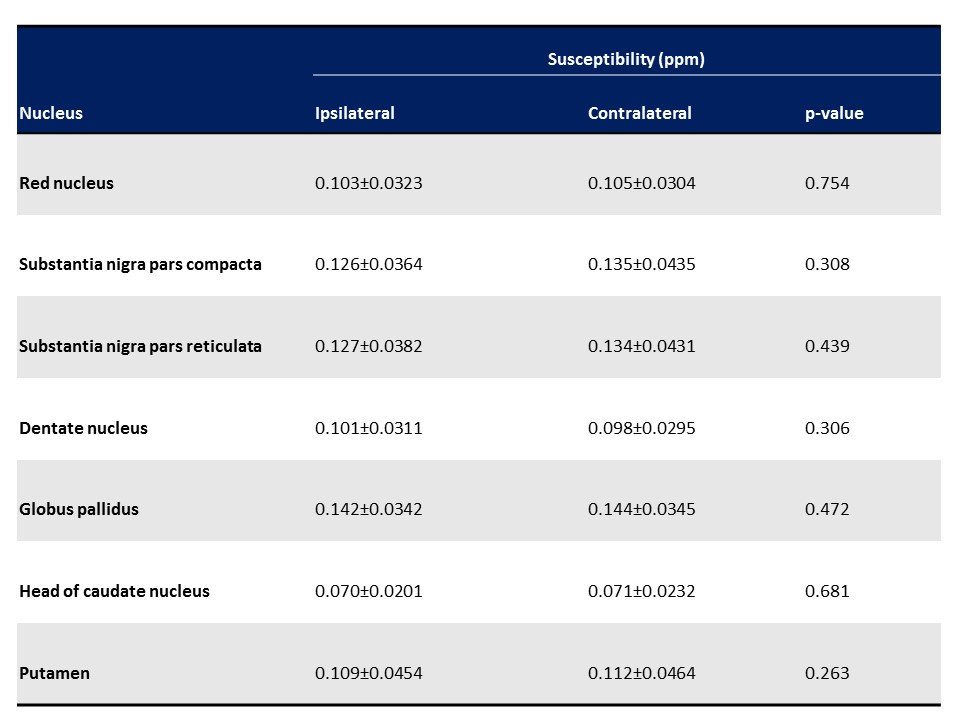
Table 2. Differences of susceptibility values in the ipsilateral and contralateral deep nuclei of the most affected side of Parkinson disease patients
Data are presented as the mean±SD.
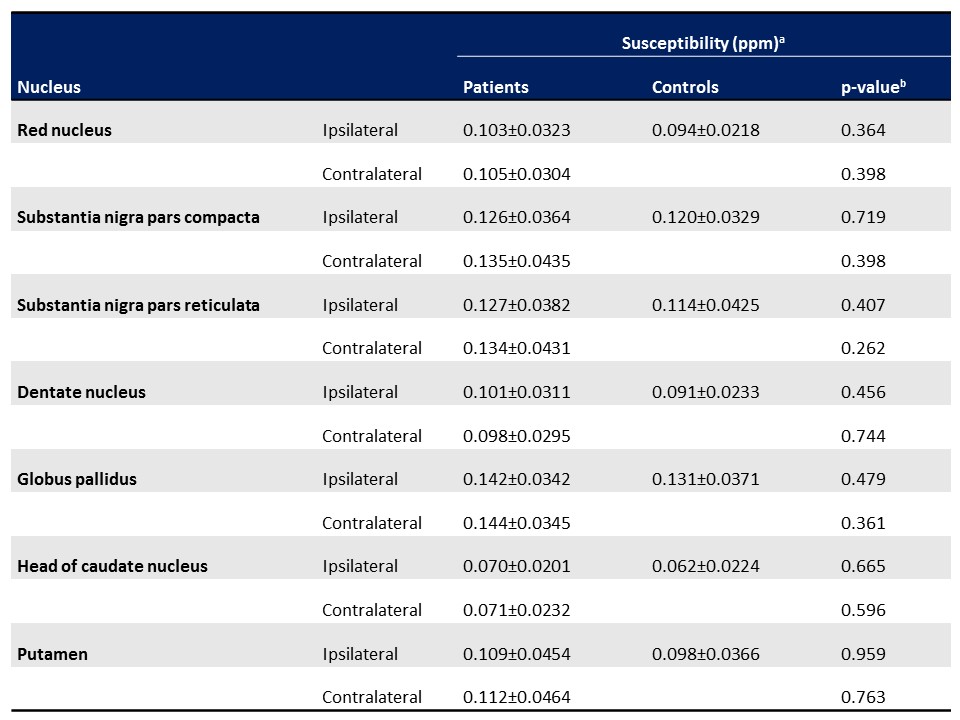
Table 3. Regional differences of susceptibility values in Parkinson disease patients and controls
aData are presented as the mean±SD.
bThe age-adjusted analysis of covariance was used for statistical analysis.