4142
Quantitative susceptibility mapping (QSM) as a biomarker for evaluating white matter alterations in Parkinson’s disease1Radiology, Second Affiliated Hospital of Zhejiang University School of Medicine, Hangzhou, People's Republic of China, 2Brain Imaging and Analysis Center, Duke University School of Medicine, Durham, NC, United States, 3Neurology, Second Affiliated Hospital of Zhejiang University School of Medicine, Hangzhou, People's Republic of China, 4MR Research, GE Healthcare, Shanghai, People's Republic of China
Synopsis
Myelinated white matter showing diamagnetic susceptibility is important for information transfer in the brain. In Parkinson’s disease, the white matter is damaged secondary to nigral degeneration. Quantitative susceptibility mapping is a novel technique for noninvasive assessment of regional white matter ultrastructure, and provides different information to standard diffusion tensor imaging.
Purpose
In Parkinson’s disease (PD), the white matter is damaged secondary to nigral degeneration. Given negative relationship between magnetic susceptibility and myelin content1, we used QSM to examine the alterations in white matter ultrastructure (by quantifying susceptibility) in a cohort of PD patients, and compared these findings with typical diffusion tensor imaging (DTI) variables.Methods
Sixty-five PD patients and 46 healthy controls were recruited (Table 1). Enhanced T2 star-weighted angiography, DTI, and 3D T1-weighted images were acquired on a 3.0-T MR scanner using an 8-channel head coil.
QSM reconstruction was performed on a computer cluster running susceptibility imaging software (STI suite) 2-4. The measurement of QSM is influenced by fiber orientation in the magnetic field5-7. Thus, we calculated the head rotation angle (HRA) relative to the B0 field5. DTI was analyzed using FSL. QSM maps were first coregistered with DTI images through raw ESWAN images using a rigid-body transformation. Mean fractional anisotropy (FA) image was calculated and compressed to form a mean skeleton representing the topological features of all tracts derived from the whole group. Mean diffusivity (MD), radial diffusivity (RD), and QSM maps were also normalized to the skeleton using tract-based spatial statistics.
QSM and DTI data were analyzed using an independent two sample t-test with the FSL randomize procedure with 5,000 permutations (p < 0.001, cluster size > 10). A partial Pearson correlation analysis was performed between clinical features and imaging indices.
Results
Increased MMS including bilateral external capsule (EC), inferior longitudinal fasciculus (ILF), inferior fronto-occipital fasciculus, left superior longitudinal fasciculus (SLF), right anterior thalamic radiation, left cingulum (cingulate gyrus; Cg) and the body of the corpus callosum (Fig. 1, QSM) were observed in PD patients compared with controls. Regions with decreased MMS included the bilateral deep white matter of the frontal lobes and the right cerebellar hemisphere.PD patients showed a significant reduction in FA only in the right uncinated fasciculus (UF) compared with healthy controls (Fig. 1, FA), MD was significantly increased in right EC and forceps minor, and left cingulum (hippocampus; Ch) (Fig. 1, MD). Besides, RD was significantly increased in the left Ch, left ILF, and right SLF (Fig. 1, RD). We also observed decreased RD in the right cerebellar hemisphere.
Figs. 2 showed the overlaps of QSM and DTI data including an increase in MMS and RD in the left ILF, and a decrease in MMS and RD in the right cerebellar white matter.
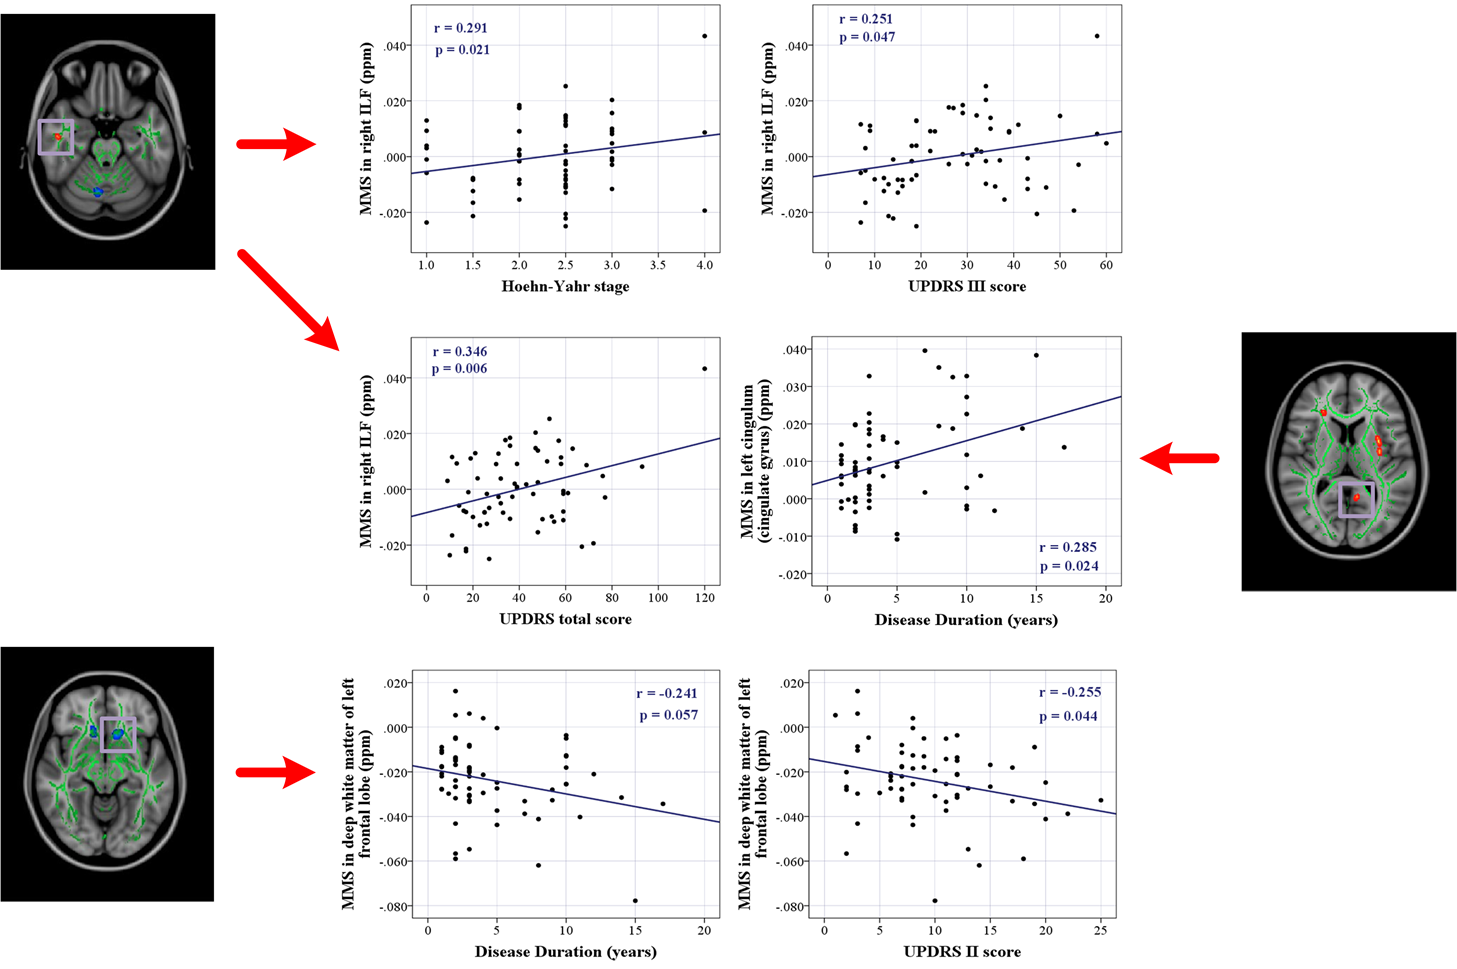
Table 2 showed the correlations between indices of QSM (Fig. 3) and DTI and clinical assessments.
Discussion
In comparison with DTI, QSM demonstrated a spatially extensive involvement of the white matter adjacent to the frontal, parietal, and temporal lobes, the EC, body of the corpus callosum, and the Cg. Normal myelin shows a low MMS because of its diamagnetic properties5,8-10, while MMS also differs according to the complexity of white matter fiber organization. Thus, in the present study, the increase in MMS may reflect damage to the white matter and a reduction in myelin content. Besides, both QSM and DTI showed decreased MMS and RD in the right cerebellar hemisphere, and increased MMS and RD in the left temporal lobe, in PD patients although they reflect different tissue properties. Due to DTI data are strongly affected by the extracellular space, axonal diameter, and membrane permeability11-13, our data suggest that QSM can improve the detection of regional ultrastructural changes in the white matter of PD patients.
The clinical relevance of regional white matter alterations measured with MMS and DTI variables in PD patients demonstrate involvement of the IFL, SLF, and Ch in motor impairment and global disease severity in PD. With disease progression, the Cg, a part of posterior cingulum that is highly related to cognitive function14, showed a continued decrease in myelin integrity on QSM, although our patients showing normal clinical cognition. Nevertheless, this may explain the cognitive impairments commonly observed in advanced PD patients15-17.
A decrease in MMS and RD indicate an increase in diamagnetic tissues and an increased barrier to water diffusion in the radial direction, respectively. Therefore, the white matter of the left cerebellar hemisphere and the frontal lobes (negatively correlated with UPDRS II score18,19.) possibly indicated an increase in myelination in these regions with enhanced structural connectivity between the cerebellum and cerebrum.
Conclusion
Our data suggest that QSM may be a novel approach for detecting alterations in the white matter and examining the underlying network disruption in PD. Further, combination of QSM with DTI provides a more complete evaluation of the diseased brain by analyzing different biological tissue properties.Acknowledgements
This work was supported by the 13th Five-year Plan for National Key Research and Development Program of China (Grant No. 2016YFC1306600), the 12th Five-year Plan for National Science and Technology Supporting Program of China (Grant No. 2012BAI10B04) and the National Natural Science Foundation of China (Grant Nos. 81571654, 81371519 and 81301190). C.L. was supported in part by the National Institutes of Health through grants NIMH R01MH096979 and NINDS R01NS079653, and by the National Natural Science Foundation of China (Grant No. 81428013).References
1. Argyridis, I., Li, W., Johnson, G. A. & Liu, C. Quantitative Magnetic Susceptibility of the Developing Mouse Brain Reveals Microstructural Changes in the White Matter. NEUROIMAGE. 2013; 88C, 134-142.
2. Li, W. et al. Differential Developmental Trajectories of Magnetic Susceptibility in Human Brain Gray and White Matter Over the Lifespan. HUM BRAIN MAPP. 2014; 35, 2698-2713.
3. Guan, X. et al. Regionally Progressive Accumulation of Iron in Parkinson's Disease as Measured by Quantitative Susceptibility Mapping. NMR BIOMED. 2016.
4. Guan, X. et al. Influence of Regional Iron On the Motor Impairments of Parkinson's Disease: A Quantitative Susceptibility Mapping Study. J MAGN RESON IMAGING. 2016.
5. Li, W., Wu, B., Avram, A. V. & Liu, C. Magnetic Susceptibility Anisotropy of Human Brain in Vivo and its Molecular Underpinnings. NEUROIMAGE. 2012; 59, 2088-2097.
6. Li, X. et al. Mapping Magnetic Susceptibility Anisotropies of White Matter in Vivo in the Human Brain at 7 T. NEUROIMAGE. 2012; 62, 314-330.
7. Lee, J. et al. Sensitivity of MRI Resonance Frequency to the Orientation of Brain Tissue Microstructure. Proc Natl Acad Sci U S A. 2010; 107, 5130-5135.
8. Liu, C., Li, W., Johnson, G. A. & Wu, B. High-Field (9.4 T) MRI of Brain Dysmyelination by Quantitative Mapping of Magnetic Susceptibility. NEUROIMAGE. 2011; 56, 930-938.
9. Liu, C., Li, W., Tong, K. A., Yeom, K. W. & Kuzminski, S. Susceptibility-Weighted Imaging and Quantitative Susceptibility Mapping in the Brain. J MAGN RESON IMAGING. 2015; 42, 23-41.
10. Lodygensky, G. A. et al. In Vivo Assessment of Myelination by Phase Imaging at High Magnetic Field. NEUROIMAGE. 2012; 59, 1979-1987.
11. Jones, D. K., Knosche, T. R. & Turner, R. White Matter Integrity, Fiber Count, and Other Fallacies: The Do's and Don'ts of Diffusion MRI. NEUROIMAGE. 2013; 73, 239-254.
12. Beaulieu, C. The Basis of Anisotropic Water Diffusion in the Nervous System - a Technical Review. NMR BIOMED. 2002; 15, 435-455.
13. Neil, J., Miller, J., Mukherjee, P. & Huppi, P. S. Diffusion Tensor Imaging of Normal and Injured Developing Human Brain - a Technical Review. NMR BIOMED. 2002; 15, 543-552.
14. Delano-Wood, L. et al. Posterior Cingulum White Matter Disruption and its Associations with Verbal Memory and Stroke Risk in Mild Cognitive Impairment. J ALZHEIMERS DIS. 2012; 29, 589-603.
15. Williams-Gray, C. H. et al. The Distinct Cognitive Syndromes of Parkinson's Disease: 5 Year Follow-Up of the CamPaIGN Cohort. BRAIN. 2009; 132, 2958-2969.
16. Hobson, P. & Meara, J. Risk and Incidence of Dementia in a Cohort of Older Subjects with Parkinson's Disease in the United Kingdom. Mov Disord. 2004; 19, 1043-1049.
17. Aarsland, D. et al. Risk of Dementia in Parkinson's Disease: A Community-Based, Prospective Study. NEUROLOGY. 2001; 56, 730-736.
18. Parashos, S. A. et al. Measuring Disease Progression in Early Parkinson Disease: The National Institutes of Health Exploratory Trials in Parkinson Disease (NET-PD) Experience. JAMA NEUROL. 2014; 71, 710-716.
19. Harrison, M. B. et al. UPDRS Activity of Daily Living Score as a Marker of Parkinson's Disease Progression. Mov Disord. 2009; 24, 224-230.
Figures
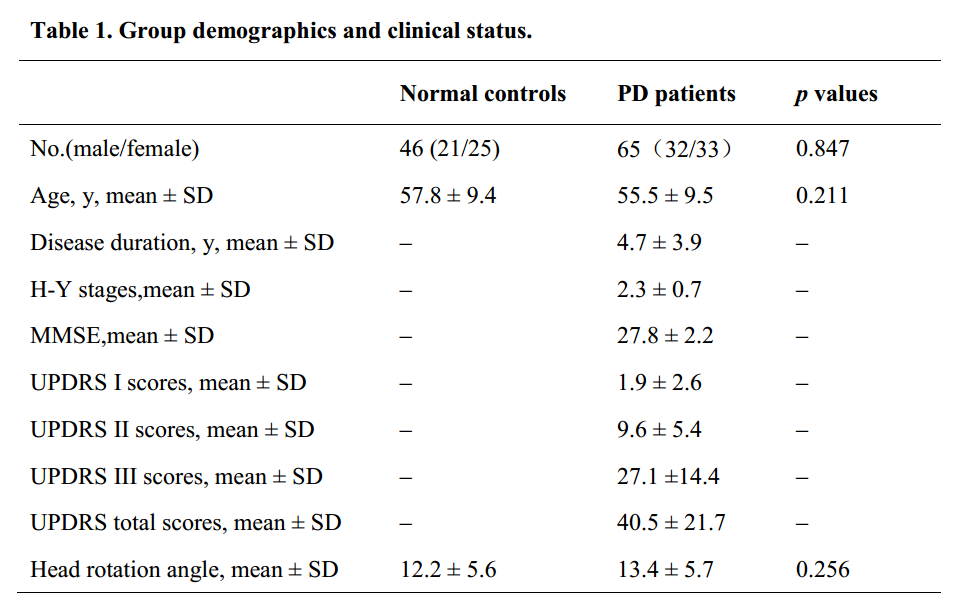
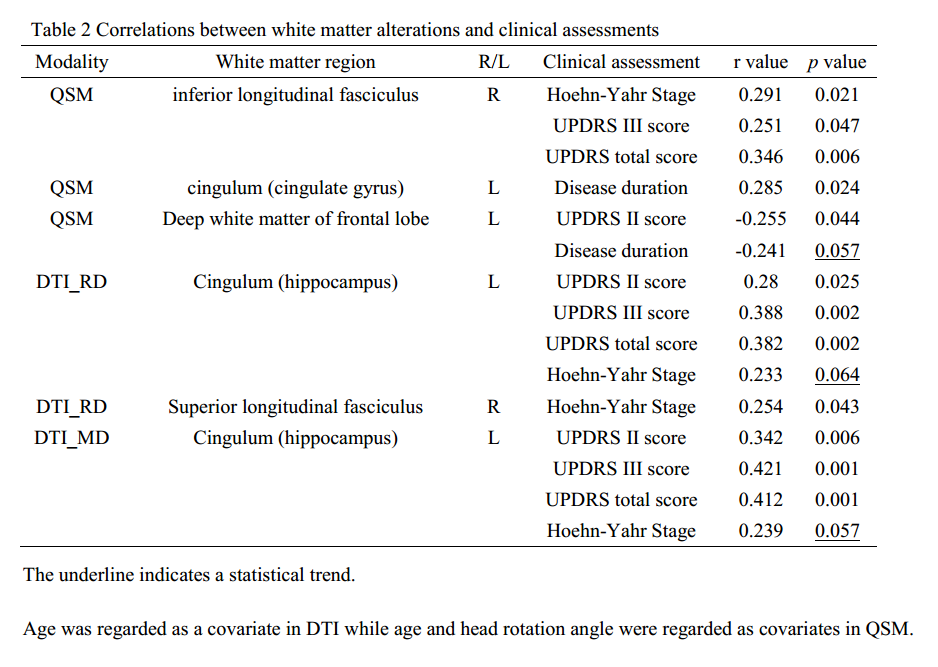
Table 2
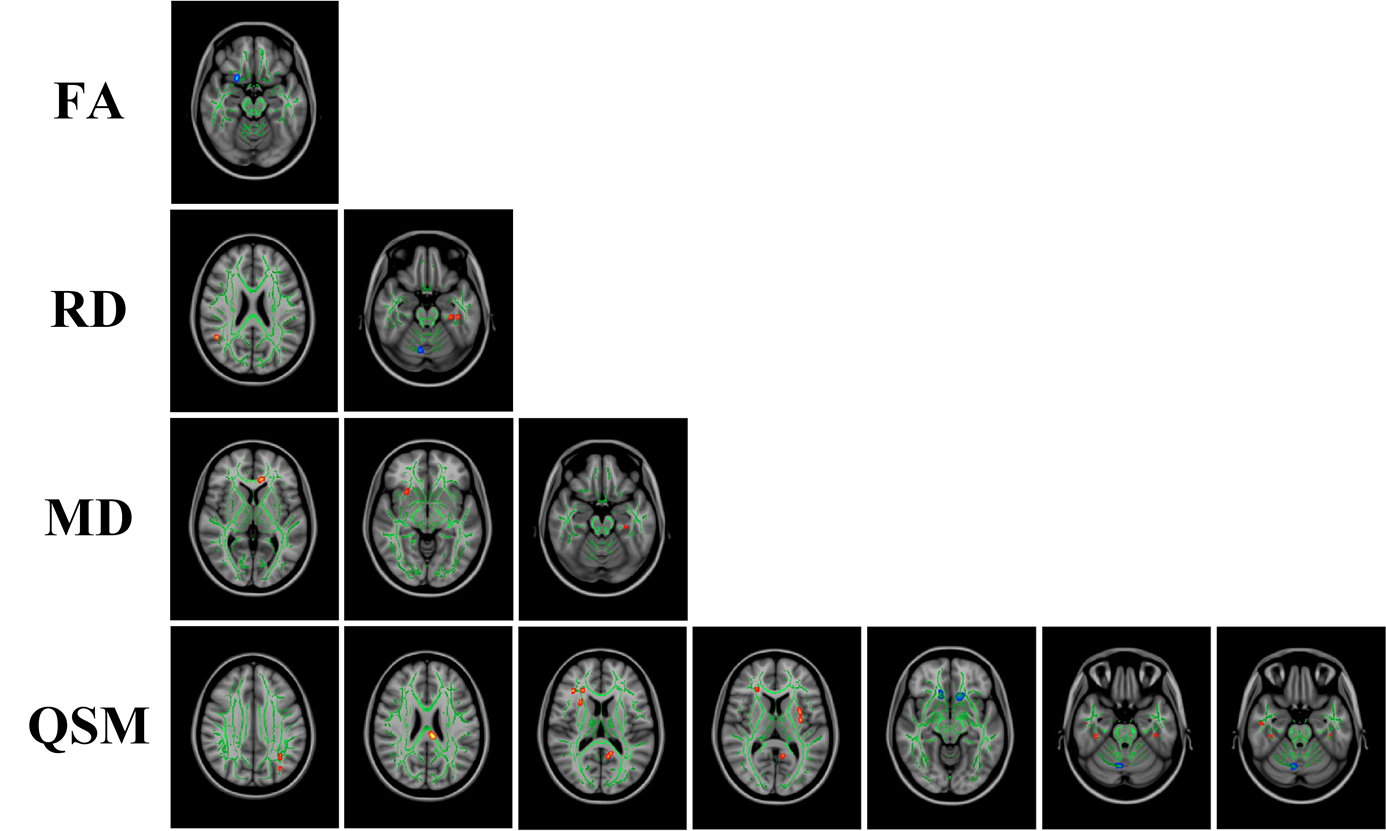
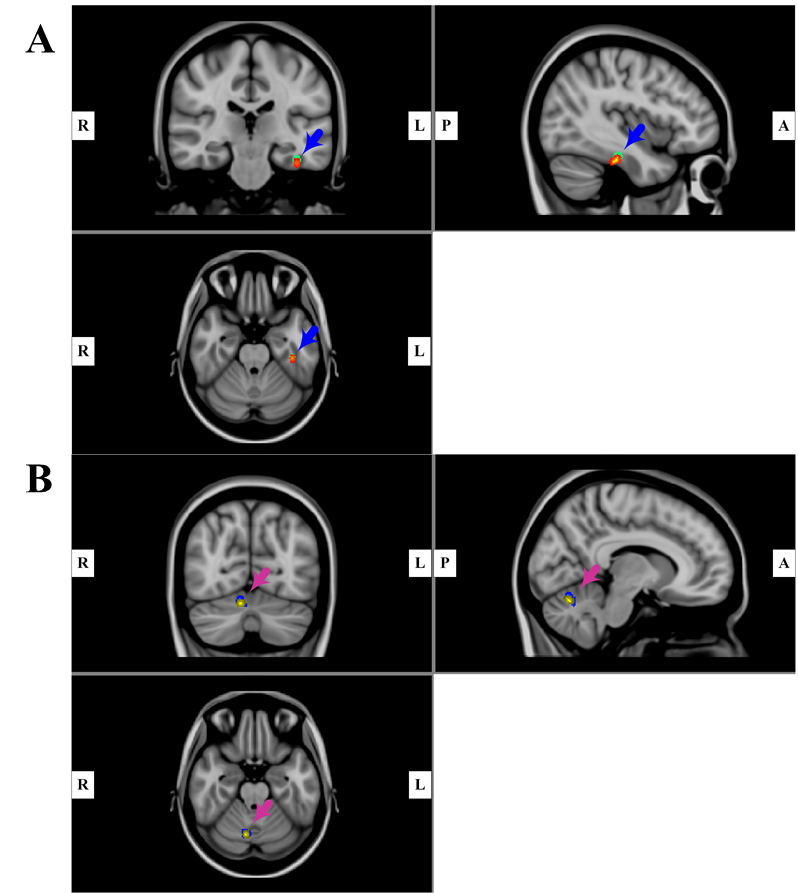
Fig. 2. A: Region of increased mean magnetic susceptibility (MMS) and radial diffusivity (RD) (red color, increased MMS; green color, increased RD) (p < 0.001, cluster size > 10). Results are shown overlaid on an MNI152 template.
B: Region of decreased MMS and RD (blue, decreased MMS; yellow, decreased RD) (p < 0.001, cluster size > 10). Results are shown overlaid on an MNI152 template.