4141
Functional MRS in patients with mild cognitive impairment and Alzheimer’s disease: Three-year longitudinal study1Kyung Hee University Hospital, Seoul, Korea, Republic of, 2Radiology, Kyung Hee University Hospital at Gangdong, Seoul, Korea, Republic of, 3Kyung Hee University, 4Kyung Hee University Hospital at Gangdong, 5Radiology, Kyung Hee University Hospital, Seoul, Korea, Republic of
Synopsis
To measure temporal changes of the metabolite level during a memory task, proton functional MRS (fMRS) data with a single-voxel PRESS sequence were acquired at the precuneus and posterior cingulate brain region during a face-name association task using a 3 Tesla MRI scanner for the 28 cognitive normal elderly, 16 amnestic mild cognitive impairment, and 12 Alzheimer’s disease individuals. We measured the fMRS data three times at the eight-month interval. All of the acquired data were analyzed using LCModel software. Glx at the second trial increased significantly compared to that of the first trial in the novel condition.
Background and Objective
Proton MR spectroscopy (1H MRS) metabolite ratios in patients with amnestic mild cognitive impairment (aMCI) and Alzheimer’s disease (AD) are different to those of cognitive normal (CN) elderly subject. Previous functional MRS (fMRS) studies in normal subjects showed that alterations in the local metabolite occurred when a particular area of the brain becomes engaged in a task (1,2). Thus, fMRS may be useful in evaluating treatment effects in a neurologic patient by measuring functional alterations of metabolites. fMRS data acquired during the face-name association task can increase the understanding of episodic and semantic memory performances in AD patients (3). However, the previous study was not a longitudinal study, but just cross-sectional study at one time point. Longitudinal changes of the metabolites using 1H MRS have received a minimal evaluation in AD and the metabolite response in MRS with neuronal stimulation during a memory task and during treatment in AD patients is still unknown.
The objective of this study was to evaluate longitudinal fMRS data to measure changes of the metabolite level during a memory task in the subjects of CN, aMCI and AD and to evaluate metabolites for the treatment response in AD.
Methods
This study involved 28 CN elderly, 16 aMCI, and 12 mild and probable AD individuals. Proton fMRS data with a single-voxel PRESS sequence were acquired at the precuneus and posterior cingulate brain region during a face-name association task using a 3 Tesla MRI scanner (Achieva, Philips Medical System, Best, The Netherlands). The size of the voxel-of-interest was 25 x 25 x 25 mm3. The session was divided into eight blocks. The fixation (F)-novel (N)-fixation (F)–repeat (R) blocks were altered twice, with different face–name pairs used for every block. The block duration was 30 s for the fixation block and 60 s for both novel and repeat blocks. There were 36 dynamic fMRS data per run (i.e. 36 dynamic scans). TR per dynamics (i.e., dynamic scan times), which represent the temporal resolution, was 10 s. The scan time was 6 min. We applied the same method described above to the three longitudinal fMRS scans. We measured those fMRS data three times at the eight-month interval. All of the acquired in vivo 1H fMRS data were analyzed using the Linear Combination Model software (LCModel, Version 6.3–0L, Oakville, Ontario, Canada). The targeted metabolites were total N-acetylaspartate (tNAA), total choline (tCho), total creatine (tCr), myo-inositol (mIns), glutamate (Glu), and glutamate-glutamine complex (Glx). Peak areas of all metabolites were normalized by using that of tCho. Statistical analysis of quantified metabolites was performed to evaluate differences of the metabolite values between the stimulation conditions using paired t test. Repeated measures ANOVA (RM-ANOVA) analysis was performed to demonstrate temporal changes of metabolites and to evaluate metabolite differences among the three subject groups in the combined three different conditions. Each metabolite for each condition was compared among the three subject groups using analysis of covariance (ANCOVA) with age and gender as covariates. For evaluating the dynamic temporal changes of the metabolites we performed two-tailed paired t-test for comparing between 3 conditions.Results
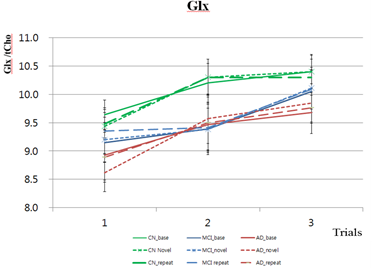
Metabolites were significantly different between conditions for the CN group, but not for the MCI and AD group. For the CN group, tNAA in the third trial were significantly different between the novel and repeat conditions (Paired t test, p=0.0108). The tNAA and tCr metabolites were significantly different among the subject groups (CN, aMCI, AD), but not among the trial times (first, second, third). The mIns and Glx metabolites were significantly different among the trial times, but not among the subject groups. The Glu metabolite was significantly different among the subject groups for the base and novel conditions and different among the trial times for only the novel condition. The results of comparisons among the three groups for each condition showed that for all three conditions, tNAA was significantly different between CN and AD for the first, second, and third trials. In addition, tNAA was significantly different between aMCI and AD for the first and third trials. In the novel and repeat conditions, tNAA was significantly different between CN and AD for the first, second, and third trials. Additionally, tNAA was significantly different between aMCI and AD for the third trial. The results of dynamic temporal changes of the metabolites for each condition showed that in the CN group, Glx at the second trial increased significantly compared to that of the first trial in the novel condition. Glx also increased significantly in the repeat condition, but not in the base condition. Glx and Glu at the third trial were significantly increased compared to that of the first trial in the novel condition, but not for the base and repeat conditions.Conclusion
In the AD group, Glx and Glu at the third trial were significantly increased compared to that of the first trial in novel condition, but not for the base and repeat conditions. tNAA were reduced in patients with AD compared with CN (1st, 2nd and 3rd trials) and aMCI (1st and 3rd trials). tNAA could be used to distinguish AD from CN and AD from aMCI. Metabolite level of tNAA may be used as a biomarker that reflects functional brain impairment in a demented patient. Temporal changes in Glx concentrate ions were increased after taking acetylcholine esterase inhibitor in the AD subject. Glx may also be suitable to demonstrate functional recovery after treatment.Acknowledgements
This study was supported by a grant of the Korean Health Technology R&D Project, Ministry of Health & Welfare, Republic of Korea (HI1C1238/A111282).References
1. Schaller, B., et al. J Neurosci Res, 2013. 91(8): p. 1076-83.
2. Gussew, A., et al. Neuroimage, 2010. 49(2): p. 1895-902.
3. Jahng, G.H., et al. J Alzheimers Dis, 2016. 53(2): p. 745.
Figures