4139
Differentiation of deep gray matters in patients with Alzheimer’s disease (AD), dementia with Lewy bodies (DLB) and Parkinson’s disease dementia (PDD) using T1 weighted images and quantitative susceptibility maps (QSM)1Seoul St.Mary Hospital, Seoul, Korea, Republic of
Synopsis
The purpose of this study was to differentiate Alzheimer’s disease (AD), dementia with Lewy bodies (DLB) and Parkinson’s disease dementia (PDD) by evaluating deep gray matter regions of the three subject groups. The 3D T1 weighted images and quantitative susceptibility maps (QSM) were segmented into 15 deep gray matter structures to estimate volumes and mean susceptibility values, and differences among the three groups were evaluated using a one-way analysis of covariance (ANCOVA) with age and gender as covariates. A multivariate logistic regression and receiver operating characteristic curve analyses were performed to determine associated imaging features and diagnostic performance.
Purpose
Differentiation of dementia remains challenging due to the overlapping clinical symptoms and difficulty in understanding exact pathophysiological pathways. Although many attempts were made to characterize Alzheimer’s diseases (AD), dementia with Lewy bodies (DLB) and Parkinson’s disease dementia (PDD), few studies have been performed to discover non-invasive imaging biomarkers to distinguish different types of dementia1. The objective of this study was to characterize and distinguish AD, DLB and PDD by estimating deep gray matter volumes and their susceptibility properties using volumetry from T1 weighted images and quantitative susceptibility maps (QSM).Methods
Subjects
The participants were 10 AD patients (5 males, 5 females, mean age = 75.9, SD = 5.65), 14 DLB (8 males, 6 females, mean age = 78.2, SD = 6.00) and 19 PDD patients (7 males, 12 females, mean age = 70.9, SD = 10.0).
Image acquisition
MR images of each subject were acquired using a 3T MR system (Magnetom Verio, Siemens, Erlangen, Germany) equipped with an 32-channel sensitivity encoding head coil. A fully first-order flow-compensated 3D multi-echo gradient-echo sequence was used to acquire data for subsequent quantitative processing based on axial magnitude and phase images to create QSMs (TR = 24.0ms, TE = 4.92, 7.38, 9.84, 12.3, 14.76, 17.22 and 19.68ms, FA = 15°, FOV = 173 x 230 x 144mm3, acquisition voxel size = 0.72 x 0.72 x 2mm3). The sagittal structural 3D T1 weighted images were acquired with the magnetization prepared rapid acquisition of gradient echo sequence for image registration and volumetric measurement (TR = 1780ms, TE = 2.2ms, FA = 9°, FOV = 256 x 256 x 256mm3, acquisition voxel size = 1 x 1 x 1mm3).
QSM generation and post-processing
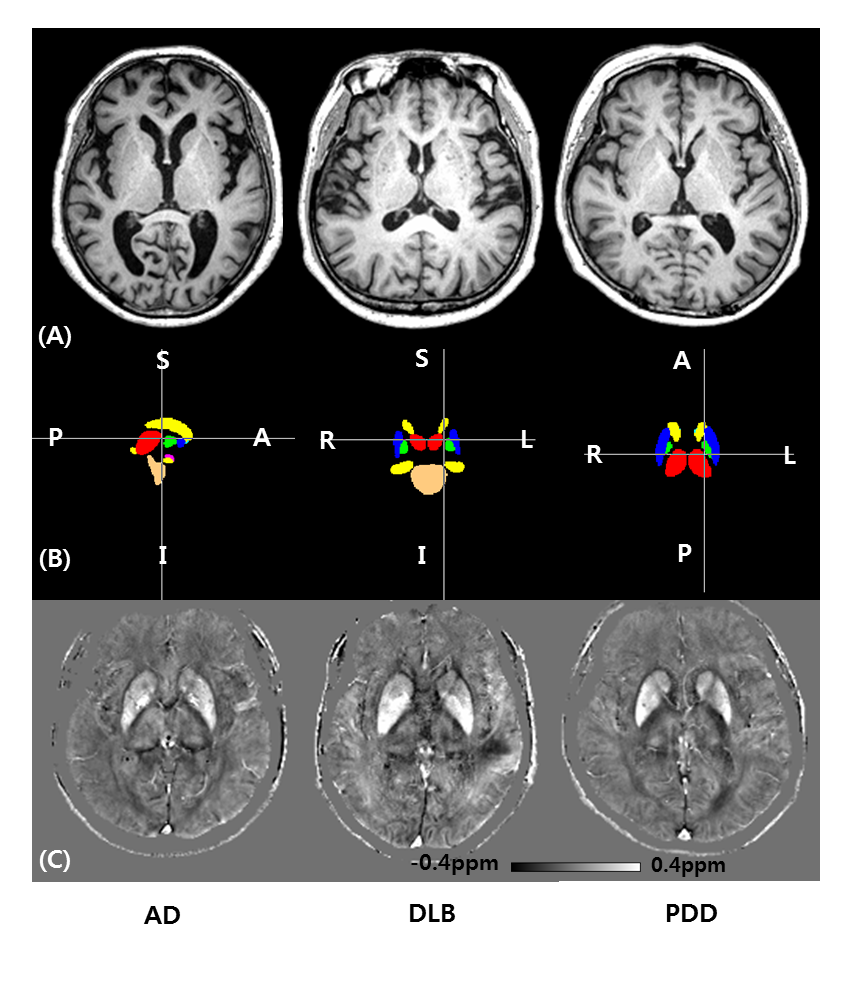
The magnitude and phase images were further processed to generate susceptibility maps using an iLSQR method, which iteratively removes streaking artifacts from the ill-conditioned k-space of an initial susceptibility map estimated by the least-squares-algorithm-based (LSQR) methods2, 3. For 3DT1 weighted images, a total of 15 deep gray matter regions were extracted using a FMRIB Software Library (FSL) tool (Functional Magnetic Resonance Imaging of the Brain Analysis Group, Oxford University, UK) and were normalized by a total intracranial volume of the same subject. The QSM of each subject was co-registered to the 3DT1 weighted image using Statistical Parametric Mapping (SPM8) tool (Wellcome Department of imaging Neuroscience, University College, London, UK), and the segmented deep gray matter regions were used as masking templates to calculate mean susceptibility values.
Statistical analysis
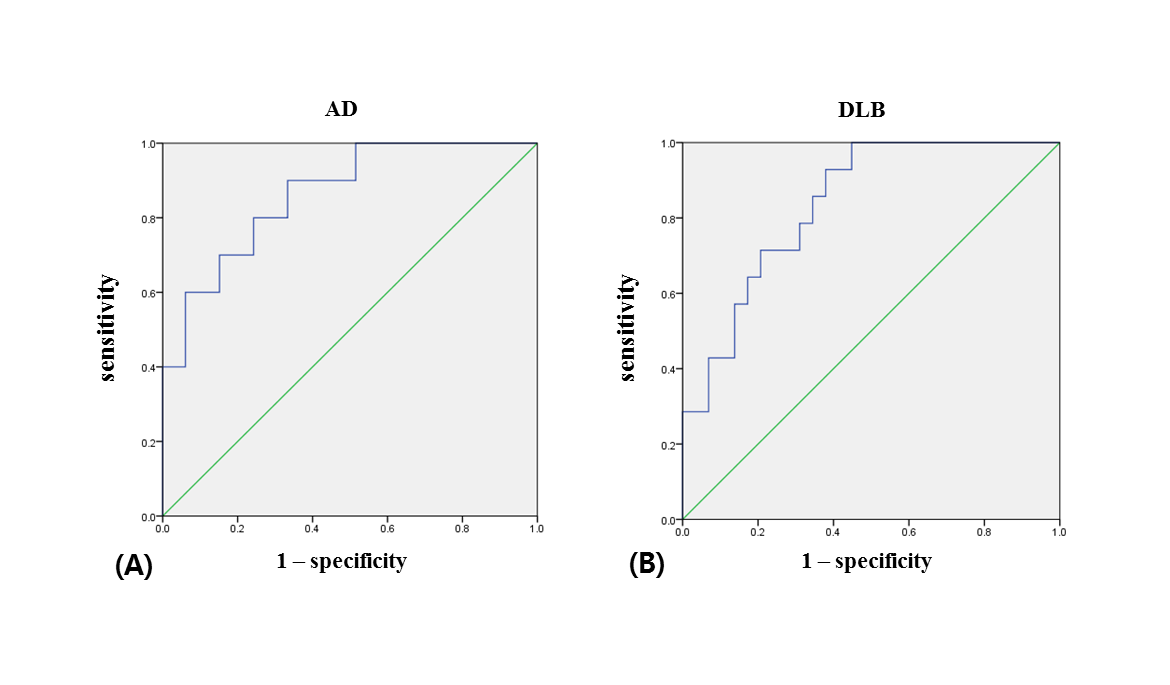
To evaluate differences among the groups, normalized deep gray matter volumes and their mean susceptibility values were compared using a one-way analysis of covariance (ANCOVA) with age and gender as covariates. If the univariate results indicated the presence of significant differences, a post hoc t-test with a Bonferroni correction was performed, and variables with p < 0.05 were included in a multivariate logistic regression model to determine associated imaging features for the three types of diseases. Furthermore, predicted probabilities for each subject to be diagnosed as diseased were estimated, and sensitivities and specificities were evaluated using receiver operating characteristic (ROC) curve analysis.
Results
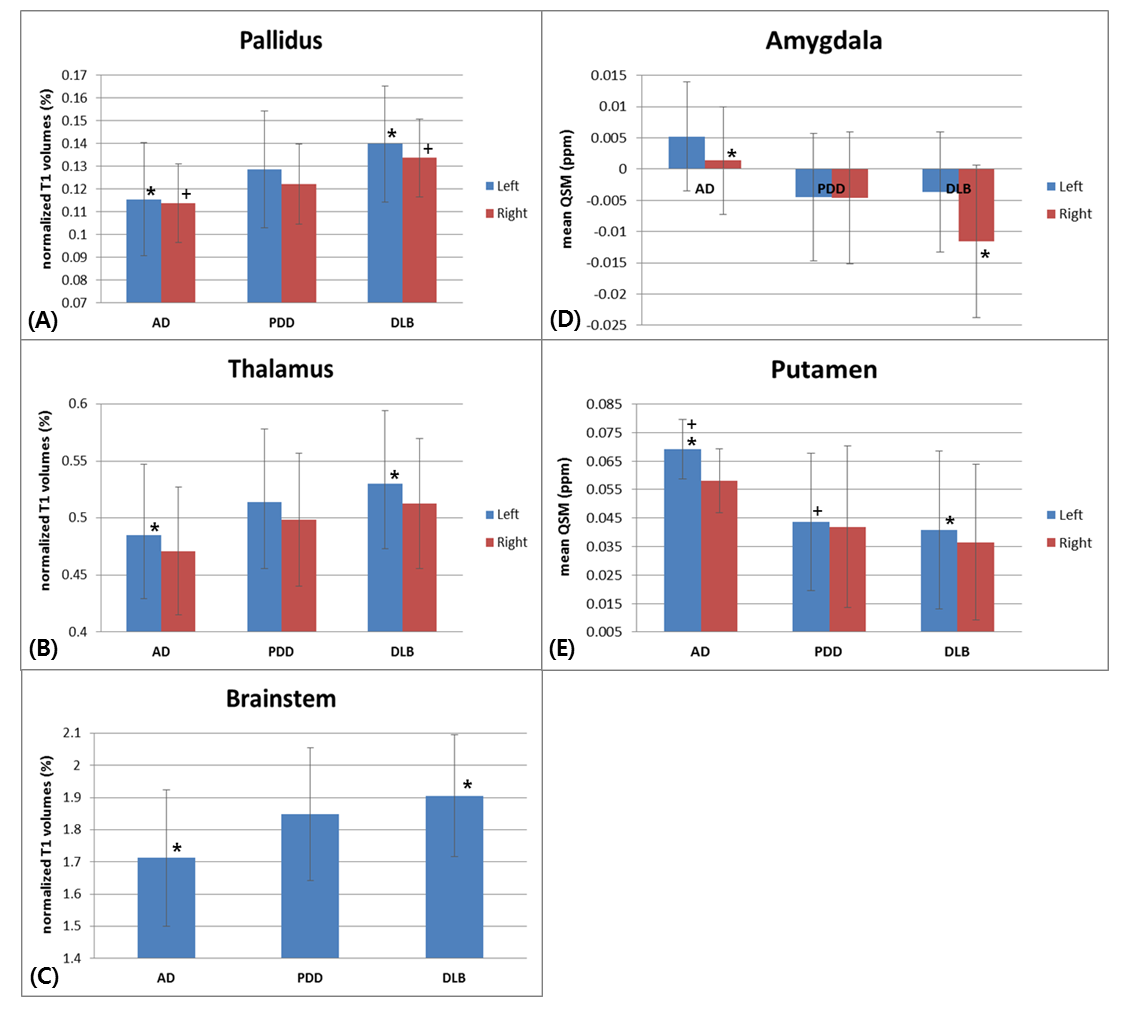
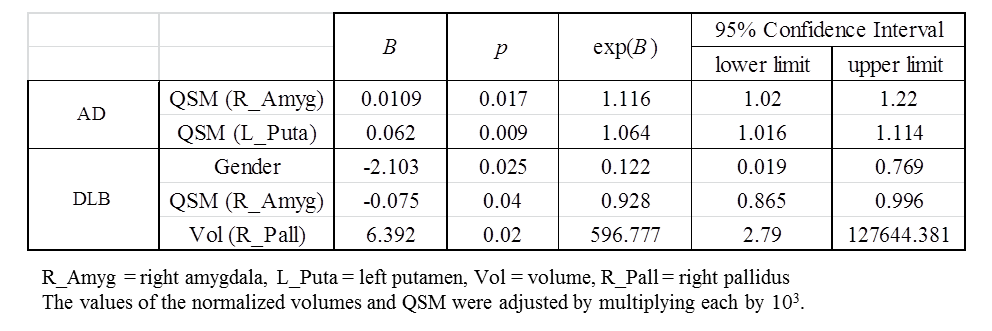
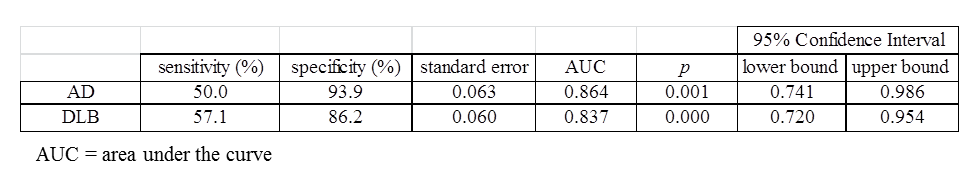
The segmented deep gray matter structures included brainstem, left and right accumbens, amygdala, caudate, hippocampus, pallidus, putamen and thalamus (Figure 1B). For volume analyses, statistically significant differences were found between AD and DLB in left (F = 3.337, p = 0.047) and right pallidus (F = 4.068, p = 0.026), left thalamus (F = 3.804, p = 0.032) and in brainstem (F = 4.426, p = 0.020). For QSM, the differences were found between AD and DLB in right amygdala (F = 3.566, p = 0.039) and also between AD and PDD in left putamen (F = 3.562, p = 0.039) (Figure 2). Table 1 illustrates the logistic regression analysis results, indicating that QSM of right amygdala and left putamen were associated with AD, while gender, QSM of right amygdala and volume of right pallidus were associated with DLB. Table 2 and Figure 3 display the ROC curve analysis results based on the predicted probabilities estimated from the binary logistic regression model.Discussion and Conclusion
Our study successfully characterized AD, DLB and PDD using deep gray matter structures of T1 weighted images and QSM and identified the associated imaging features to diagnose AD and DLB using MR image biomarkers. In short, the AD group showed the most atrophic and paramagnetic features among the three groups, while DLB was relatively diamagnetic in most parts of the deep gray matter regions.Acknowledgements
No acknowledgement found.References
1. Kantarci K, Avula R, Senjem ML, et al. Dementia with Lewy bodies and Alzheimer disease: neurodegenerative patterns characterized by DTI. Neurology. 2010;74(22):1814-21.
2. Li W, Wang N, Yu F, et al. A method for estimating and removing streaking artifacts in quantitative susceptibility mapping. Neuroimage. 2015;108:111-22.
3. Li W, Wu B, Batrachenko A, et al. Differential developmental trajectories of magnetic susceptibility in human brain gray and white matter over the lifespan. Hum Brain Mapp. 2014;35(6):2698-713.
Figures