4136
Longitudinal progression of white matter deficits in Young Onset Alzheimer's Disease and Its Syndromic Variants using NODDI1Department of Computer Science and Centre for medical image computing, University College London, London, United Kingdom, 2Department of Neurodegenerative disease, Institute of Neurology, University College London, London, United Kingdom, 3Neuroradiological Academic Unit, Department of Brain Repair and Rehabilitation, UCL Institute of Neurology, London, UK, University College London, London, United Kingdom, 4Lysholm Department of Neuroradiology, National Hospital for Neurology and Neurosurgery, UCLH NHS Foundation Trust, London, UK, University College London, 5Lysholm Department of Neuroradiology, National Hospital for Neurology and Neurosurgery, UCLH NHS Foundation Trust, London, UK, University College London, London, United Kingdom
Synopsis
Young Onset Alzheimer's disease (YOAD) is characterised by its syndromic diversity, which may be underpinned by different patterns of white matter (WM) network breakdown. This prompts considerable interest in studying WM. We have previously shown that NODDI, a multi-shell diffusion MRI technique, is more sensitive at detecting WM changes in YOAD than standard DTI and demonstrated unique profiles of WM deficits in its syndromic variants. Here we investigated longitudinal WM changes in YOAD patients using NODDI, and explored the patterns of longitudinal WM changes associated with syndromic variants using tract-based spatial statistics (TBSS).
Background
Patients with Young Onset Alzheimer's disease (YOAD) have symptom onset less than 65 years old. The characteristic syndromic diversity of YOAD may be underpinned by different patterns of white matter (WM) network breakdown1-5. Previous diffusion tensor imaging (DTI) studies in YOAD patients showed decreased fractional anisotropy and increased mean diffusivity in WM6-8. Whilst sensitive to WM microstructure changes, DTI indices are not specific to tissue properties (e.g., neurite density, which might be one of the main changes during the neurodegenerative process). Neurite orientation dispersion and density imaging (NODDI)9, a novel diffusion MRI technique, estimates the key tissue-specific microstructural factors contributing to the DTI indices, including neurite density, neurite orientation dispersion and fraction of free water. We have previously used NODDI, to demonstrate different profiles of WM damage in YOAD syndromic subgroups10. Here, we aim to investigate the potential utility of NODDI indices for detecting longitudinal WM changes in YOAD and its subtypes.Methods
Subjects: 17 controls (age:60.7±5.7yrs, male/female:10/11) and 24 YOAD patients (age:60.6±5.1yrs, male/female:14/19, age at symptom-onset:55.0±4.1yrs), comprising 7 individuals with Posterior Cortical Atrophy (PCA)11 and 17 with typical memory-led AD (tAD)12, were scanned twice, approximately one-year apart on the same 3T Siemens Trio scanner.
Diffusion MRI acquisition: Subjects were scanned using a three-shell diffusion imaging sequence optimised for NODDI (64, 32, 8 diffusion-weighted directions at b=2000, 700 and 300s/mm2; 14 b=0 images; 55 slices; voxel size 2.5x2.5x2.5mm3; TR/TE=7000/92ms; Acquisition Time 15 mins).
Image Analysis: After motion and eddy-current distortion correction using FSL13, NODDI and tensor models were fitted using NODDI toolbox14 and FSL respectively. An optimised longitudinal framework15 implemented in DTI-TK16 was used for spatial normalization. To depict the unique patterns of WM deficits over time across YOAD syndromic variants, we first performed cross-sectional group comparisons between control and YOAD subgroups at each time point using Tract-Based Spatial Statistics (TBSS)17. To quantify the rate of progression in YOAD, we again used TBSS to compare annualised rate of change in NODDI indices across controls and YOAD subgroups. The annualised rate of change was computed as follow-up NODDI indices minus those at baseline divided by the between-scan interval. For each group comparison, we performed 5000 permutations, included age and gender as covariates, and corrected for multiple comparisons using Threshold-Free Cluster Enhancement (TFCE) at p<0.05.
Results
1) NODDI indices in YOAD syndromic variants
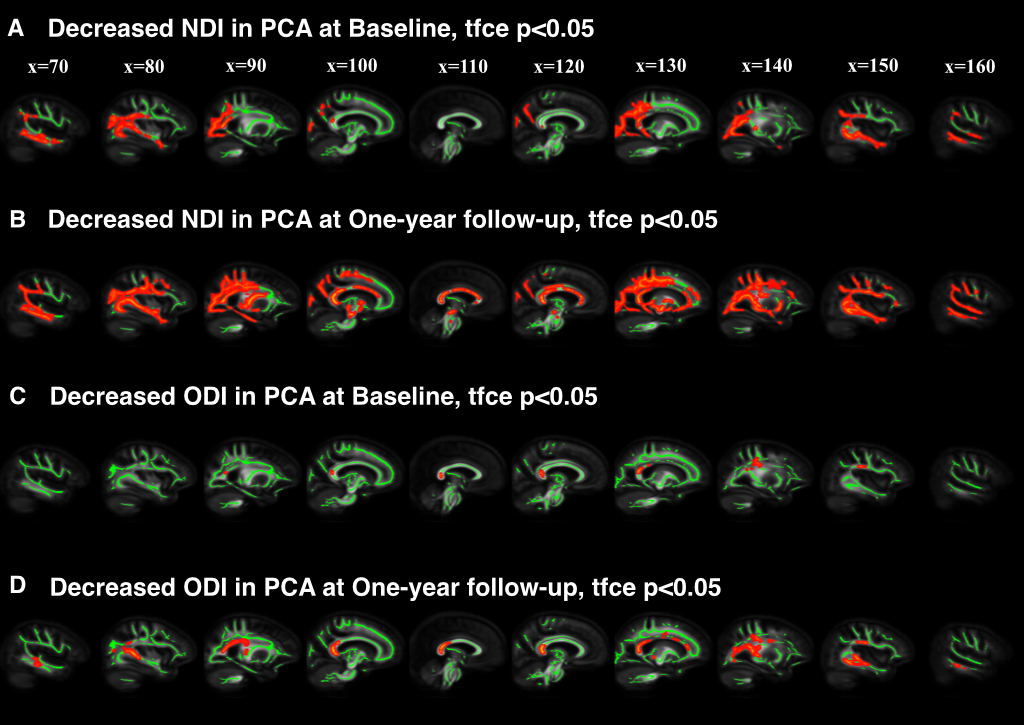
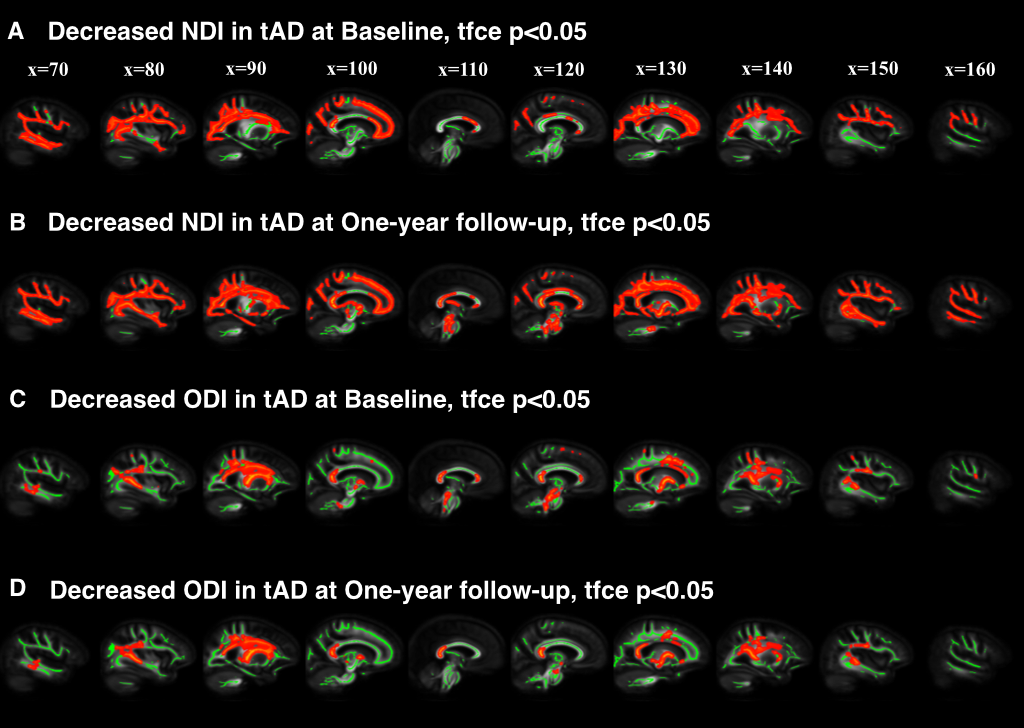
At baseline, compared to controls, we found decreased neurite density index (NDI) in 1) posterior and temporal WM area of PCAs(Figure 1A); 2) widespread cortical WM in tADs (Figure 2A) At follow-up, compared to controls, these changes in both groups became much more marked, extending to 1) the parietal and deep WM in PCAs (Figure 1B); 2) deep WM in tADs (Figure 2B). We found decreased orientation dispersion index (ODI) at both time points in 1) focal central WM tracts in PCAs, e.g., corpus callosum (Figure 1C-D); 2) focal central WM tracts in tADs (Figure 2C-D). No group difference between PCAs and tADs was found, perhaps reflecting the smaller sample size of PCA than tAD.
2) Annualised rate of change in NODDI indices in YOAD syndromic variants
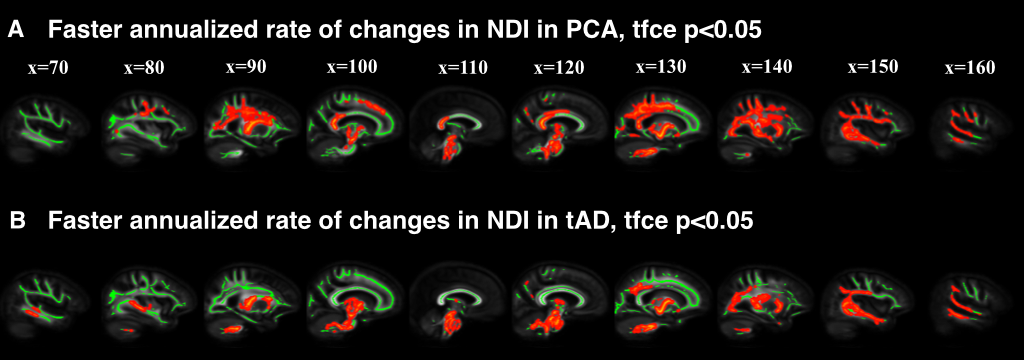
We found NDI alone showed sensitivity to the progression of WM deficits in YOAD. Compared to controls, YOAD syndromic variants showed different patterns of annualised rate of change in NDI. In PCA group, maximum annualised rate of changes were in parietal and deep WM (Figure 3A). By contrast, tAD group showed highest annualised rate of change in deep WM (Figure 3B).
Discussion
This study demonstrated that NODDI can be used to reveal distinct profiles of longitudinal WM damage in YOAD syndromic variants. With NDI, compared to controls, 1) PCAs exhibited not only unique posterior WM deficits at baseline and widespread WM deficits at follow-up, but also a posterior-anterior progression trend which is consistent with the pathological focus starting focally within posterior brain regions and spreading to more diffuse brain regions as the disease progresses; 2) tADs showed a much more widespread WM deficit at baseline, with further widespread distribution of WM deficits at the one-year follow-up (similar to PCAs). In contrast to PCAs, tADs had a superior-inferior progression trend. Decreased ODI in focal WM suggests the neurodegenerative process might involve the reorganization of those WM tracts. These findings suggest that although the initial atrophy patterns of YOAD syndromic variants are different, as the disease progresses, they may converge towards similar whole brain atrophy. In summary, NODDI may be a powerful technique of tracking disease progression in Alzheimer’s disease and other neurodegenerative diseases.Acknowledgements
The authors thank all patients and controls for their participation. The Dementia Research Centre is supported by Alzheimer's Research UK, Brain Research Trust, and The Wolfson Foundation. This work was supported by the NIHR Queen Square Dementia Biomedical Research Unit and the NIHR UCL/H Biomedical Research Centre. DA and HZ are supported by EPSRC (EP/L022680/1). SC is supported by grants from ESRC/NIHR (ES/L001810/1), EPSRC (EP/M006093/1) and an Alzheimer’s Research UK Senior Research Fellowship. DC is supported by grants from the Alzheimer Society (AS-PG-15-025), Alzheimer’s Research UK (ARUK-PG2014-1946) and MRC (MR/M023664/1). NCF is a NIHR senior investigator. MM is supported by the UCL Leonard Wolfson Experimental Neurology Centre (PR/ylr/18575) and receives funding from Alzheimer’s Society (AS-PG-15-025). SO receives funding from the EPSRC (EP/H046410/1, EP/J020990/1, EP/K005278), the MRC (MR/J01107X/1), the EU-FP7 project VPH-DARE@IT (FP7-ICT-2011-9-601055), the NIHR Biomedical Research Unit (Dementia) at UCL and the National Institute for Health Research University College London Hospitals Biomedical Research Centre (NIHR BRC UCLH/UCL High Impact Initiative- BW.mn.BRC10269). JMS is supported by EPSRC (EP/J020990/1), MRC (CSUB19166), ARUK (ARUK-Network 2012-6-ICE; ARUK-PG2014-1946), and European Union’s Horizon 2020 research and innovation programme (Grant 666992). DLT is supported by the UCL Leonard Wolfson Experimental Neurology Centre (PR/ylr/18575). JZ is supported by China Scholarship Council.References
1. Seeley, W.W., et al., Neurodegenerative diseases target large-scale human brain networks. Neuron, 2009. 62(1): p. 42-52.
2. Warren, J.D., et al., Molecular nexopathies: a new paradigm of neurodegenerative disease. Trends Neurosci, 2013. 36(10): p. 561-9.
3. Pievani, M., et al., Functional network disruption in the degenerative dementias. Lancet Neurol, 2011. 10(9): p. 829-43.
4. Raj, A., A. Kuceyeski, and M. Weiner, A network diffusion model of disease progression in dementia. Neuron, 2012. 73(6): p. 1204-15.
5. Zhou, J., et al., Predicting regional neurodegeneration from the healthy brain functional connectome. Neuron, 2012. 73(6): p. 1216-27.
6. Canu, E., et al., White matter microstructural damage in Alzheimer's disease at different ages of onset. Neurobiol Aging, 2013. 34(10): p. 2331-40.
7. Caso, F., et al., White Matter Degeneration in Atypical Alzheimer Disease. Radiology, 2015: p. 142766. 8. Cerami, C., et al., Brain changes within the visuo-spatial attentional network in posterior cortical atrophy. J Alzheimers Dis, 2015. 43(2): p. 385-95.
9. Zhang, H., et al., NODDI: practical in vivo neurite orientation dispersion and density imaging of the human brain. Neuroimage, 2012. 61(4): p. 1000-16.
10. Slattery, C., et al., Neurite orientation dispersion and density imaging (NODDI) in young onset Alzheimer’s disease and its syndromic variants. Alzheimer’s & Dementia: The journal of the Alzheimer’s Association, 2015.
11. Tang-Wai, D.F., et al., Clinical, genetic, and neuropathologic characteristics of posterior cortical atrophy. Neurology, 2004. 63(7): p. 1168-74.
12. McKhann, G.M., et al., The diagnosis of dementia due to Alzheimer’s disease: recommendations from the National Institute on Aging-Alzheimer’s Association workgroups on diagnostic guidelines for Alzheimer’s disease. Alzherimer’s & dementia: the journal of the Alzheimer’s Association 7(3), 263-9.
13. Jenkinson, M., et al., FSL. NeuroImage, 2012. 62(2): p. 782-790. 14.https://www.nitrc.org/projects/noddi_toolbox/;
15. Keihaninejad, S., et al., Au unbiased longitudinal analysis framework for tracking white matter changes using diffusion tensor imaging with application to Alzheimer’s disease
16. Zhang, H., et al., Deformable registration of diffusion tensor MR images with explicit orientation optimization. Med Image Anal, 2006. 10(5): p. 764-85.
17. Smith, S.M., et al., Tract-based spatial statistics: voxelwise analysis of multi-subject diffusion data. Neuroimage, 2006. 31(4): p. 1487-505.
Figures