4135
Using time-encoded pCASL to study vascular function in a mouse model of Alzheimer’s disease1Radiology, Leiden University Medical Center, Leiden, Netherlands, 2Human Genetics, Leiden University Medical Center, Leiden, Netherlands, 3Grenoble Institut des Neurosciences, Université Grenoble Alpes, Grenoble, France, 4Inserm U836, Grenoble, France, 5Bruker Biospin, Ettlingen, Germany
Synopsis
Cerebral Blood Flow (CBF) as measured with ASL-MRI is an emerging Alzheimer’s Disease (AD) biomarker. However, vascular pathology may delay the arterial transit time (ATT) of the magnetic label and influence the measurement. Thus, ATT estimation can potentially reveal vascular pathology and benefit CBF quantification. To evaluate CBF and ATT as read-out markers in AD mouse models, time-encoded ASL was used to measure ATT and CBF in the APPswe/PS1ΔE9 AD model. No major CBF difference was found when ATT was taken into account. However, AD mice showed increased ATT in the thalamus and decreased CBF in the cortex and striatum.
Introduction
Both in the clinic and in animal models, Cerebral Blood Flow (CBF) as measured with Arterial Spin Labeling (ASL)-MRI has been shown to decrease with advancing Alzheimer’s Disease (AD) and Cerebral Amyloid Angiopathy (CAA), showing the potential of CBF to develop into a biomarker1,2. However, the Arterial Transit Time (ATT) – the time that it takes for the blood to travel from the labeling site to the imaging slices – is a possible confounder in the CBF quantification3. Underlying vascular pathology may increase the ATT and thereby lead to an underestimation of CBF in the patient group. Apart from that, ATT as a measure for vascular pathology is interesting in itself. Recently, a time-encoded pCASL (te-pCASL) sequence has been designed to measure ATT in mice4, but has only been applied to wildtype (WT) mice. In this research, we show ATT and CBF in the transgenic (TG) APPswe/PS1ΔE9 mouse model of AD at advanced age and with high parenchymal amyloid burden.Methods
APPswe/PS1ΔE9 mice on a C57BL6/C3 background were scanned on a 7T Bruker Pharmascan. The WT and TG group consisted of 6 mice (4 females; 25.9 ± 1.3 months old) and 5 mice (5 females; 23.5 ± 1.3 months old) respectively. The animals were scanned under 1,3-2% isoflurane to keep breathing rates between 90-130bpm; physiological temperature was maintained with a feedback-coupled waterbed.
Labeling pulses were applied 1.0cm from isocenter (3,5μT B1; 400/800μs pulse duration/interval). To correct for off-resonance effects, the pCASL-interpulse phases were optimized during pre-scans. Two different labeling schemes were used:
- Standard pCASL. The 3s-labeling pulse was followed by 300ms post-labeling delay (PLD). 60 pairs of label/control images were acquired within 7 minutes (TR=3498ms).
- Te-pCASL. 50ms sub-boli were created and encoded with a Hadamard-12 matrix. A final PLD of 30ms was added at the end of the scheme. This resulted in 11 effective PLDs (30, 80, 130…530ms). The scheme was repeated 45 times (7 minutes; TR=778ms).
Both were followed by a single-shot spin-echo EPI (TE=17ms, in-plane resolution=224um², slice thickness=1.5mm, 3 slices, slice gap=1mm). To support CBF-quantification, T1-maps were acquired with an inversion recovery EPI sequence (18 inversion times) and labeling efficiency was measured 3mm downstream of the labeling plane with a flow-compensated, ASL-encoded FLASH. By decoding the Hadamard-encoded ASL-signal, individual sub-bolus images were created from the te-pCASL measurements. The signal in each voxel was fitted to Buxton’s general kinetic perfusion model5 after which ATT was estimated. The standard pCASL was used for CBF quantification, also with Buxton’s model, in two different ways: with the fitted ATT values and with an assumed ATT value of 300ms, to compare the fit with standard acquisition. ROIs were manually drawn on the raw EPIs.
Results
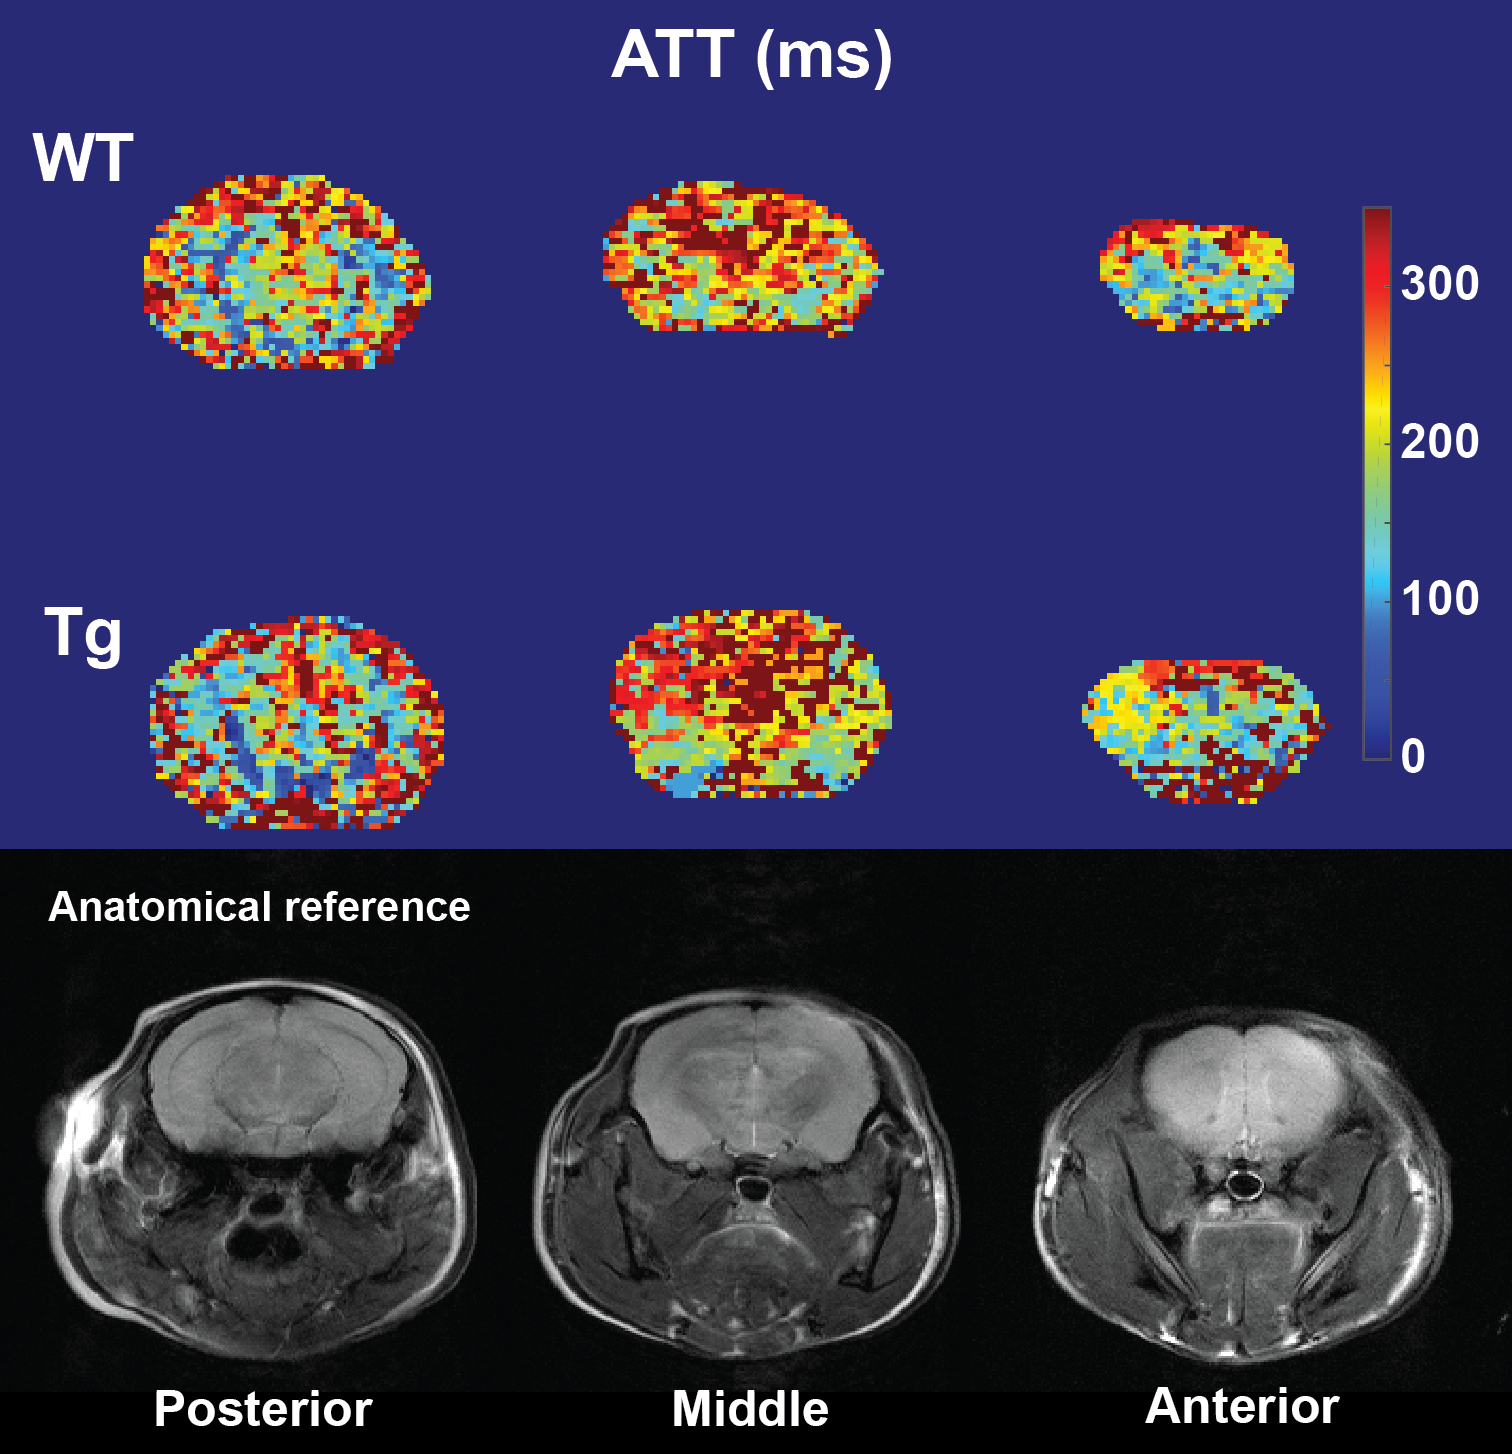
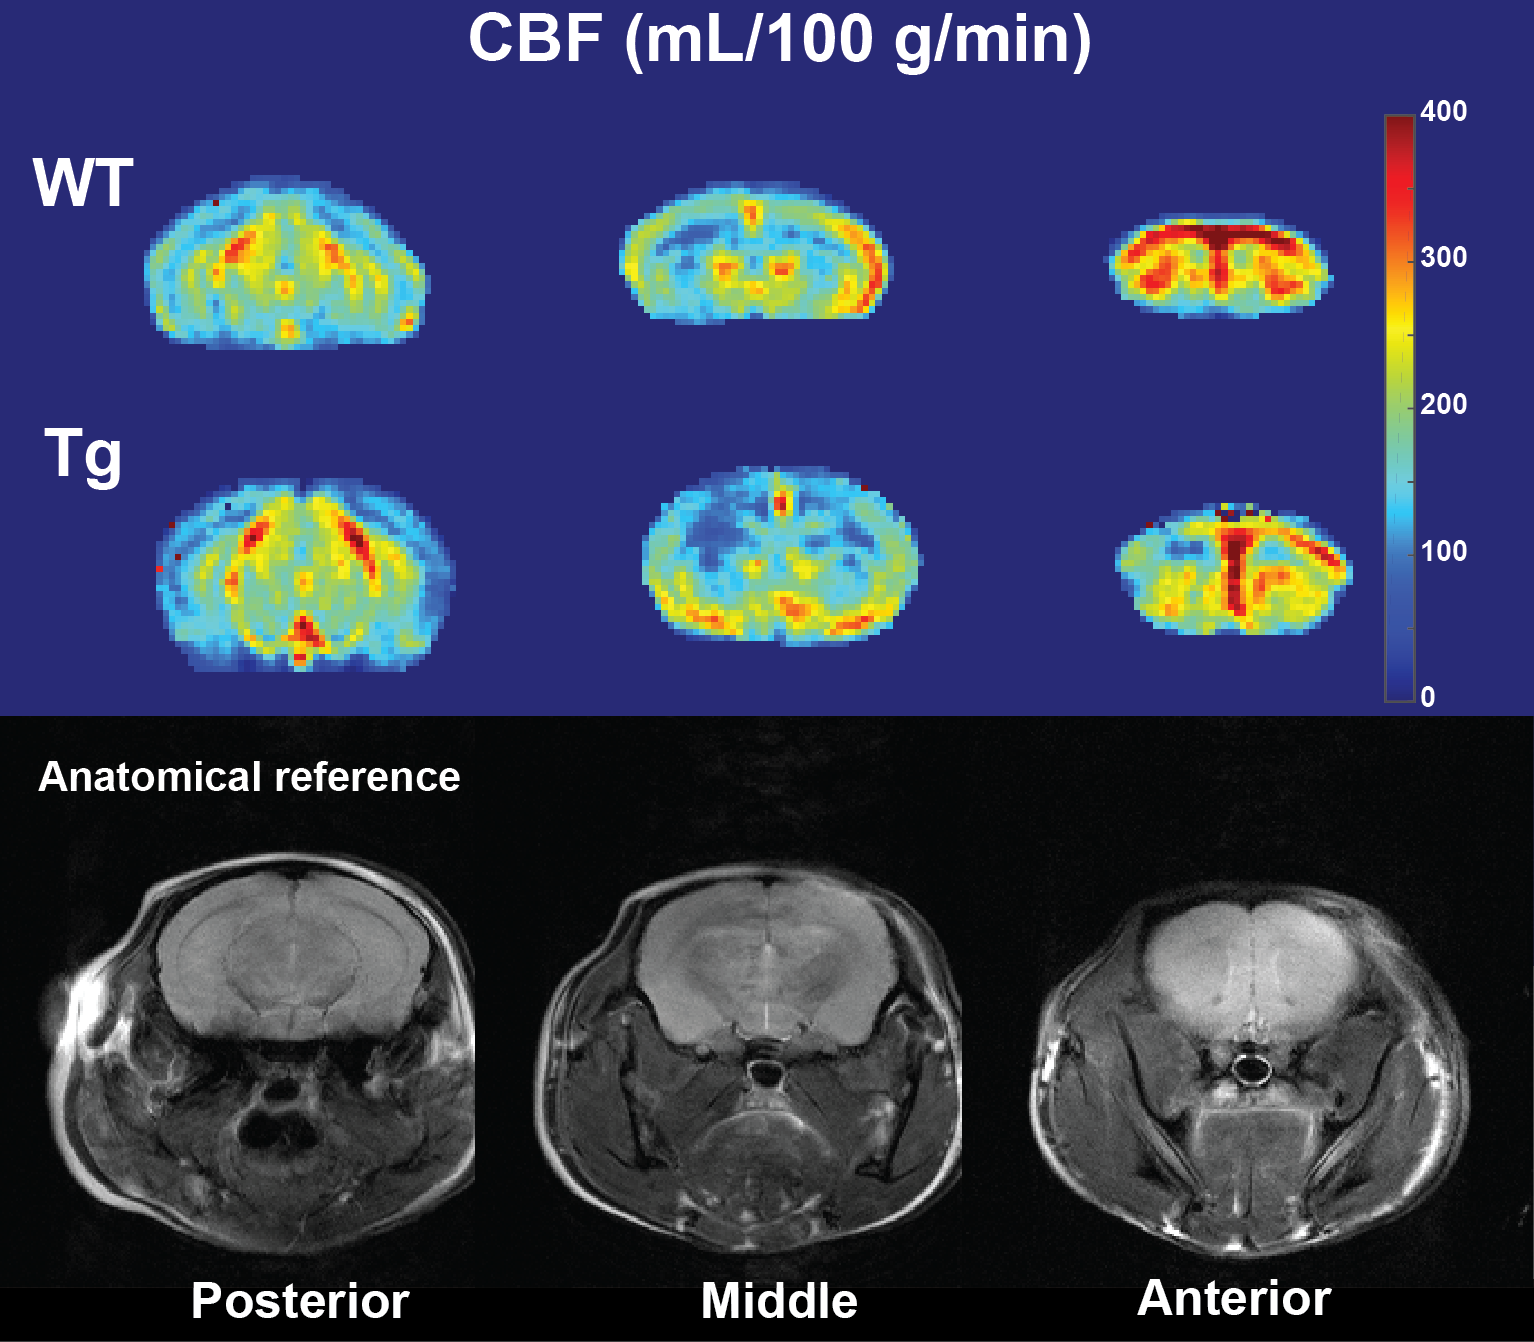
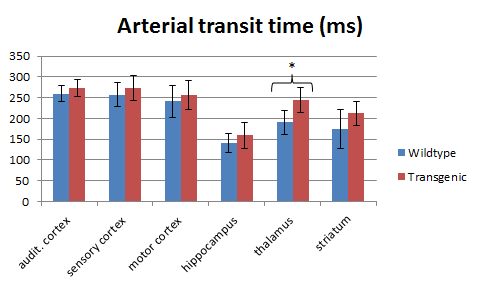
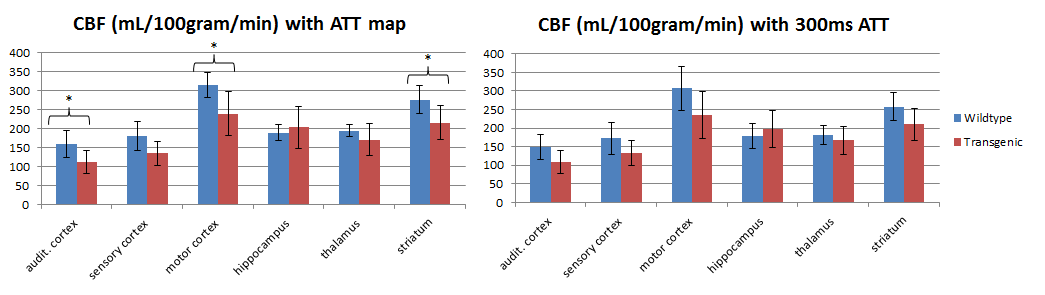
Representative examples of ATT and CBF maps (with fitted ATT values) from both groups are depicted in figures 1 and 2 respectively. Thalamic ATTs were significantly higher (p=0.02; unpaired t-test) in AD mice and a similar non-significant trend was observed for the striatum (fig.3). The CBF quantification was hardly affected by the inclusion of fitted ATT (fig.4). However, it was enough to tip the CBF reduction in AD mice just over the significance threshold (p=0,04 for three comparisons). The low sample size combined with the moderate CAA severity6 may be responsible for the weak statistical significance; future scans are planned to strengthen our data.Discussion
A considerable amount of data exists on CBF in AD mouse models. Most models, but not all, show reduced CBF, which is always confined to the cortex2,7,8,9. Maier et al.2 report reduced CBF in two models with extensive CAA, and preserved CBF in another model with hardly any CAA. However, none of these studies have used the APPswe/PS1ΔE9 model. It has moderate CAA6, which is mainly found in leptomeningeal vessels supplying cortical brain regions10. Interestingly, it is again mostly the cortical regions which show lower CBF in our data, thereby further supporting the hypothesis that loss of perfusion in AD mouse models is due to a CAA-related vascular dysfunction.
Furthermore, ATTs in APPswe/PS1ΔE9 mice were not very different from the WT mice. This indicates that the cortical CBF measurements in the APPswe/PS1ΔE9 model are not ATT-biased. Microvascular impairments in the thalamus of the APPswe/PS1ΔE9 have been reported before, which were shown to be unrelated to amyloid deposits11. These could be linked to the increased thalamic ATTs, but how exactly should be further researched. Conclusively, ATT does not seem severely affected in APPswe/PS1ΔE9 mice. However, ATT should be investigated in other AD models with a high CAA burden, and particularly in models for vascular cognitive impairment.
Acknowledgements
We thank Netherlands Organisation for Scientific Research (NWO) for funding this researchReferences
[1] Leeuwis AE et al.; Lower cerebral blood flow is associated with impairment in multiple cognitive domains in Alzheimer's disease. Alzheimers Dement. 2016; 28: S1552-5260(16)32893-X.
[2] Maier FC et al.; Longitudinal PET-MRI reveals β-amyloid deposition and rCBF dynamics and connects vascular amyloidosis to quantitative loss of perfusion. Nat Med. 2014; 20(12):1485-92.
[3] Alsop DC et al.; Recommended implementation of arterial spin-labeled perfusion MRI for clinical applications: A consensus of the ISMRM perfusion study group and the European consortium for ASL in dementia. Magn Reson Med. 2015; 73(1):spcone
[4] Hirschler L et al.; Transit time mapping in the mouse brain using time-encoded pCASL. ISMRM abstract, 2016.
[5] Buxton RB et al.; A general kinetic model for quantitative perfusion imaging with arterial spin labeling. Magn Reson Med. 1998; 40(3):383-96.
[6] Klohs J et al.; Imaging of cerebrovascular pathology in animal models of Alzheimer's disease. Front Aging Neurosci. 2014 13;6:32.
[7] Weidensteiner C et al.; Cortical hypoperfusion in the B6.PS2APP mouse model for Alzheimer's disease: comprehensive phenotyping of vascular and tissular parameters by MRI. Magn Reson Med. 2009; 62(1):35-45.
[8] Faure A et al.; Impaired neurogenesis, neuronal loss, and brain functional deficits in the APPxPS1-Ki mouse model of Alzheimer’s disease. Neurobiol. Aging 2011; 32:407–418.
[9] Poisnel G et al.; Increased regional cerebral glucose uptake in an APP/PS1 model of Alzheimer's disease. Neurobiol Aging. 2012; 33(9):1995-2005.
[10] Garcia-Alloza M et al.; Characterization of amyloid deposition in the APPswe/PS1dE9 mouse model of Alzheimer disease. Neurobiol Dis. 2006; 24(3):516-24.
[11] Zerbi V et al.; Microvascular cerebral blood volume changes in aging APP(swe)/PS1(dE9) AD mouse model: a voxel-wise approach. Brain Struct Funct. 2013; 218(5):1085-98.
Figures