4134
A promising endogenous, non-radioactive method to quantify neuroinflammation in Alzheimer Disease1Washington University in St. Louis, St. Louis, MO, United States, 2Avid Radiopharmaceuticals, Inc., Philadelphia, PA, United States
Synopsis
Accumulation of amyloid beta (Aβ) plaques and neurofibrillary tau tangles are the neuropathological hallmarks of Alzheimer disease (AD). However, increasing evidence points to the involvement of neuroinflammation in early AD and disease progression. Diffusion basis spectrum imaging (DBSI) is a novel non-invasive and non-radioactive multi-parametric diffusion MRI technique to quantify neuroinflammation in AD. We demonstrated that DBSI derived neuroinflammation marker significantly correlated with 11C-PK11195 PET imaging, a marker for microglia activation and neuroinflammation, suggesting DBSI as a promising endogenous, non-radioactive method to quantify neuroinflammation in AD.
Purpose
Accumulation of amyloid beta (Aβ) plaques and neurofibrillary tau tangles are the neuropathological hallmarks of Alzheimer disease (AD). However, increasing evidence points to a role of neuroinflammation in AD. PET tracers such as 11C-PK11195, which target the 18 kDa translocator protein, are used for imaging microglia activation in AD animal models and patients 1-3. Diffusion basis spectrum imaging (DBSI), a novel non-invasive and non-radioactive multi-parametric diffusion MRI technique, can be used to quantify white matter neuroinflammation in central nervous system diseases 4-7. In this study, we evaluated whether the DBSI derived neuroinflammation marker (DBSI cell fraction, or DBSI-CF) in patients with dementia or at risk for dementia and additional performed correlations with 11C-PK11195.
Method
Participants: Twelve participants were selected from a larger population enrolled at Knight Alzheimer’s Disease Research Center of the Washington University School of Medicine (St Louis, MO, USA), in longitudinal studies of memory and aging. PET Imaging: Baseline PK11195 PET imaging session was performed using a Siemens Biograph 40 PET/CT. The participants were positioned in the scanner followed by i.v. injection of approximately 15 mCi of PK11195, and a 60 minute 3-D dynamic PET scan was acquired and reconstructed (12 x 10 sec frames; 9 x 20 sec frames; 10 x 1 min frames; 9 x 5 min frames) using an OSEM algorithm with standard normalization, dead time, randoms, scatter, attenuation, and decay correction. A PET Unified Pipeline (PUP) (https://github.com/ysu001/PUP) was used for post processing PET data as previously described 8. DBSI Imaging: Diffusion MRI images were collected (2x2x2mm voxels, TR=14500ms, TE=102ms, multi-bvalue scheme, 23 directions and bmax = 1400s/mm2). Data were collected in two 6 minute runs on a 3.0 Tesla Trio scanner (Siemens, Erlangen, Germany). DBSI models diffusion weighted MRI signal with a linear combination of multiple tensors modeling water diffusion in both the anisotropic axonal fiber and its surrounding environment, and a full range of isotropic components with varying diffusivities.Results
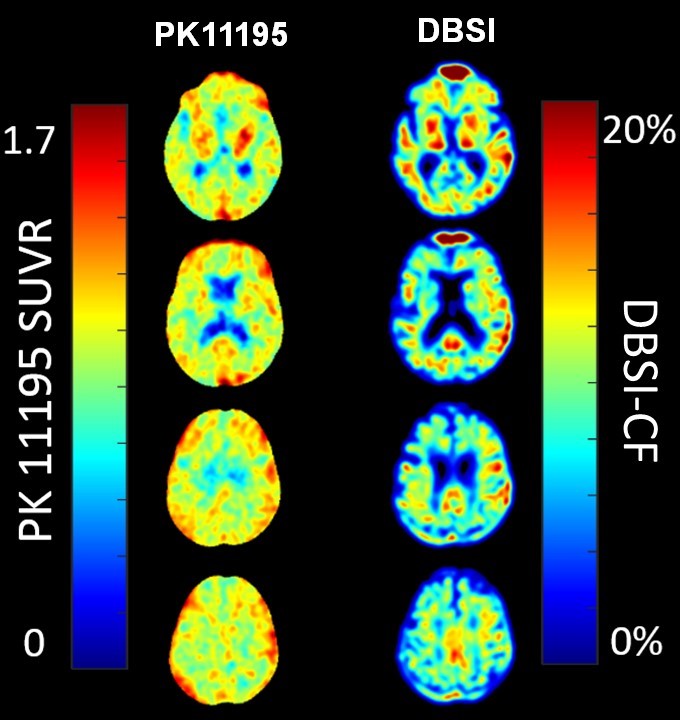
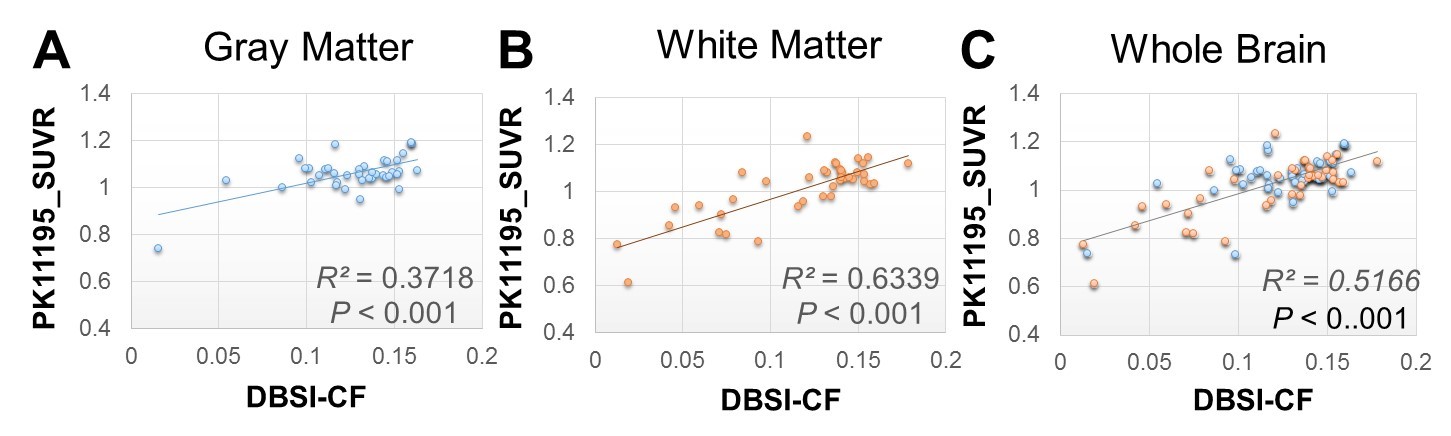
11C-PK11195 SUVR maps and DBSI-CF maps were generated on all participants. Figure 1 demonstrated that DBSI-CF maps (Fig.1 right column) have similar spatial distributions as the 11C-PK11195 SUVR maps (Fig.1 left column) from one representative participant. For the same participant, DBSI-CF significantly and positively correlated with 11C-PK11195 SUVR in 42 gray matter regions (Fig. 2A, P < 0.001) and 40 white matter regions (Fig. 2B, P < 0.001) defined by Freesurfer 5.1 based on T1-weighted MR, and in the whole brain as well (Fig. 2C, P < 0.001). The data from all twelve participants follow similar patterns.Discussion and Conclusion
We demonstrate that a 3T clinical MRl scanner running FDA-approved diffusion sequences could reliably provide endogenous, non-radioactive means to quantify neuroinflammation in AD. Larger study is currently undergoing to generalize our finding of the close correlation between DBSI neuroinflammation biomarker and 11C-PK11195 PET measure. We are also investigating the prediction power of DBSI neuroinflammation marker for AD progression in a longitudinal study.Acknowledgements
Supported by NIA P01-AG026276, P01AG003991, P50AG05681 and NMSS RG5265 A1References
1. Chauveau F, Van Camp N, Dolle F, et al. Comparative evaluation of the translocator protein radioligands 11C-DPA-713, 18F-DPA-714, and 11C-PK11195 in a rat model of acute neuroinflammation. J Nucl Med 2009;50:468-476.
2. Abourbeh G, Theze B, Maroy R, et al. Imaging microglial/macrophage activation in spinal cords of experimental autoimmune encephalomyelitis rats by positron emission tomography using the mitochondrial 18 kDa translocator protein radioligand [(1)(8)F]DPA-714. The Journal of neuroscience : the official journal of the Society for Neuroscience 2012;32:5728-5736.
3. Schuitemaker A, Kropholler MA, Boellaard R, et al. Microglial activation in Alzheimer's disease: an (R)-[(1)(1)C]PK11195 positron emission tomography study. Neurobiol Aging 2013;34:128-136. 4. Wang Y, Wang Q, Haldar JP, et al. Quantification of increased cellularity during inflammatory demyelination. Brain 2011;134:3590-3601.
5. Wang X, Cusick MF, Wang Y, et al. Diffusion basis spectrum imaging detects and distinguishes coexisting subclinical inflammation, demyelination and axonal injury in experimental autoimmune encephalomyelitis mice. NMR in biomedicine 2014;27:843-852.
6. Murphy RK, Sun P, Xu J, et al. Magnetic Resonance Imaging Biomarker of Axon Loss Reflects Cervical Spondylotic Myelopathy Severity. Spine (Phila Pa 1976) 2015.
7. Wang Y, Sun P, Wang Q, et al. Differentiation and quantification of inflammation, demyelination and axon injury or loss in multiple sclerosis. Brain 2015;138:1223-1238.
8. Su Y, Blazey TM, Snyder AZ, et al. Partial volume correction in quantitative amyloid imaging. Neuroimage 2015;107:55-64.
Figures