4132
Simultaneous measurement of regional cerebral perfusion and glucose metabolism in frontotemporal dementia.1Medical Biophysics, Lawson Health Research Institute, London, ON, Canada, 2Clinical Neurological Sciences, London, ON, Canada, 3Rigshospitalet (Copenhagen University Hospital), Copenhagen, Denmark
Synopsis
This study examined regional associations of hypoperfusion to hypometabolism in frontotemporal dementia patients using simultaneous PET/MRI acquisitions. Concordance between modalities was observed across regions. In general ASL-CBF appears to complement PET-FDG measurements
Introduction
Frontotemporal dementia (FTD) is a progressive neurodegenerative disorder, associated primarily with frontal and temporal lobes atrophy, and characterized by impairments in behavior and language1. Cerebral glucose metabolism measured using 18-flourodeoxyglucose (FDG) and positron emission tomography (PET), provide the highest specificity and sensitivity for accurately distinguishing FTD from other dementias2, particularly in the early stages where overlapping clinical features among dementias often lead to misdiagnosis and treatment failures. Recent studies have shown that perfusion MRI using arterial spin labelling (ASL) techniques can potentially provide comparable diagnostic information as PET-FDG in FTD patients3–5, since perfusion and metabolism are well matched in normal brains6 and AD7. However, reported sensitivity and specificity vary widely, possibly due to the heterogeneity of the small sample of FTD subjects, variations in ASL techniques and more importantly, the inherent limitations in sequential PET and MRI acquisitions. Using simultaneous PET/MRI, we evaluated the regional coupling of ASL cerebral blood flow (CBF) measures to PET-FDG in behavioural variant FTD (bvFTD) patients, on a group and single-subject level, to determine if ASL-CBF is a suitable substitute for further multimodal investigations in FTD with disease-specific PET tracers such as tau or neuroinflammation tracers.Methods
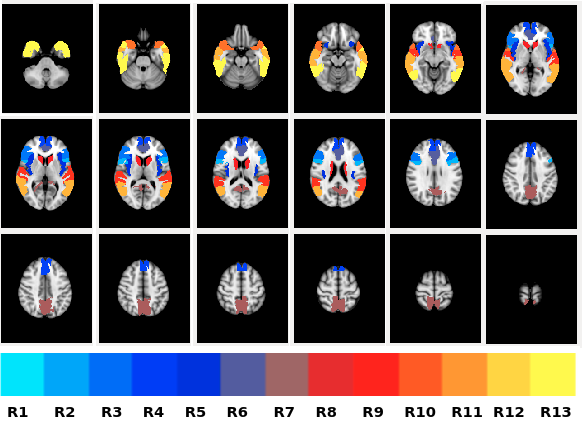
PET/MR images were acquired in 10 bvFTD patients (66 ± 9 years) and 10 controls (67 ± 7 years) on a Siemens Biograph mMR (Erlangen, Germany). Sixty minutes of dynamic list-mode PET data were acquired immediately after a bolus intravenous injection of FDG (203 ± 30 MBq; fasting blood glucose = 5.1 ± 0.8 mmol/L) and data from 30 to 45 minutes were reconstructed to one image volume (OSEM algorithm; 3 iterations, 21 subsets, 2 mm FWHM Gaussian filter, 2.5 zoom factor and 2.1 x 2.1 x 2.0 mm3 voxels). Attenuation correction was performed using an ultrashort echo time MRI sequence and an offline µ-map generation approach (RESOLUTE)8. A 3-dimensional pcASL-GRASE9 sequence was acquired few minutes after FDG injection using the following parameters; TR/TE=3500/22.76ms, PLD=1.5s, 64 label/control volumes and 3.8 x3.8x 6mm3 voxel size. Additional MRI scans included; T1-weighted anatomical MRI (1 mm3 isotropic) for spatial normalization and two ASL calibration scans (M0 image acquired using ASL sequence minus label pulse, and phase-contrast (PC) MRI).. ASL images were motion-corrected, pair-wise subtracted and global signal spikes were removed prior to time-averaging. CBF images were then generated from mean ASL signals using a single-compartment flow model. The final ASL-CBF and PET-FDG images were smoothed (10mm Gaussian filter), corrected for partial volume effects10, count normalized to mean cerebellum gray matter and spatially aligned to the standard MNI space. Group comparisons were performed on mean ASL-CBF and PET-FDG values from a priori regions-of-interest (ROI) (cf. figure1). An independent samples t-test and linear regression were performed to investigate regional group differences and associations of ASL-CBF to PET-FDG, respectively. To assess regional accuracy of ASL-CBF compared to PET-FDG in discriminating FTD patients from controls, areas under the curve (AUC) obtained from receiver operator characteristics (ROC) analysis were compared. Since, FTD is pathologically and clinically heterogenous, similarity between ASL-CBF and PET-FDG findings were assessed on a single-subject basis for each patient by comparing individual images voxel-by-voxel to the control group using a modified t-test11 (t >2, p<0.05). Similarities in ASL-CBF and PET-FDG findings were measured for each patient using the jaccard similarity coefficient, where jaccard index closer to 1 demonstrate good agreement between modalities.Results
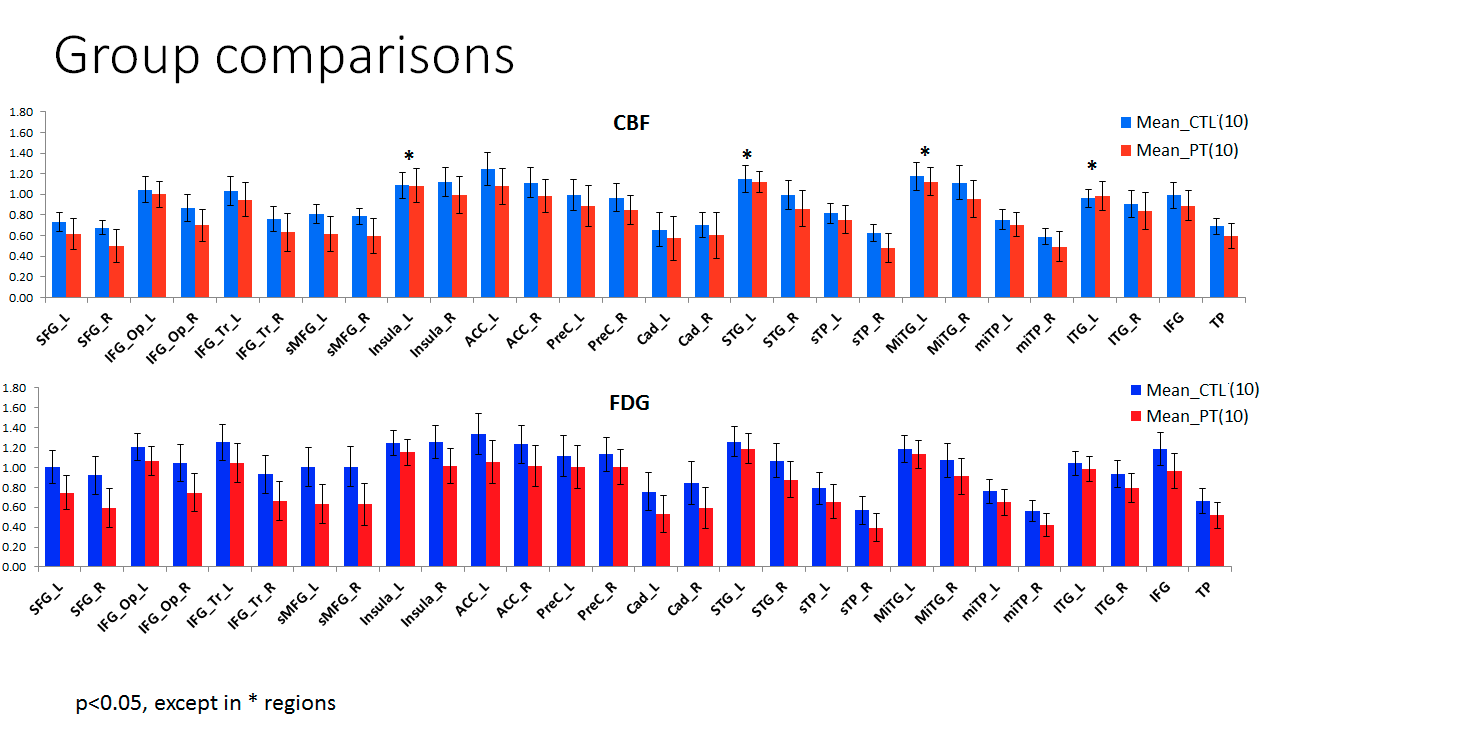
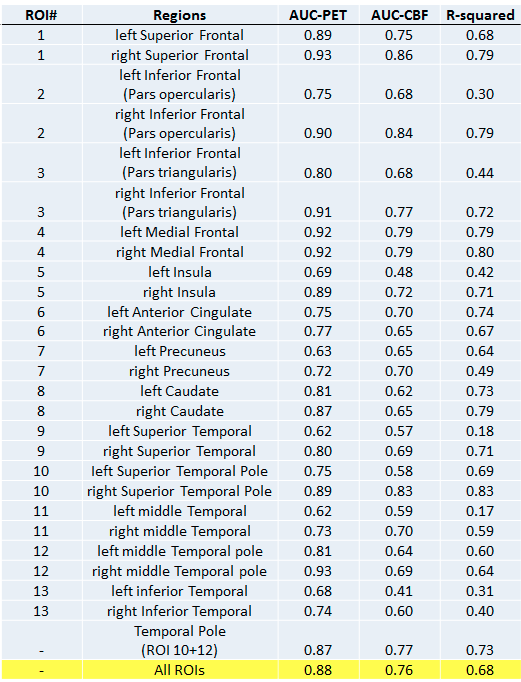
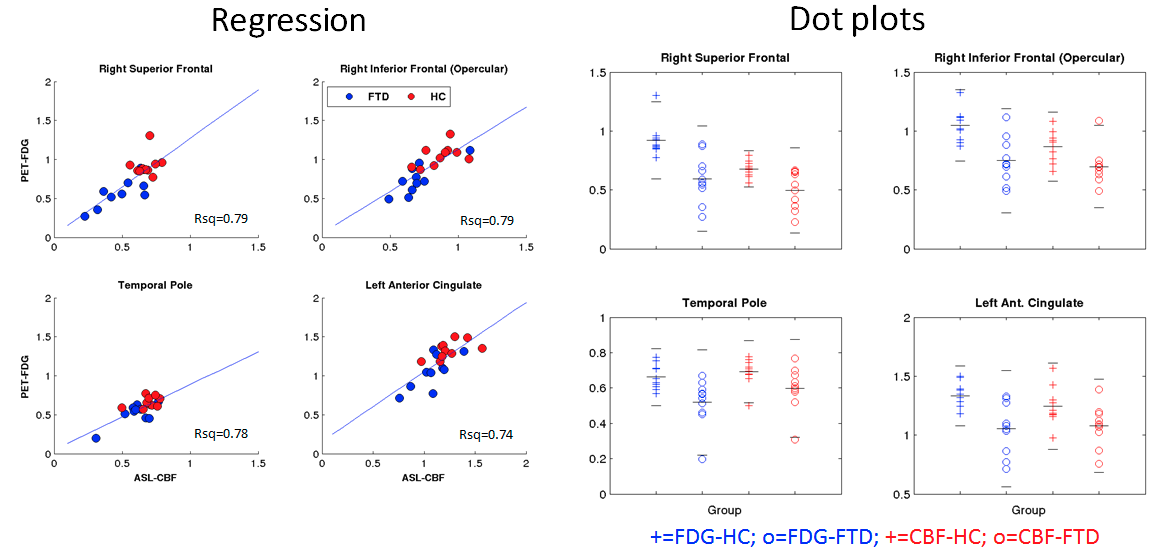
Regional differences between patients and controls for ASL-CBF and FDG-PET are shown in figure 2. Across all regions, significant hypometabolism was observed in patients compared to controls, while significant hypoperfusion was seen in the patient group in nearly all regions. The correlation coefficients between ASL-CBF and PET-FDG for each region are shown in figure 3 along with AUC values for ASL-CBF an FDG-PET. An illustration of the close association of ASL-CBF to PET-FDG is shown in four regions on figure 4. The average jaccard index across patients was 0.30 ± 0.25. Figure 5 illustrates single- subject comparisons of CBF and FDG-PET findings.DISCUSSIONS and CONCLUSIONS
This study demonstrated comparable regional findings of reduced perfusion and glucose metabolism in bvFTD patients using simultaneous ASL-CBF and PET-FDG measurements. Group-level analysis support previous evidence of matched ASL-CBF and PET-FDG performance in discriminating FTD patients from controls3,4,7. However, marked differences in regional AUC between modalities not seen in prior studies3,4,7, coupled with lower concordance rates in single-subject analysis suggest that ASL-CBF could complement PET-FDG. This finding could be an effect of minimized atrophy contribution from partial volume corrections, neglected by previous studies. Further work is need to confirm these preliminary findings.Acknowledgements
No acknowledgement found.References
1. Rohrer, J. D. & Rosen, H. J. Neuroimaging in frontotemporal dementia. Int. Rev. Psychiatry 25, 221–9 (2013).
2. Albert, M. et al. The Use of MRI and PET for Clinical Diagnosis of Dementia and Investigation of Cognitive Impairment: A Consensus Report. Alzheimer’s Assoc. Neuroimaging Work Gr. Consens. Rep. 1–15 (2005).
3. Tosun, D. et al. Diagnostic utility of ASL-MRI and FDG-PET in the behavioral variant of FTD and AD. Ann. Clin. Transl. Neurol. 3, 740–751 (2016).
4. Verfaillie, S. C. J. et al. Cerebral perfusion and glucose metabolism in Alzheimer’s disease and frontotemporal dementia: two sides of the same coin? Eur. Radiol. 3050–3059 (2015). doi:10.1007/s00330-015-3696-1
5. Moodley, K. K. et al. Simultaneous PET-MRI Studies of the Concordance of Atrophy and Hypometabolism in Syndromic Variants of Alzheimer’s Disease and Frontotemporal Dementia: An Extended Case Series. J. Alzheimer’s Dis. 46, 639–653 (2015).
6. Anazodo, U. C. et al. Feasibility of simultaneous whole-brain imaging on an integrated PET-MRI system using an enhanced 2-point Dixon attenuation correction method. Front. Neurosci. 8, 1–11 (2015).
7. Verclytte, S. et al. Cerebral Hypoperfusion and Hypometabolism Detected by Arterial Spin Labeling MRI and FDG-PET in Early-Onset Alzheimer’s Disease. J. Neuroimaging (2015). doi:10.1111/jon.12264
8. Ladefoged, C. N. et al. Region specific optimization of continuous linear attenuation coefficients based on UTE (RESOLUTE): application to PET/MR brain imaging. Phys. Med. Biol. 60, 8047–8065 (2015).
9. Günther, M., Oshio, K. & Feinberg, D. a. Single-shot 3D imaging techniques improve arterial spin labeling perfusion measurements. Magn. Reson. Med. 54, 491–8 (2005).
10. Du, A. T. et al. Hypoperfusion in frontotemporal dementia and Alzheimer disease by arterial spin labeling MRI. Neurology 67, 1215–20 (2006).
11. Crawford, J. R. & Howell, D. C. Comparing an Individual’s Test Score Against Norms Derived from Small Samples. Clin. Neuropsychol. 12, 482–486 (1998).
Figures