4131
Changes in susceptibility-weighted MRI contrast reflect differences in cortical spreading of pathology in early-onset and late-onset Alzheimer patients1Radiology, Leiden University Medical Center, Leiden, Netherlands, 2Human Genetics, Leiden University Medical Center, Leiden, Netherlands, 3Pathology, Leiden University Medical Center, Leiden, Netherlands
Synopsis
Changes in susceptibility-based MRI contrast and histological correlates of post-mortem brain tissue have been used to distinguish differences in spreading patterns of AD pathology over the cortex between AD subtypes. Susceptibility-based MRI allowed us to clearly distinguish early-onset and late-onset AD patients. The MRI contrast in the different regions closely reflected the overall severity of pathology. This study confirms iron deposition as the underlying source of MRI contrast in all cortical regions, and demonstrates that iron deposition is a putative biomarker for disease progression, with a spatial and temporal spreading pattern independent of amyloid and tau.
PURPOSE
Alzheimer’s pathology is defined by amyloid beta deposits and tau tangles. Amyloid deposits are first found in the basal parts of the frontal, occipital, and temporal lobe and gradually spread throughout the whole cortex. Tau tangles, on the other hand, are first detected in the transentorhinal cortex of the temporal lobe. Subsequently, the basal parts of the frontal and temporal lobe are affected and in the final stage the whole cortex, including the occipital lobe1,2.
Our previous 7T-imaging studies showed differences in frontal cortex between controls, late-onset (LOAD) and early-onset AD (EOAD) based on susceptibility-weighted MRI3-5. Histology showed a spatial correlation of these contrast changes with iron accumulation and gray matter myelin3.
Therefore, this study investigated the cortical spreading pattern in LOAD and EOAD patients on MRI, followed by histology.
METHODS
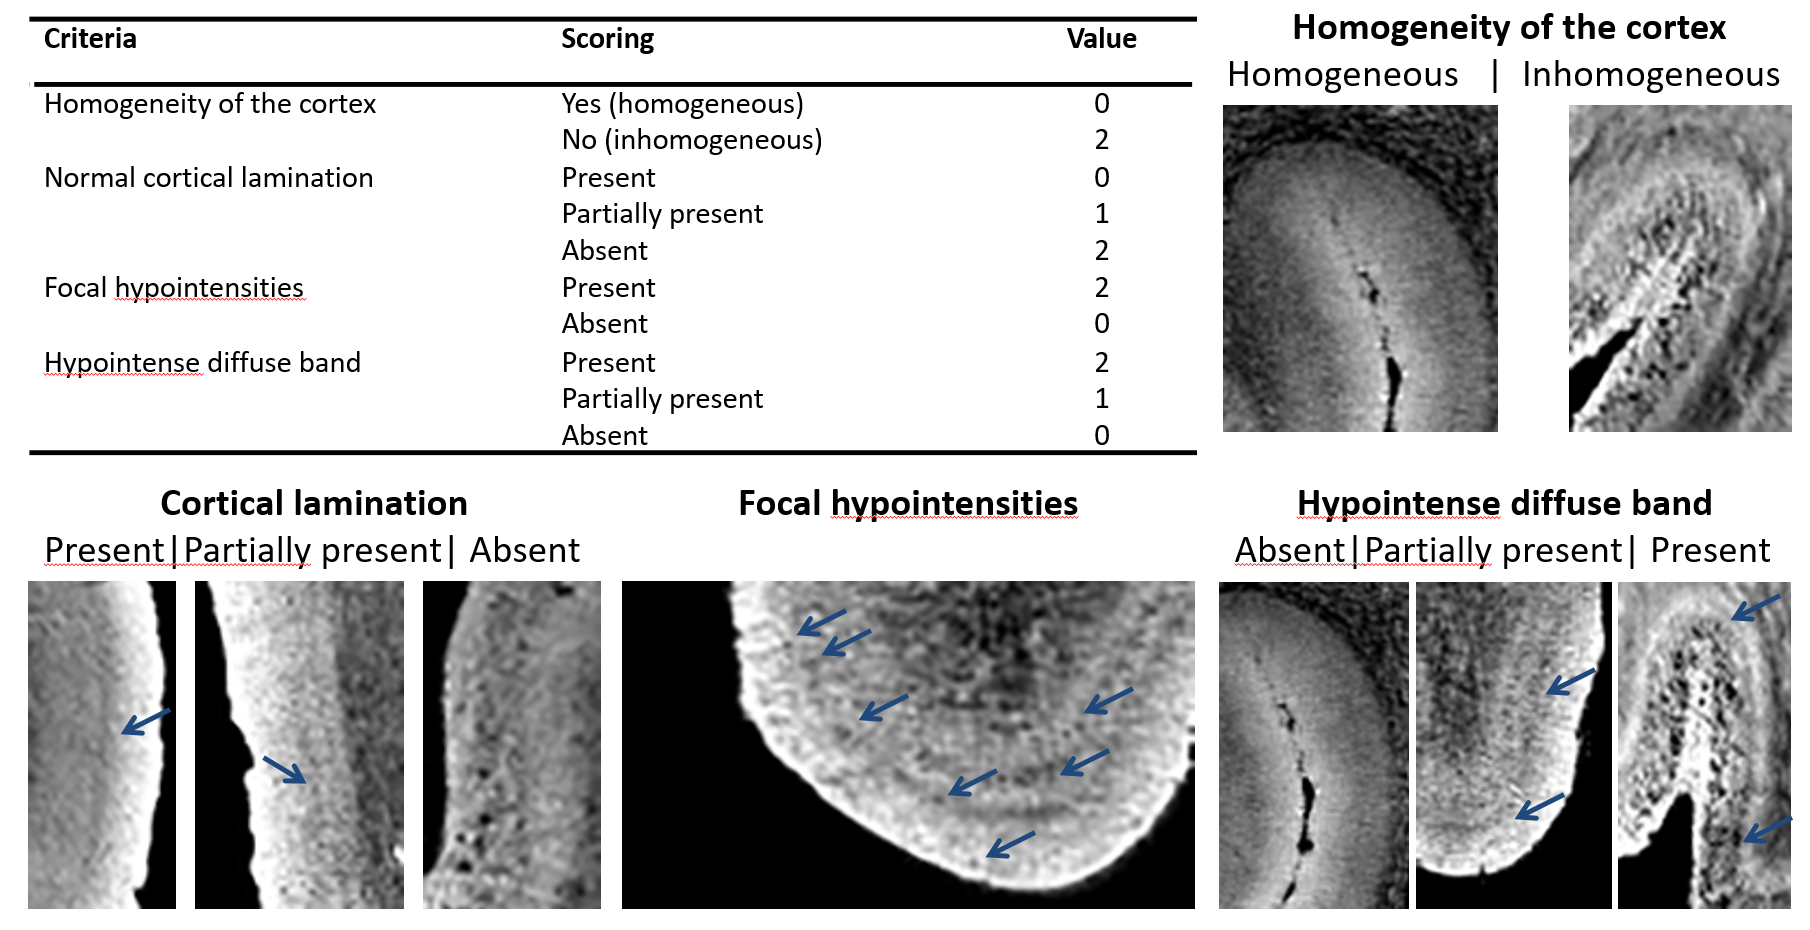
10 LOAD, 11 EOAD and 13 controls were included. Post-mortem tissue samples of the middle frontal gyrus, superior parietal gyrus, superior occipital gyrus, and middle temporal gyrus were obtained from the Netherlands Brain Bank. MRI scans were acquired on a 7T Bruker system (Bruker Biospin, Ettlingen, Germany) using a Multiple Gradient Echo sequence (TR = 75.0 ms, TE = 12.5, 23.2, 33.9 and 44.6 ms, 100 µm isotropic resolution). The acquired magnitude images were assessed using pre-defined criteria (Fig. 1)6. The same brain samples were used for histology; serial sections were cut and stained for abeta, tau, iron, and myelin. All stainings were graded using a semi-quantitative scoring system by two observers.RESULTS
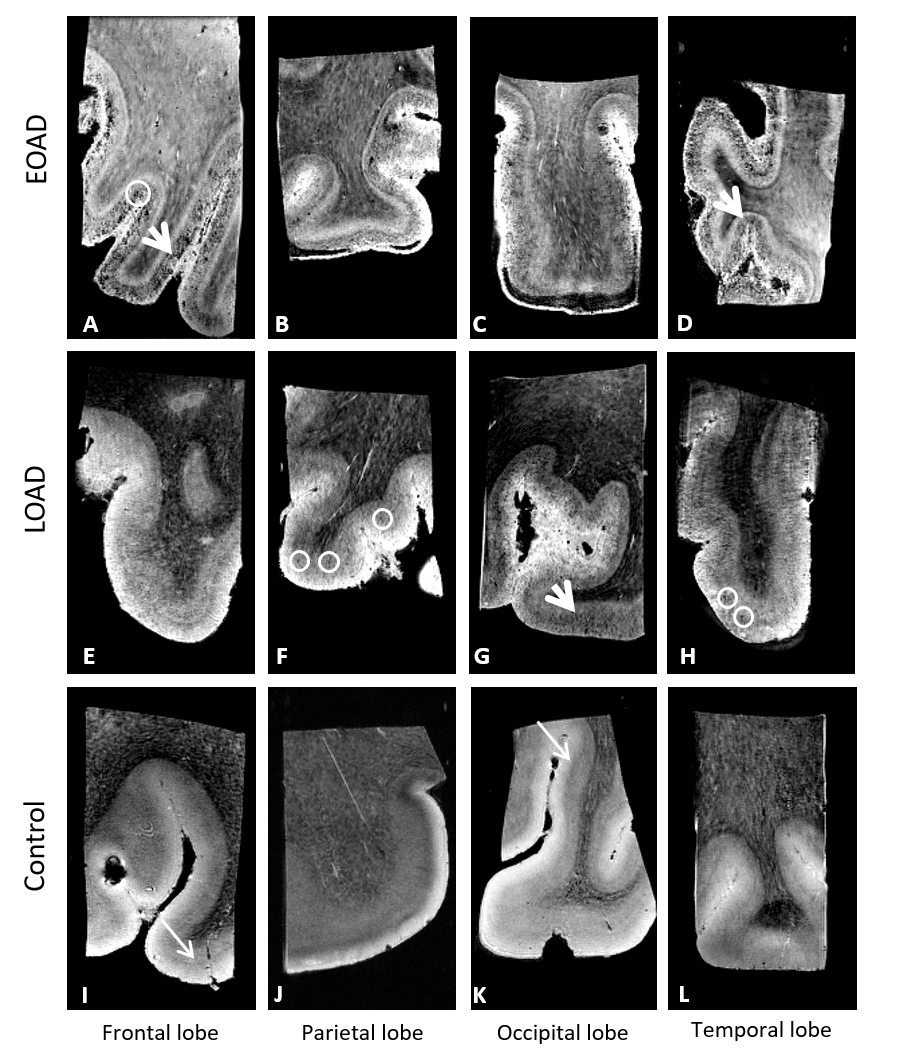
Controls showed a normal appearance of the cortex which was characterized by a homogeneous cortex, the presence of cortical lamination and the absence of a hypointense diffuse band (Fig. 2I-L). In contrast, both LOAD and EOAD patients had an abnormal cortex on MRI due to an inhomogeneous cortex and the presence of focal hypointensities and a hypointense diffuse band (Fig. 2A-H). Both patient groups had an abnormal cortex, but the EOAD patients were more severely affected.
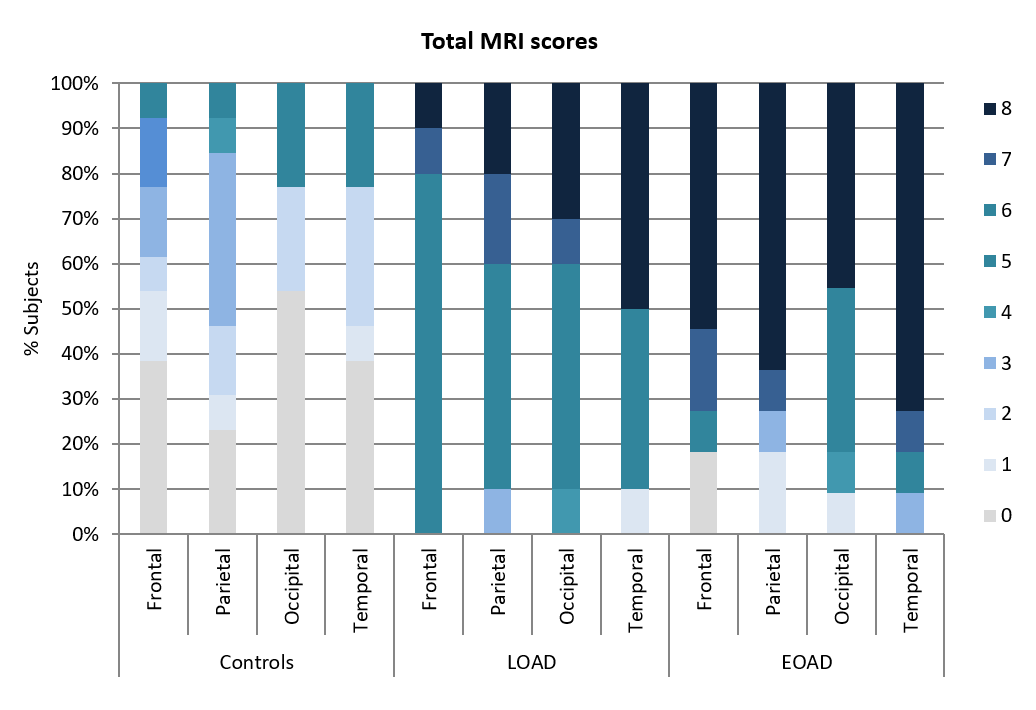
Compared to the control group, both LOAD and EOAD patients had more frequently high MRI scores indicating an abnormal cortex (Fig. 3). In LOAD patients, the temporal region was most affected followed by the other brain regions. This was not observed in the EOAD patients in whom all brain regions were heavily affected.
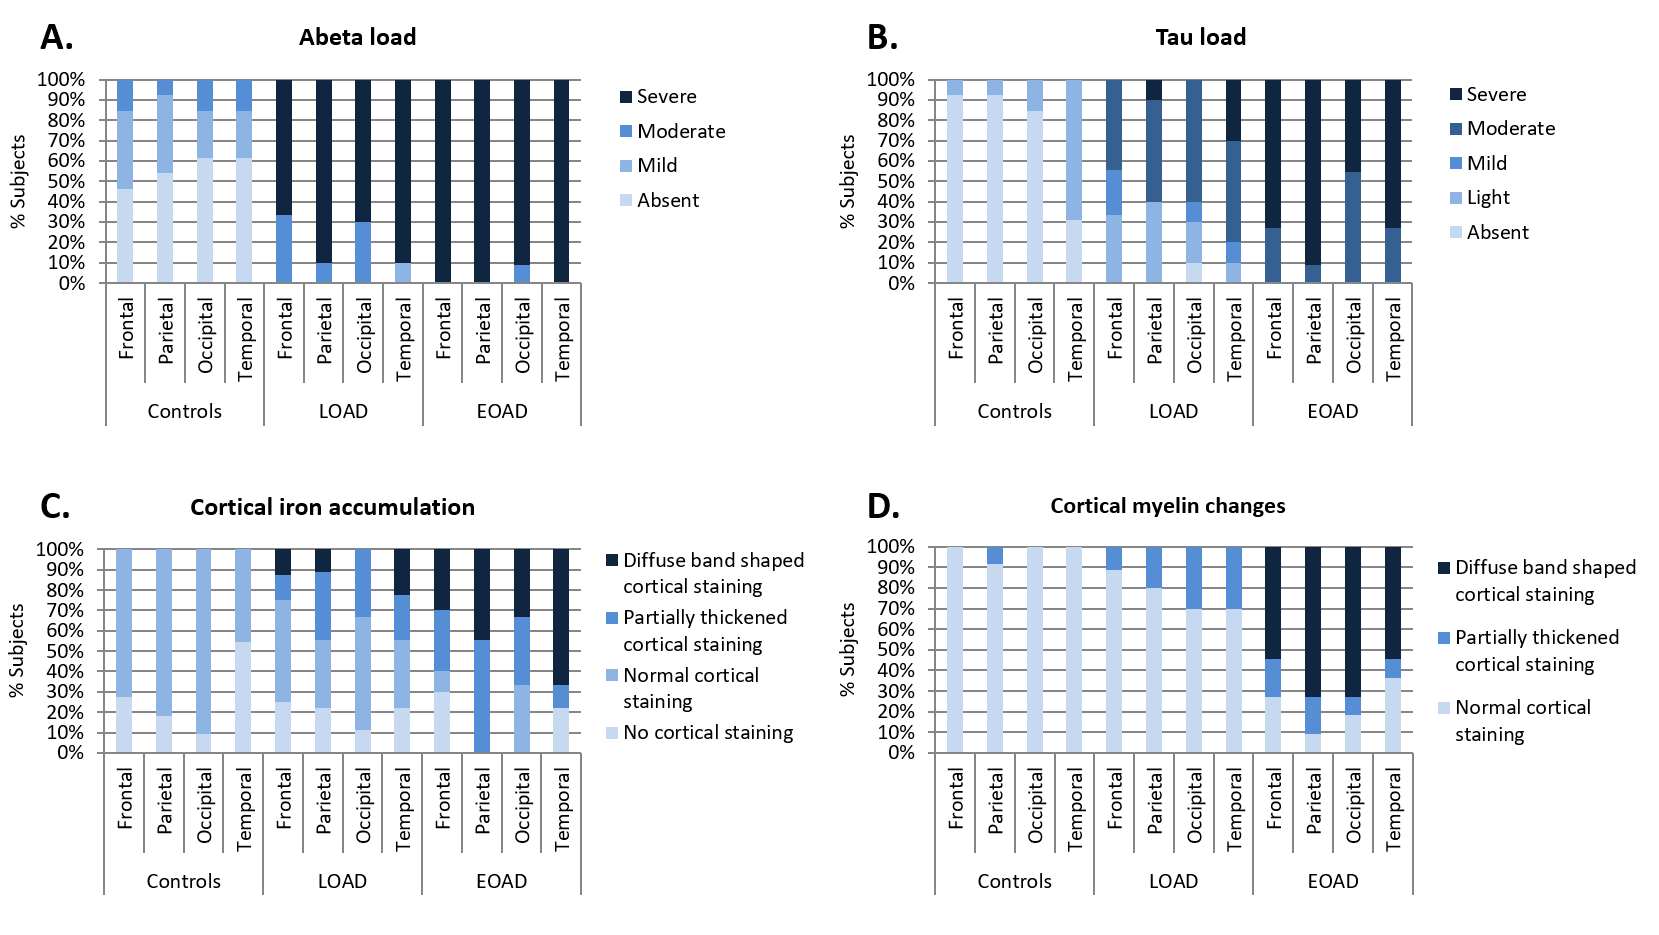
Amyloid had reached a plateau for all brain regions (Fig. 4A). Tau was predominantly present in the temporal cortex in 69% of the controls and all LOAD patients. In contrast, in all EOAD patients tau was scored as moderate to severe in all brain regions (Fig. 4B).
Increased iron accumulation and changes in cortical myelin were most frequently observed in the EOAD patients compared to controls and LOAD patients. In both EOAD and LOAD patients, the temporal region was predominantly affected by an increased iron accumulation (Fig. 4C). Cortical myelination were present throughout the different regions of the cortex (Fig. 4D).
DISCUSSION
Using histology we confirmed the well-known spreading pattern of tau pathology in our selection of controls and LOAD patients. In these post-mortem cases with advanced AD, a plateau of abeta depositions had been reached in both LOAD and EOAD patients, consistent with current hypothetical models about amyloid and tau progression7. Iron and myelin changes were more frequently observed in EOAD patients, with iron accumulation being more severe in the temporal cortex.
Susceptibility-based MRI allowed us to clearly distinguish the patients groups. The MRI contrast in the different regions closely reflected the overall severity of pathology. In previous work we already showed voxel-wise spatial correlations of MRI contrast changes with iron accumulation and gray matter myelin changes, and less with the presence of abeta and tau3. This study confirms iron deposition as the underlying source of MRI contrast in all cortical regions, and demonstrates that iron deposition is a putative biomarker for disease progression, with a spatial and temporal spreading pattern independent of amyloid and tau.
CONCLUSION
Changes in susceptibility-based MRI contrast and histological correlates have been used to distinguish differences in spreading patterns of AD pathology over the cortex between AD subtypes. Iron is increasingly being reported as a factor contributing to AD progression, and may be particularly important in subpopulations, such as ApoeE4 carriers or patients with systemic inflammation8,9. Our finding that iron accumulation is different for AD sub-types is a first step to investigate the role of iron dysregulation in individual patients.Acknowledgements
This work was financially supported by a grant from the European Union 7th Framework Program: BrainPath (PIAPP-GA-2013–612360).References
1. Braak, H. and E. Braak, Neuropathological stageing of Alzheimer-related changes. Acta Neuropathol, 1991. 82(4): p. 239-59.
2. Alafuzoff, I., et al., Staging of neurofibrillary pathology in Alzheimer's disease: a study of the BrainNet Europe Consortium. Brain Pathol, 2008. 18(4): p. 484-96.
3. Bulk, M., et al., Abstract #5043. ISMRM, 2016.
4. van Rooden, S., et al., 7T T(2)*-weighted magnetic resonance imaging reveals cortical phase differences between early- and late-onset Alzheimer's disease. Neurobiol Aging, 2015. 36(1): p. 20-6.
5. van Rooden, S., et al., Cerebral amyloidosis: postmortem detection with human 7.0-T MR imaging system. Radiology, 2009. 253(3): p. 788-96.
6. Nabuurs, R.J.A., et al., Detection of cortical changes in Alzheimer's disease at ultra-high field MRI. In preparation.
7. Jack, C.R., Jr., et al., Tracking pathophysiological processes in Alzheimer's disease: an updated hypothetical model of dynamic biomarkers. Lancet Neurol, 2013. 12(2): p. 207-16.
8. Pretorius, E., J. Bester, and D.B. Kell, A Bacterial Component to Alzheimer's-Type Dementia Seen via a Systems Biology Approach that Links Iron Dysregulation and Inflammagen Shedding to Disease. J Alzheimers Dis, 2016. 53(4): p. 1237-56.
9. Ayton, S., et al., Ferritin levels in the cerebrospinal fluid predict Alzheimer's disease outcomes and are regulated by APOE. Nat Commun, 2015. 6: p. 6760.
Figures