4127
Can measuring hippocampal atrophy over a 3 year interval with a fully automatic method be substantially less noisy than manual?1Physics and Medical Technology, VU University Medical Center, Amsterdam, Netherlands, 2Radiology, VU University Medical Center, Amsterdam, Netherlands, 3IRCCS SanGiovannidiDioFatebenefratelli, Italy, 4KarolinskaInstitutet, Stockholm, Sweden, 5University Hospitals and University of Geneva, Switzerland
Synopsis
The segmentation noise of hippocampal atrophy measurement methods can be measured using the back-to-back (BTB) reproducibility with the ADNI1 data set. Previous studies have only measured the segmentation noise over a one year interval. In the current study, two methods are shown to be substantially less noisy than manual hippocampal atrophy measurements over both 1 and 3 years - MAPS-HBSI and the recent FreeSurfer 6.0 Beta B (Build 20161008). Scatter plots of the 1 year versus 3 year BTB differences were found to be a particularly simple and effective way to display the segmentation noise of a method.
Purpose
To compare the segmentation noise of hippocampal atrophy measurements over 1 and 3 years for several commonly used methods by measuring their reproducibility with ADNI1 back-to-back (BTB) MPRAGEs.Background
Many papers have been published comparing the performance of methods for measuring the hippocampal atrophy from MRI images [LeungKK2010, OchsAL2015]. Back-to-back (BTB) reproducibility has rarely been used to compared the segmentation noise [SmithSM2007] partly because of the lack of a widely available BTB longitudinal MR scans of the head. The wide availability of the ADNI1 BTB data set has resolved this problem [CoverKS2011, CoverKS2014, MulderE2015, CoverKS2016]. These BTB studies have yielded the interesting results over a 1 year interval that, (1) at 1.5T for hippocampal atrophy the MAPS-HBSI method, because of its lower segmentation noise, requires half the patients to detect the same treatment effect as manual [CoverKS2016], (2) FreeSurfer 5.3.0 can be used as a surrogate for the manual method as they have similar noise [MulderE2015, CoverKS2016], and (3) segmentation noise is no better at 3T than 1.5T which suggests the segmentation noise of current methods still dominates the instrumentation noise of MRI scanners.Methods
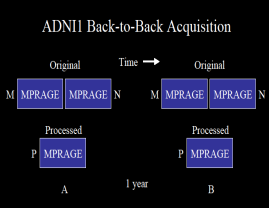
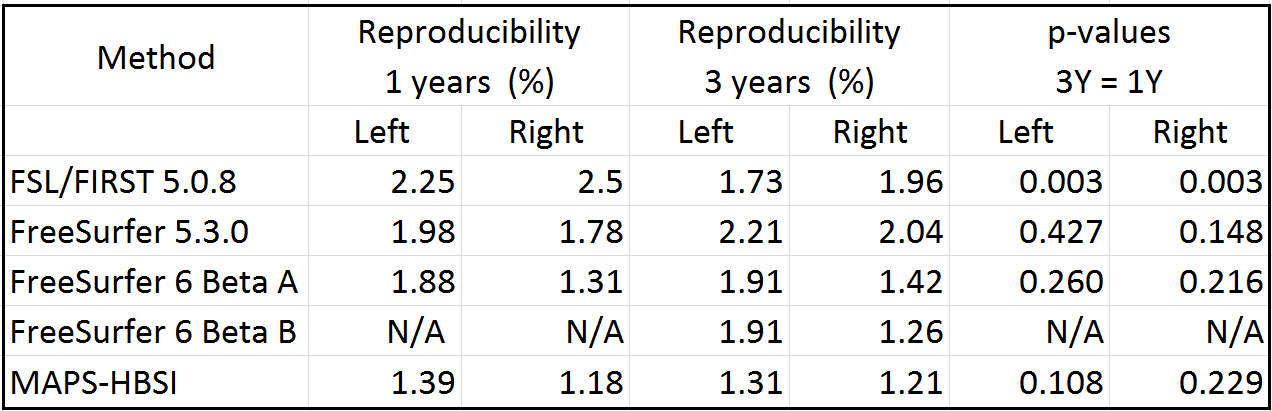
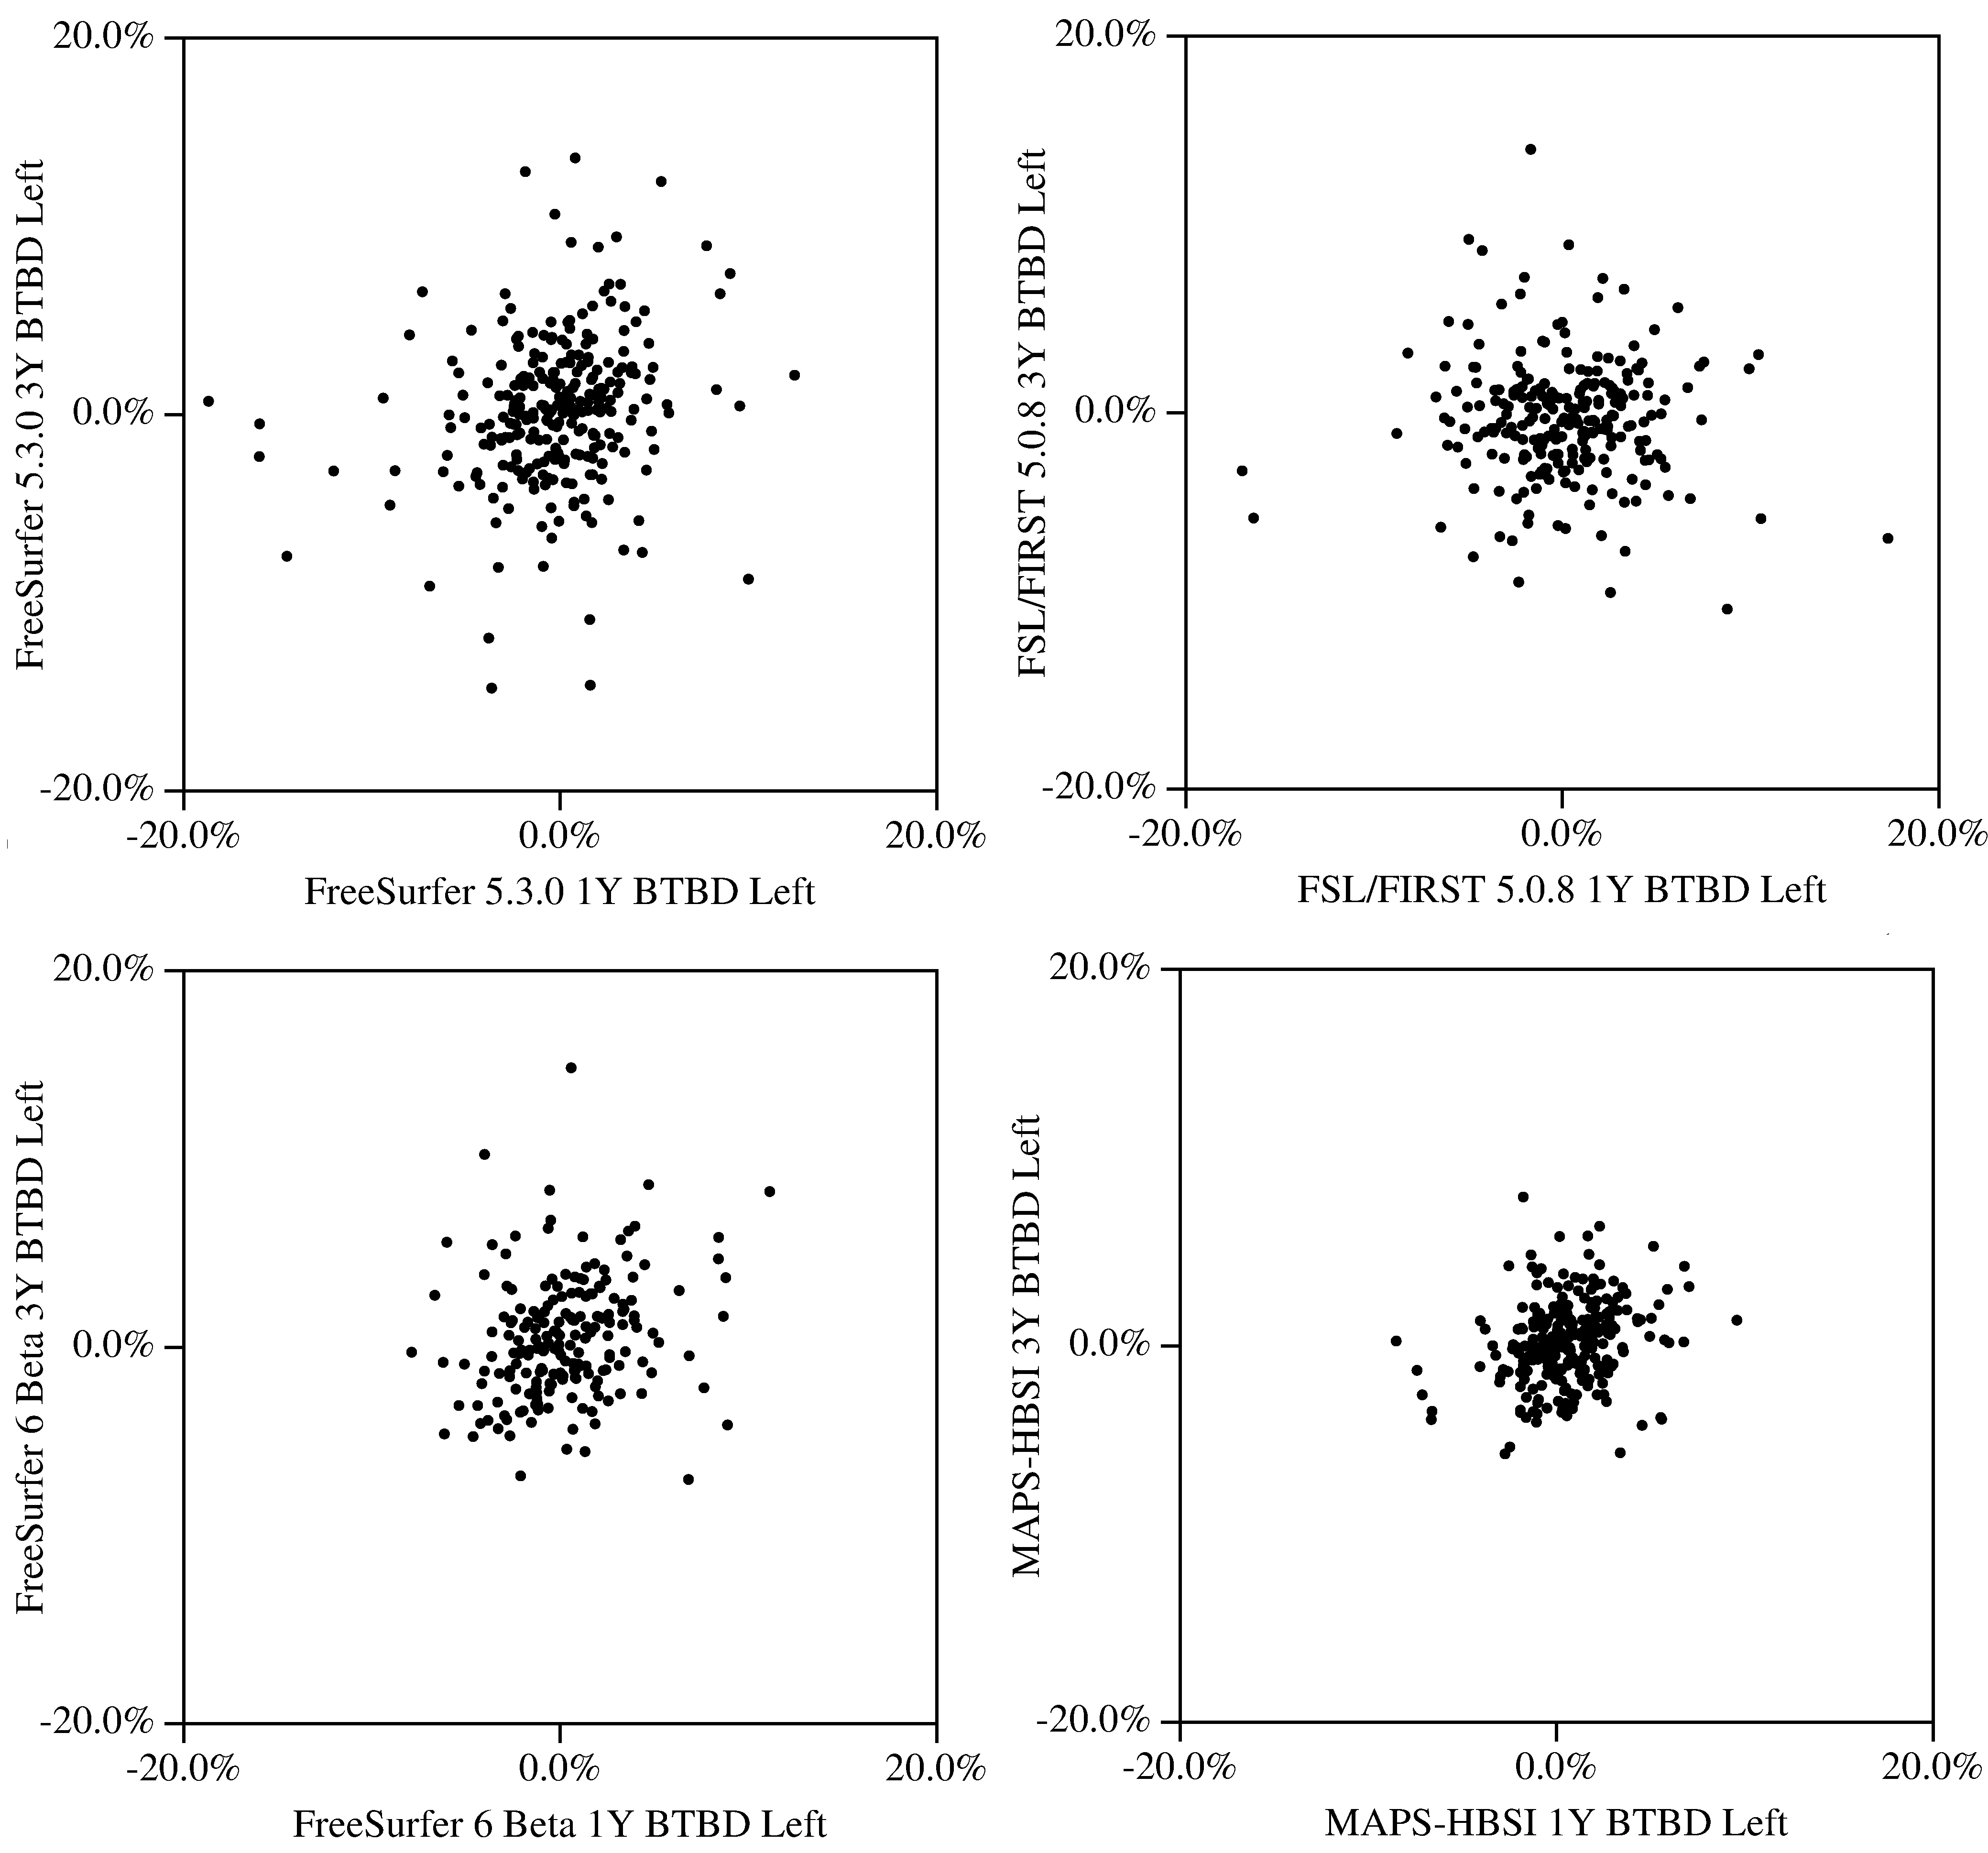
To determine the segmentation noise of fully automatic hippocampal atrophy measurement methods, the current study used back-to-back (BTB) MRI images from the first Alzheimer's Disease Neuroimaging Initiative (ADNI1) study where each MPRAGE was acquired twice at each patient visit [CoverKS2016, MulderE2015, CoverKS2014, CoverKS2011]. There were N=264 subjects with BTB MPRAGEs acquired at baseline, 1 year and 3 years on 1.5T MRI scanners. The subjects were a subset of the N=562 subjects of a previous study [CoverKS2016]. The BTB acquisition permitted the calculation of two atrophy rates over 1 and 3 years for each subject. Lower noise yields better reproducibility and smaller differences between the two BTB hippocampal atrophies. The reproducibilities of the hippocampal atrophy were calculated for FSL/FIRST 5.0.8, FreeSurfer/ReconAll 5.3.0 in longitudinal mode, FreeSurfer/ReconAll 6 Beta A (Build 20160501) in longitudinal mode, FreeSurfer/ReconAll 6 Beta B (Build 20161008) in longitudinal mode, and MAPS with the boundary shift integral (MAPS-HBSI) [LeungKK2010]. All methods were run with their default settings. The hippocampal percentage volume change (PVC) at baseline (A) and year 1 or 3 (B) were calculated for the first (M) and second (N) MPRAGEs of each patient visit. The difference between the M and N PVC for each patient gave the BTB difference (BTBD) in units of percentage points. BTBD = 100*( (VBN-VAN)/VAN– (VBM-VAM)/VAM ) The median of the absolution value of the BTBD for each method over each interval was calculated [SmithS2007]. A statistical test based on the binomial distribution was used to compare the distribution of the reproducibilities of 1 and 3 years [CoverKS]. Scatter plots for each method of the BTBD over 1 year and 3 years were also generated. Several of the algorithms used in this study are available on the www.neuGRID4you.eu website.Results and Discussion
The segmentation noise, as measured by the spread of the reproducibilities for each method, as measured by the median of the absolute value of the BTB differences [SmithS2007, CoverKS2016] is presented in the table in Figure 2. For 3 of the 4 methods, the p-values in the table indicate the segmentation noise, as measured by the BTB reproducibilities are the same over 1 and 3 years. For FSL/FIRST, the segmentation noise is slightly worse over 1 year than 3 years. For reference, the median annualized atrophy rates for the hippocampus are 1.5% (healthy controls), 2.4% (mildly cognitively impaired (MCI)) and 5.1% (Alzheimer’s disease) [CoverKS2016]. Therefore, over 3 years an average MCI patient’s hippocampus would atrophy about 7.2%. Since the segmentation noise is the same over 1 and 3 years, a 3 year study would be 3 times as sensitive as a 1 year study to a constant atrophy rate. From Figures 2 and 3, two methods, MAPS-HBSI and FreeSurfer 6.0 Beta B (Build 20161008) have the lowest segmentation noise. However, FreeSufer 6.0 Beta B only has low noise in the right hippocampus. FreeSurfer 5.3.0 was used as a surrogate for manual segmentation noise as it has been shown to have the same segmentation noise as manual [MulderE2015, CoverKS2016].Conclusions
Two methods are shown to be substantially less noisy than manual hippocampal atrophy measurements over both 1 and 3 years - MAPS-HBSI and the recent FreeSurfer 6.0 Beta B (Build 20161008) for the right hippocampus. Measuring the segmentation noise via BTB reproducibility of the ADNI1 data set and then displaying the noise as scatter plots is a robust and effective way to measure the segmentation noise and display it graphically.Acknowledgements
Study funding was provided by neuGRID4you (www.neuGRID4you.eu), an European Community FP7 project (grant agreement 283562), and the VU University Medical Center, Amsterdam, The Netherlands .References
CoverKS2016. Cover KS, van Schijndel RA, Versteeg A, Leung KK, Mulder ER, Jong RA, Visser PJ, Redolfi A, Revillard J, Grenier B, Manset D, Damangir S, Bosco P, Vrenken H, van Dijk BW, Frisoni GB, Barkhof F, Alzheimer's Disease Neuroimaging Initiative, neuGRID. Reproducibility of hippocampal atrophy rates measured with manual, FreeSurfer, AdaBoost, FSL/FIRST and the MAPS-HBSI methods in Alzheimer's disease. Psychiatry Res 2016;252:26-35.
CoverKS2014. Cover KS, van Schijndel RA, Popescu V, van Dijk BW, Redolfi A, Knol DL, Frisoni GB, Barkhof F, Vrenken H; neuGRID.; Alzheimer?s Disease Neuroimaging Initiative. The SIENA/FSL whole brain atrophy algorithm is no more reproducible at 3T than 1.5 T for Alzheimer's disease. Psychiatry Res. 2014;224:14-21.
CoverKS2011. Cover KS, van Schijndel RA, van Dijk BW, Redolfi A, Knol DL, Frisoni GB, Barkhof F, Vrenken H; neuGRID.; Alzheimer's Disease Neuroimaging Initiative. Assessing the reproducibility of the SienaX and Siena brain atrophy measures using the ADNI back-to-back MP-RAGE MRI scans. Psychiatry Res. 2011;193:182-90.
LeungKK2010. Leung KK, Barnes J, Ridgway GR, Bartlett JW, Clarkson MJ, Macdonald K, Schuff N, Fox NC, Ourselin S; Alzheimer's Disease Neuroimaging Initiative. Automated cross-sectional and longitudinal hippocampal volume measurement in mild cognitive impairment and Alzheimer's disease. Neuroimage. 2010;51:1345-59.
MulderER2014. Mulder ER, de Jong RA, Knol DL, van Schijndel RA, Cover KS, Visser PJ, Barkhof F, Vrenken H; Alzheimer's Disease Neuroimaging Initiative. Hippocampal volume change measurement: quantitative assessment of the reproducibility of expert manual outlining and the automated methods FreeSurfer and FIRST. Neuroimage. 2014;92:169-81.
OchsAL2015. Ochs AL, Ross DE, Zannoni MD, Abildskov TJ, Bigler ED; Alzheimer's Disease Neuroimaging Initiative. Comparison of Automated Brain Volume Measures obtained with NeuroQuant and FreeSurfer. J Neuroimaging. 2015;25:721-7.
SmithSM2007. Smith SM, Rao A, De Stefano N, Jenkinson M, Schott JM, Matthews PM, Fox NC.Longitudinal and cross-sectional analysis of atrophy in Alzheimer's disease: cross-validation of BSI, SIENA and SIENAX. Neuroimage 2007;36:1200-6.
Figures