4123
Constant decline in Alzheimer's disease: A brain morphometry study.1InBrain Lab, Department of Physics, Faculty of Philosophy, Sciences and Letters of Ribeirão Preto, University of Sao Paulo, Ribeirão Preto, SP, Brazil, 2Ribeirao Preto Medical School, University of Sao Paulo, Ribeirao Preto, SP, Brazil
Synopsis
Constant atrophy in Alzheimer's disease is observed until the later DAD stages.
Introduction
Dementia due to Alzheimer’s disease (DAD) is a primary and progressive neurodegenerative disorder, which is marked by cognitive deterioration and memory commitment (1). Atrophy of hippocampus and other basal brain regions is one of the most predominant structural imaging findings related to DAD (2). Most studies have evaluated the pre-clinical and initial stages of DAD through clinical trials using Magnetic Resonance Imaging (3). Brain morphometry for advanced DAD stages have not been evaluated yet, being only hypothetically sustained (4). This work evaluated the brain morphometry of DAD patients in all disease stages, aiming at identifying the structural neuro-degeneration profile in every phase of disease progression.Materials and Methods
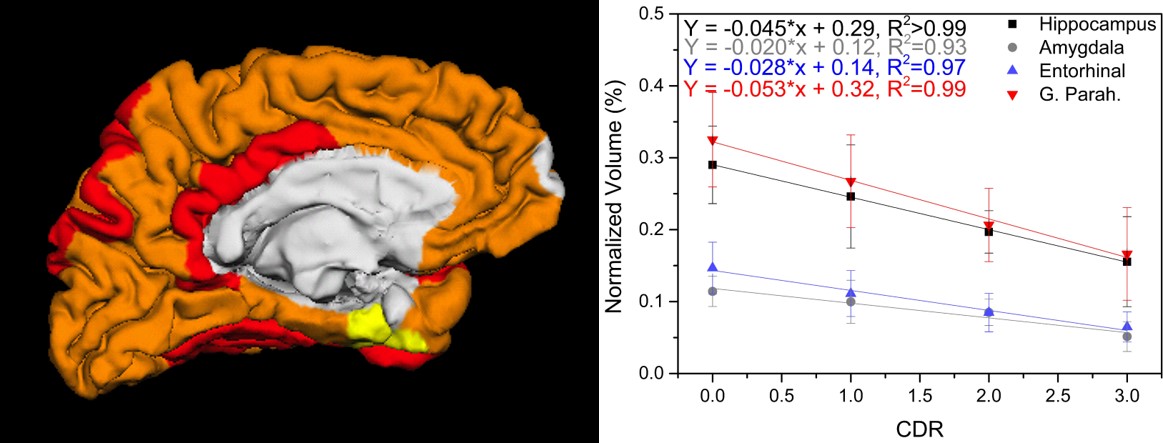
DAD patients above 60 years old at different disease duration (2-12 years) and DAD stages were recruited and grouped into three groups following the Clinical Dementia Rating (CDR): CDR1 (n = 16), CDR2 (n = 15), CDR3 (n = 13). Age paired healthy control subjects (n = 16) were also recruited. Brain images were acquired on a 3T magnetic resonance scanner using a conventional 3D T1-w Gradient Echo sequence without contrast injection. Volumetric quantitative data and cortical thickness were obtained by automatic segmentation using the Freesurfer® software (Fig.1). Volume of each brain region was normalized by the whole brain volume in order to minimize age and body size effects (5). Volume and cortical thickness variations among groups were compared between groups and correlated with CDR using parametric statistical methods.Results
Our results revealed that brain regions affected by DAD during its initial stages (CDR=1), such as the hippocampus, amygdala, entorhinal cortex, and parahippocampal region, follow a linear atrophy pattern at the last disease stages (CDR=2 and CDR=3) (Fig.2). A widespread atrophy was observed at the last stage involving more extensive areas in frontal and occipital lobes (Fig.2).Discussion and Conclusion
This finding corroborates classical neuropathological study indicating neuronal loss and gliosis (6), but it is not in total agreement with the more accepted model considering a faster degeneration at early stages (7). Volumetric changes were more accentuated than cortical thickness changes using a clinical MRI protocol and automatic segmentation. We conclude that most affected brain regions suffer atrophy in a linear fashion until the later stages of the disease.Acknowledgements
No acknowledgement found.References
1. Blennow K, de Leon MJ, Zetterberg H. Alzheimer’s disease. Lancet. 2006;368(9533):387–403.
2. Gosche KM, Mortimer JA, Smith CD, Markesbery WR, Snowdon DA. Hippocampal volume as an index of Alzheimer neuropathology: findings from the Nun Study. Neurology. 2002;58(10):1476–82.
3. Frisoni GB, Fox NC, Jack CR, Scheltens P, Thompson PM. The clinical use of structural MRI in Alzheimer disease. Nat Rev Neurol. 2010;6(2):67–77.
4. Jack CR, Vemuri P, Wiste HJ, et al. Shapes of the trajectories of 5 major biomarkers of Alzheimer disease. Arch Neurol. 2012;69(7):856–67.
5. Whitwell JL, Crum WR, Watt HC, Fox NC. Normalization of Cerebral Volumes by Use of Intracranial Volume: Implications for Longitudinal Quantitative MR Imaging. AJNR Am J Neuroradiol. 2001;22(8):1483–1489.
6. Brun A, Gustafson L. Distribution of cerebral degeneration in Alzheimer’s disease. A clinico-pathological study. Arch Psychiatr Nervenkr. 1976;223(1):15–33.
7. Jack CR, Knopman DS, Jagust WJ, et al. Hypothetical model of dynamic biomarkers of the Alzheimer’s pathological cascade. Lancet Neurol. 2010;9(1):119–28.
Figures