4122
Machine learning on resting state fMRI classifies the prevalent underlying disease in subjects with mixed dementia1Department of Electrical, Computer and Biomedical Engineering, University of Pavia, Pavia, Italy, 2Brain Connectivity Center, C. Mondino National Neurological Institute, Pavia, Italy, 3Department of Brain and Behavioral Sciences, University of Pavia, Pavia, Italy, 4Department of Physics, University of Milan, Mialn, Italy, 5Department of Physics, University of Pavia, Pavia, Italy, 6Brain MRI 3T research center, C. Mondino National Neurological Institute, Pavia, Italy, 7Scientific Institute H.S. Raffaele, Milan, Italy, 8Neurology Unit, C. Mondino National Neurological Institute, Pavia, Italy, 9Genomic and Post-Genomic Center, C. Mondino National Neurological Institute, Pavia, Italy, 10Queen Square MS Centre Department of Neuroinflammation, UCL Institute of Neurology, London, United Kingdom, 11Department of Emergency Neurology, C. Mondino National Neurological Institute, Pavia, Italy
Synopsis
Evidence from recent studies suggests that machine learning applied on MRI can be used to reliably differentiate Alzheimer disease from other major dementia diseases, e.g. Vascular Dementia (VD). In this work we used a machine learning approach applied on features derived from resting state fMRI (rs-fMRI) to build a model that is able not only to differentiate AD from VD, but also to classify the prevalent underlying disease (AD or VD) in a group of early dementia patients for whom clinical profile presented major overlap between symptoms of AD and symptoms of VD (i.e. mixed dementia subjects, MXD).
Introduction
Alzheimer disease (AD) represents the most frequent form of dementia. Despite a huge healthcare effort in tackling Dementia, the correct diagnosis of AD is still challenging, especially when AD co-occurs with other pathologies, such as cerebrovascular diseases.1 In these cases, instrumental and clinical manifestations of AD may cohabit with those of other subtypes of dementia, such as Vascular Dementia (VD), making the differential diagnosis between them difficult.2 Evidence from recent studies suggests that machine learning is a valid approach, particularly when applied to MRI-derived features, to differentiate AD from other dementias.3 In this study we combined graph analysis of rs-fMRI connectivity, with machine learning to build a predictive model that was able to: 1) accurately discriminate pure AD from pure VD; and 2) classify the prevalent underlying disease (AD or VD) in a group of early dementia patients for whom clinical profile presented severe overlap between AD and VD clinical profiles. We referred to these subjects as mixed dementia (MXD) subjects.Methods
25 subjects affected by pure AD (age=72.6±8.0, MMSE=16.9±6.3, HIS=2.9±0.9) and 25 subjects diagnosed with pure VD (age=76.6±8.0, MMSE=17.9±4.3, HIS=8.0±1.4) underwent MRI examination using a 3T Siemens Skyra MR scanner with a 32-channels head-coil. 20 subjects with MXD (age=76.0±7.1, MMSE=18.3±4.5, HIS=5.8±2.4) underwent MRI examination too. All recruited subjects (AD, VD, MXD) underwent neuropsychological and neurobiological screening. Pure AD and pure VD were also supported by molecular screening4.
MRI acquisitions: rs-fMRI: EPI-2D T2*-weighted sequence (TR/TE=3010/20ms, voxel size=2.5mm isotropic, FOV=224mm, 60 slices, 120 volumes); 3DT1-weighted scan: MPRAGE sequence (TR/TE/TI=2300/2.95/900ms, flip angle 9°, 256 slices,voxel size=1x1x1.2mm3, FOV=270mm).
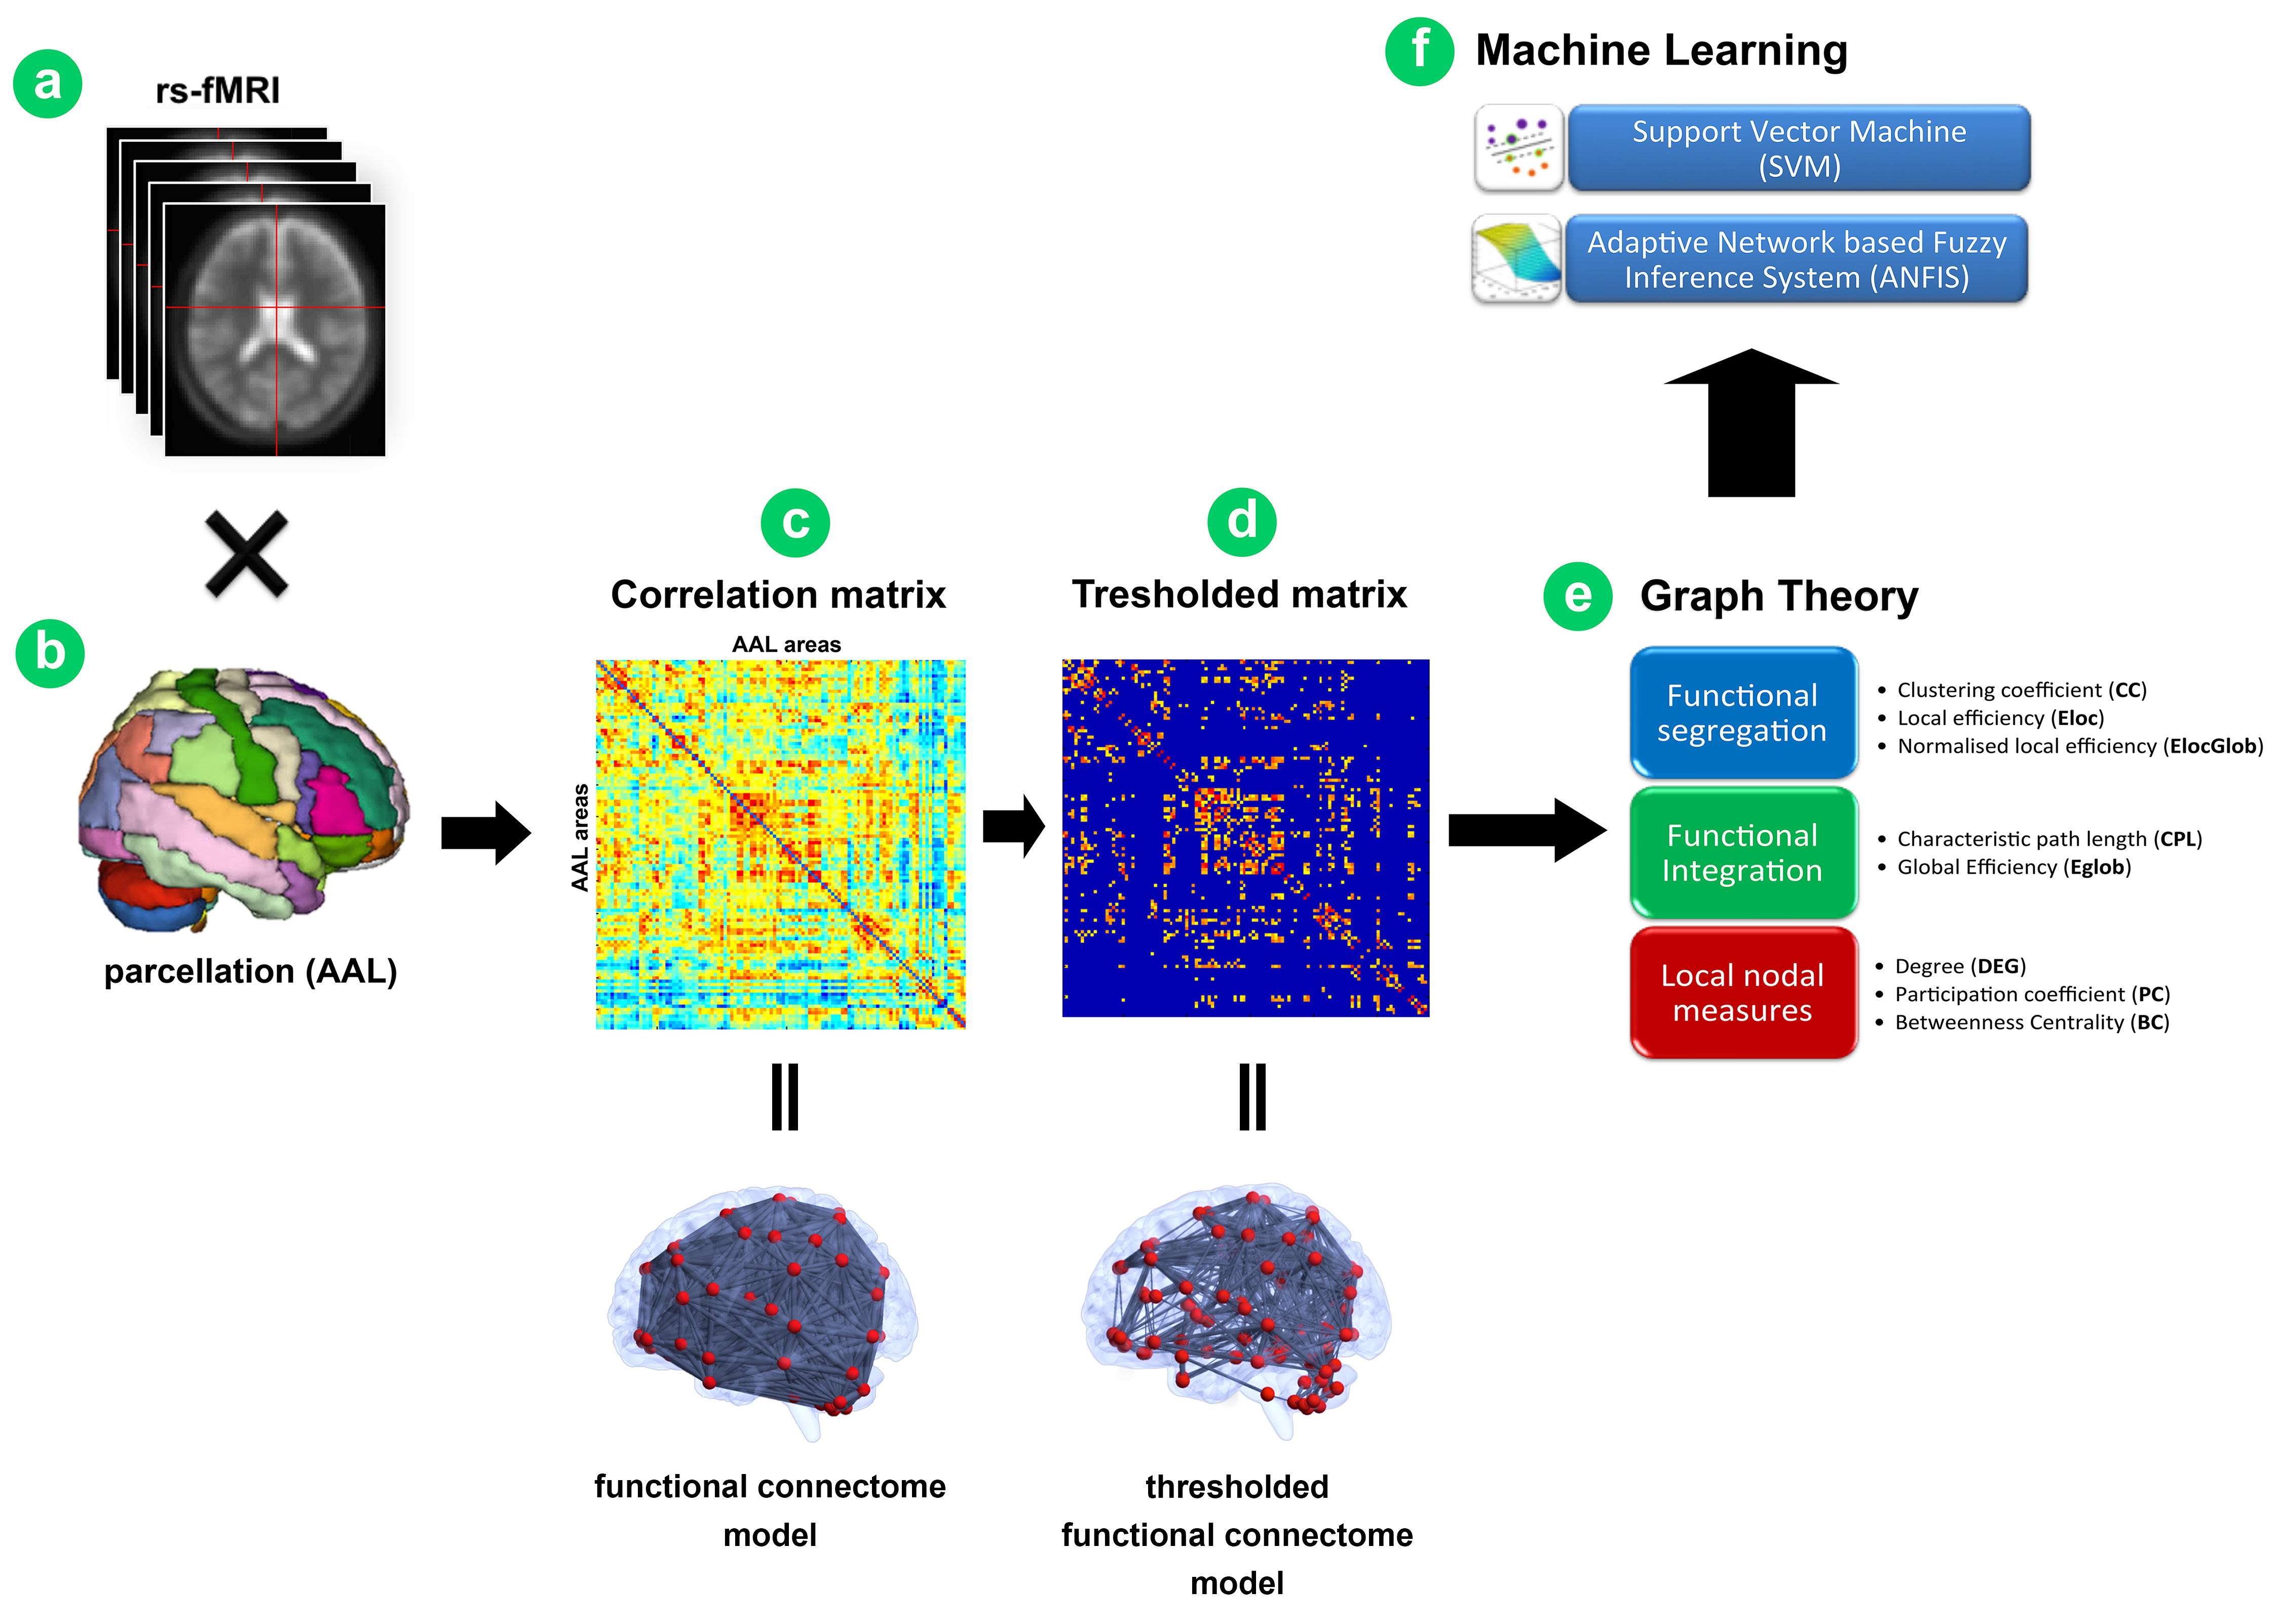
fMRI analysis: For each subject, rs-fMRI images were firstly pre-processed using FSL5 and then parcellated using the automated anatomical labelling (AAL6) atlas into 116 areas. For each AAL region (node), the mean rs-fMRI signal was extracted and used to calculate the Pearson’s correlations (edges) between all pairs of AAL areas. For each subject, the resulting cross-correlation matrix was thresholded to remove weak correlations and then processed with BCT7 to calculate graph metrics (local nodal measures, measures of functional segregation/integration)(Fig.1).
Machine learning analysis: Extracted graph metrics were used as input features to run in Matlab two different supervised machine learning algorithms using a leave-one-out cross-validation (LOOCV)3 strategy: Support Vector Machine (SVM, tuned with RBF kernel)3 and Adaptive Neuro-Fuzzy Inference System (ANFIS)8. To improve the classification performance we applied a feature selection algorithm (ReliefF)9 prior to train the classifiers. This step allowed us to rank the features according to their discrimination ability and to select the N features (with 2<N<10) with higher scores to construct the classifiers. Specifically, selected features from AD and VD groups were used to run SVM and ANFIS to identify a pattern of features (model) that was able to discriminate AD profile from VD with the highest accuracy. Data of the MXD group were used to evaluate the ability of the identified model to make estimation of dementia prevalence on MXDs.
Results
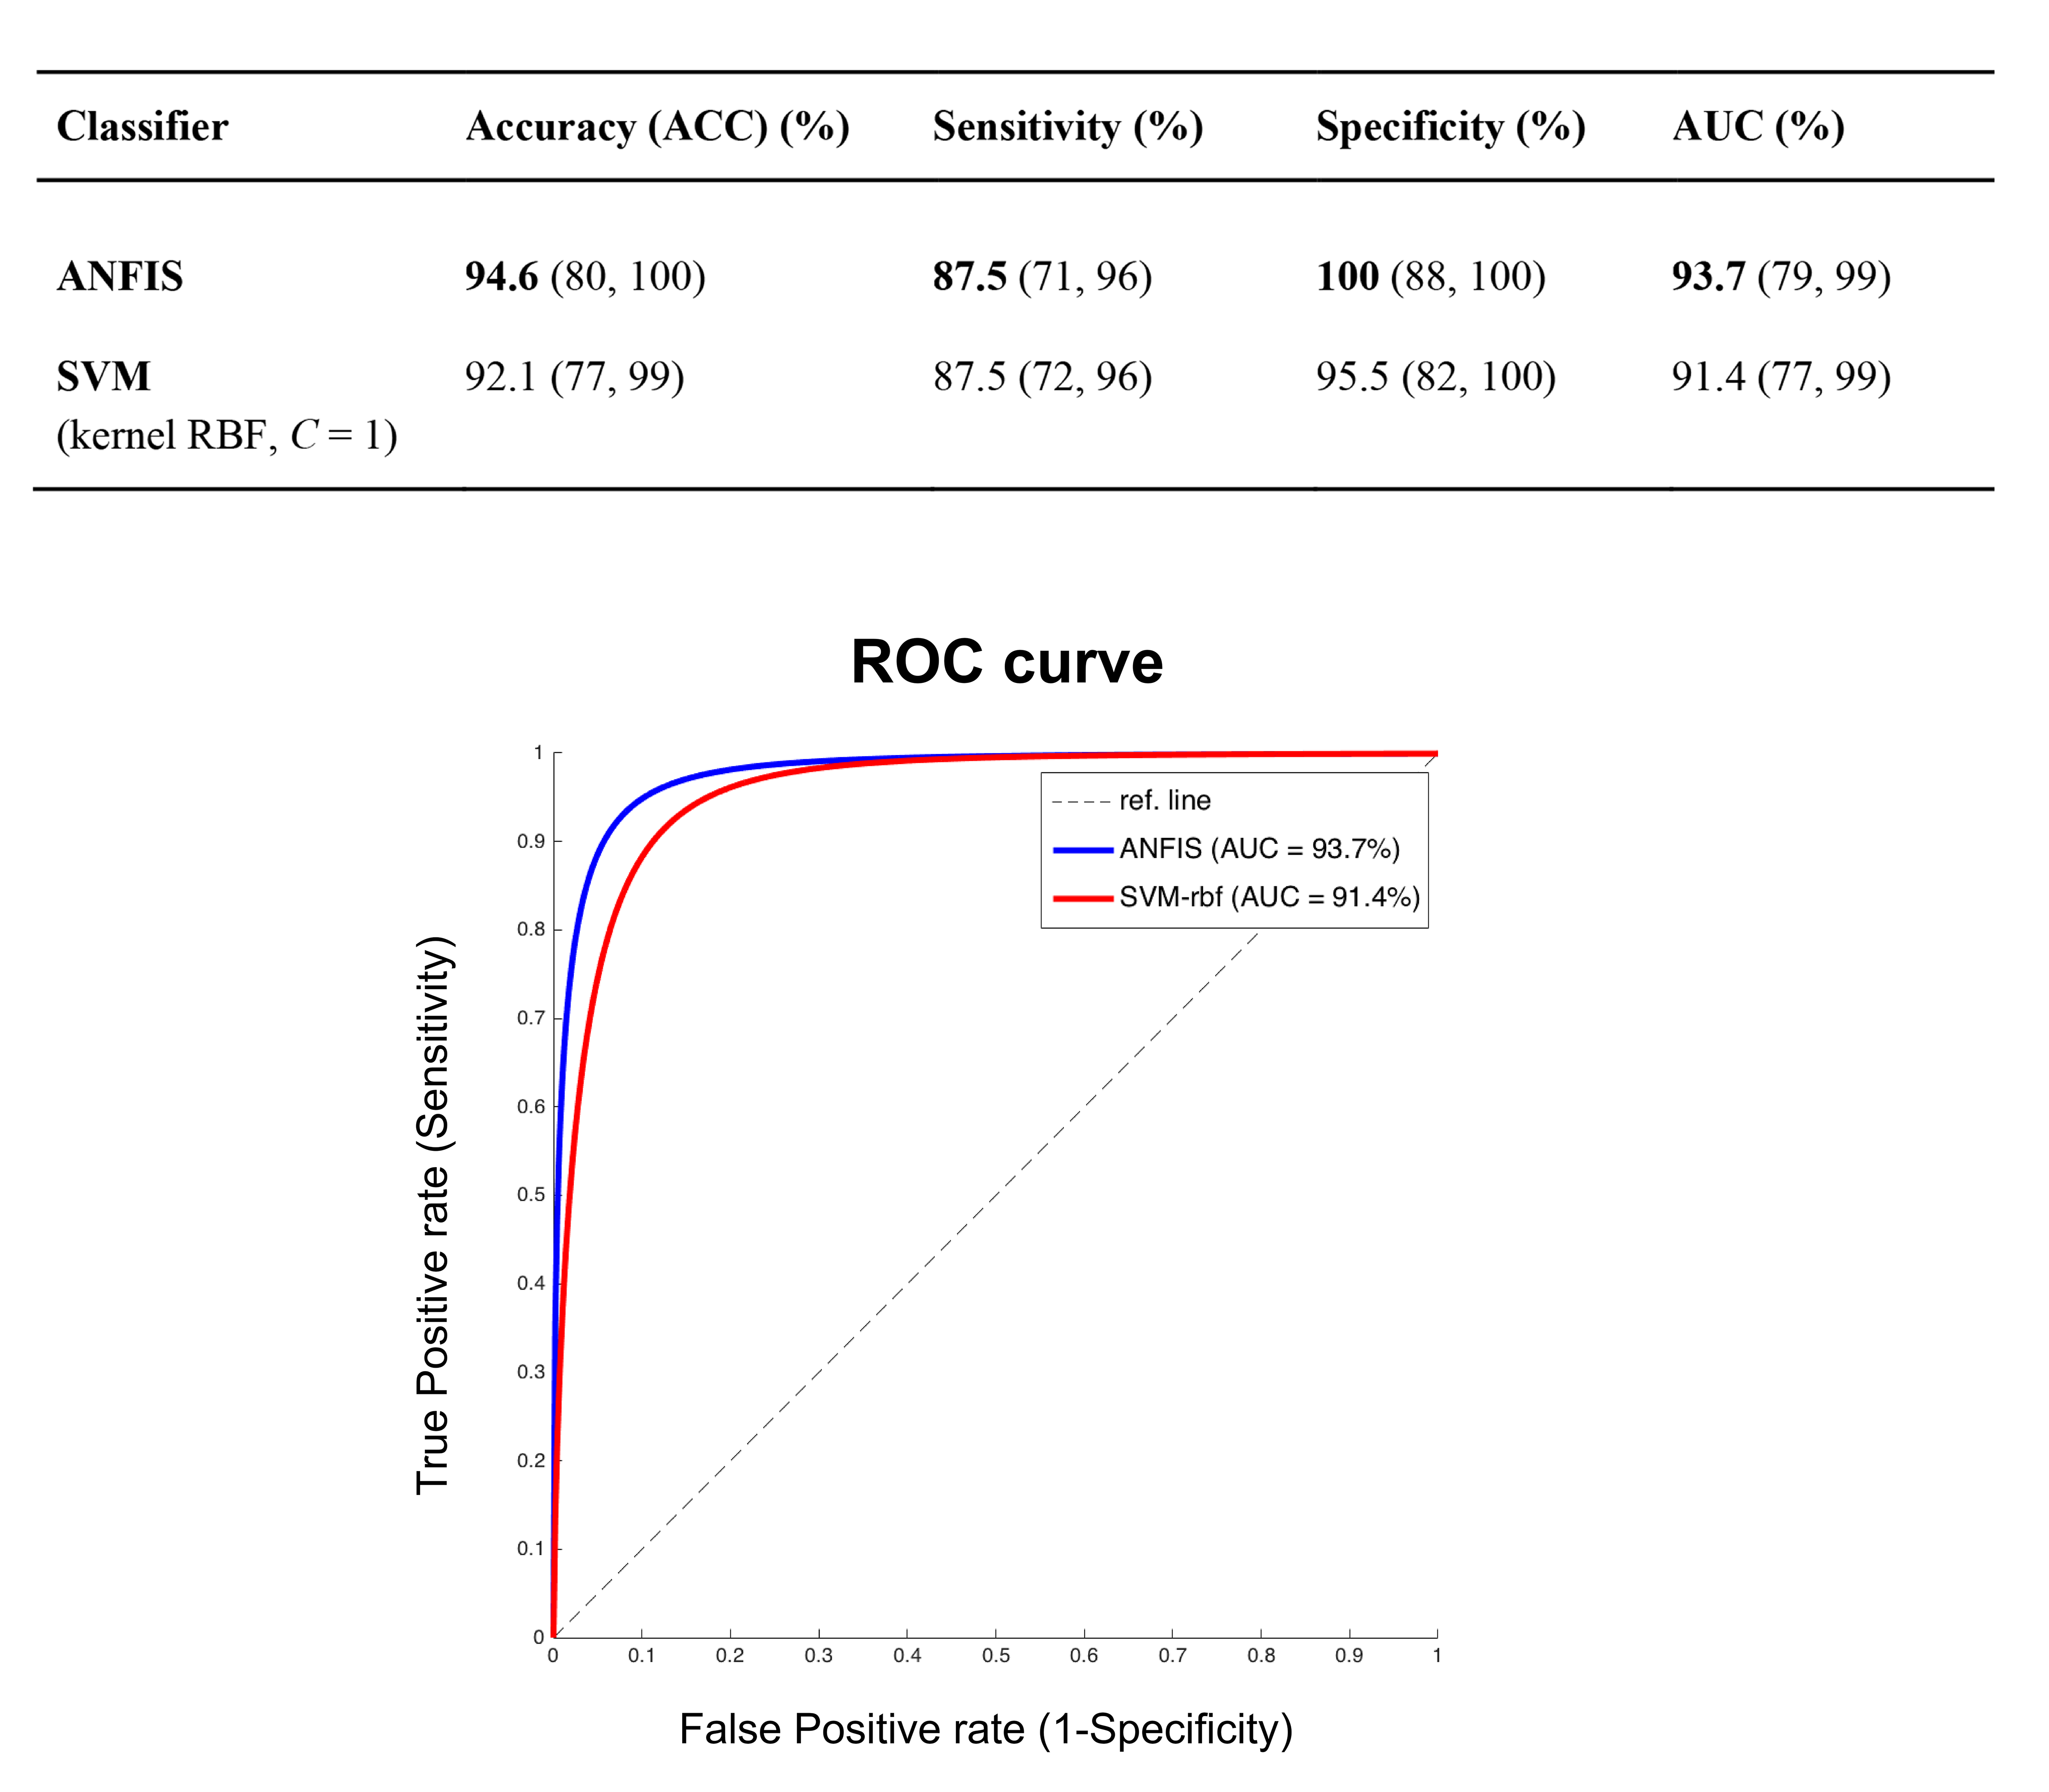
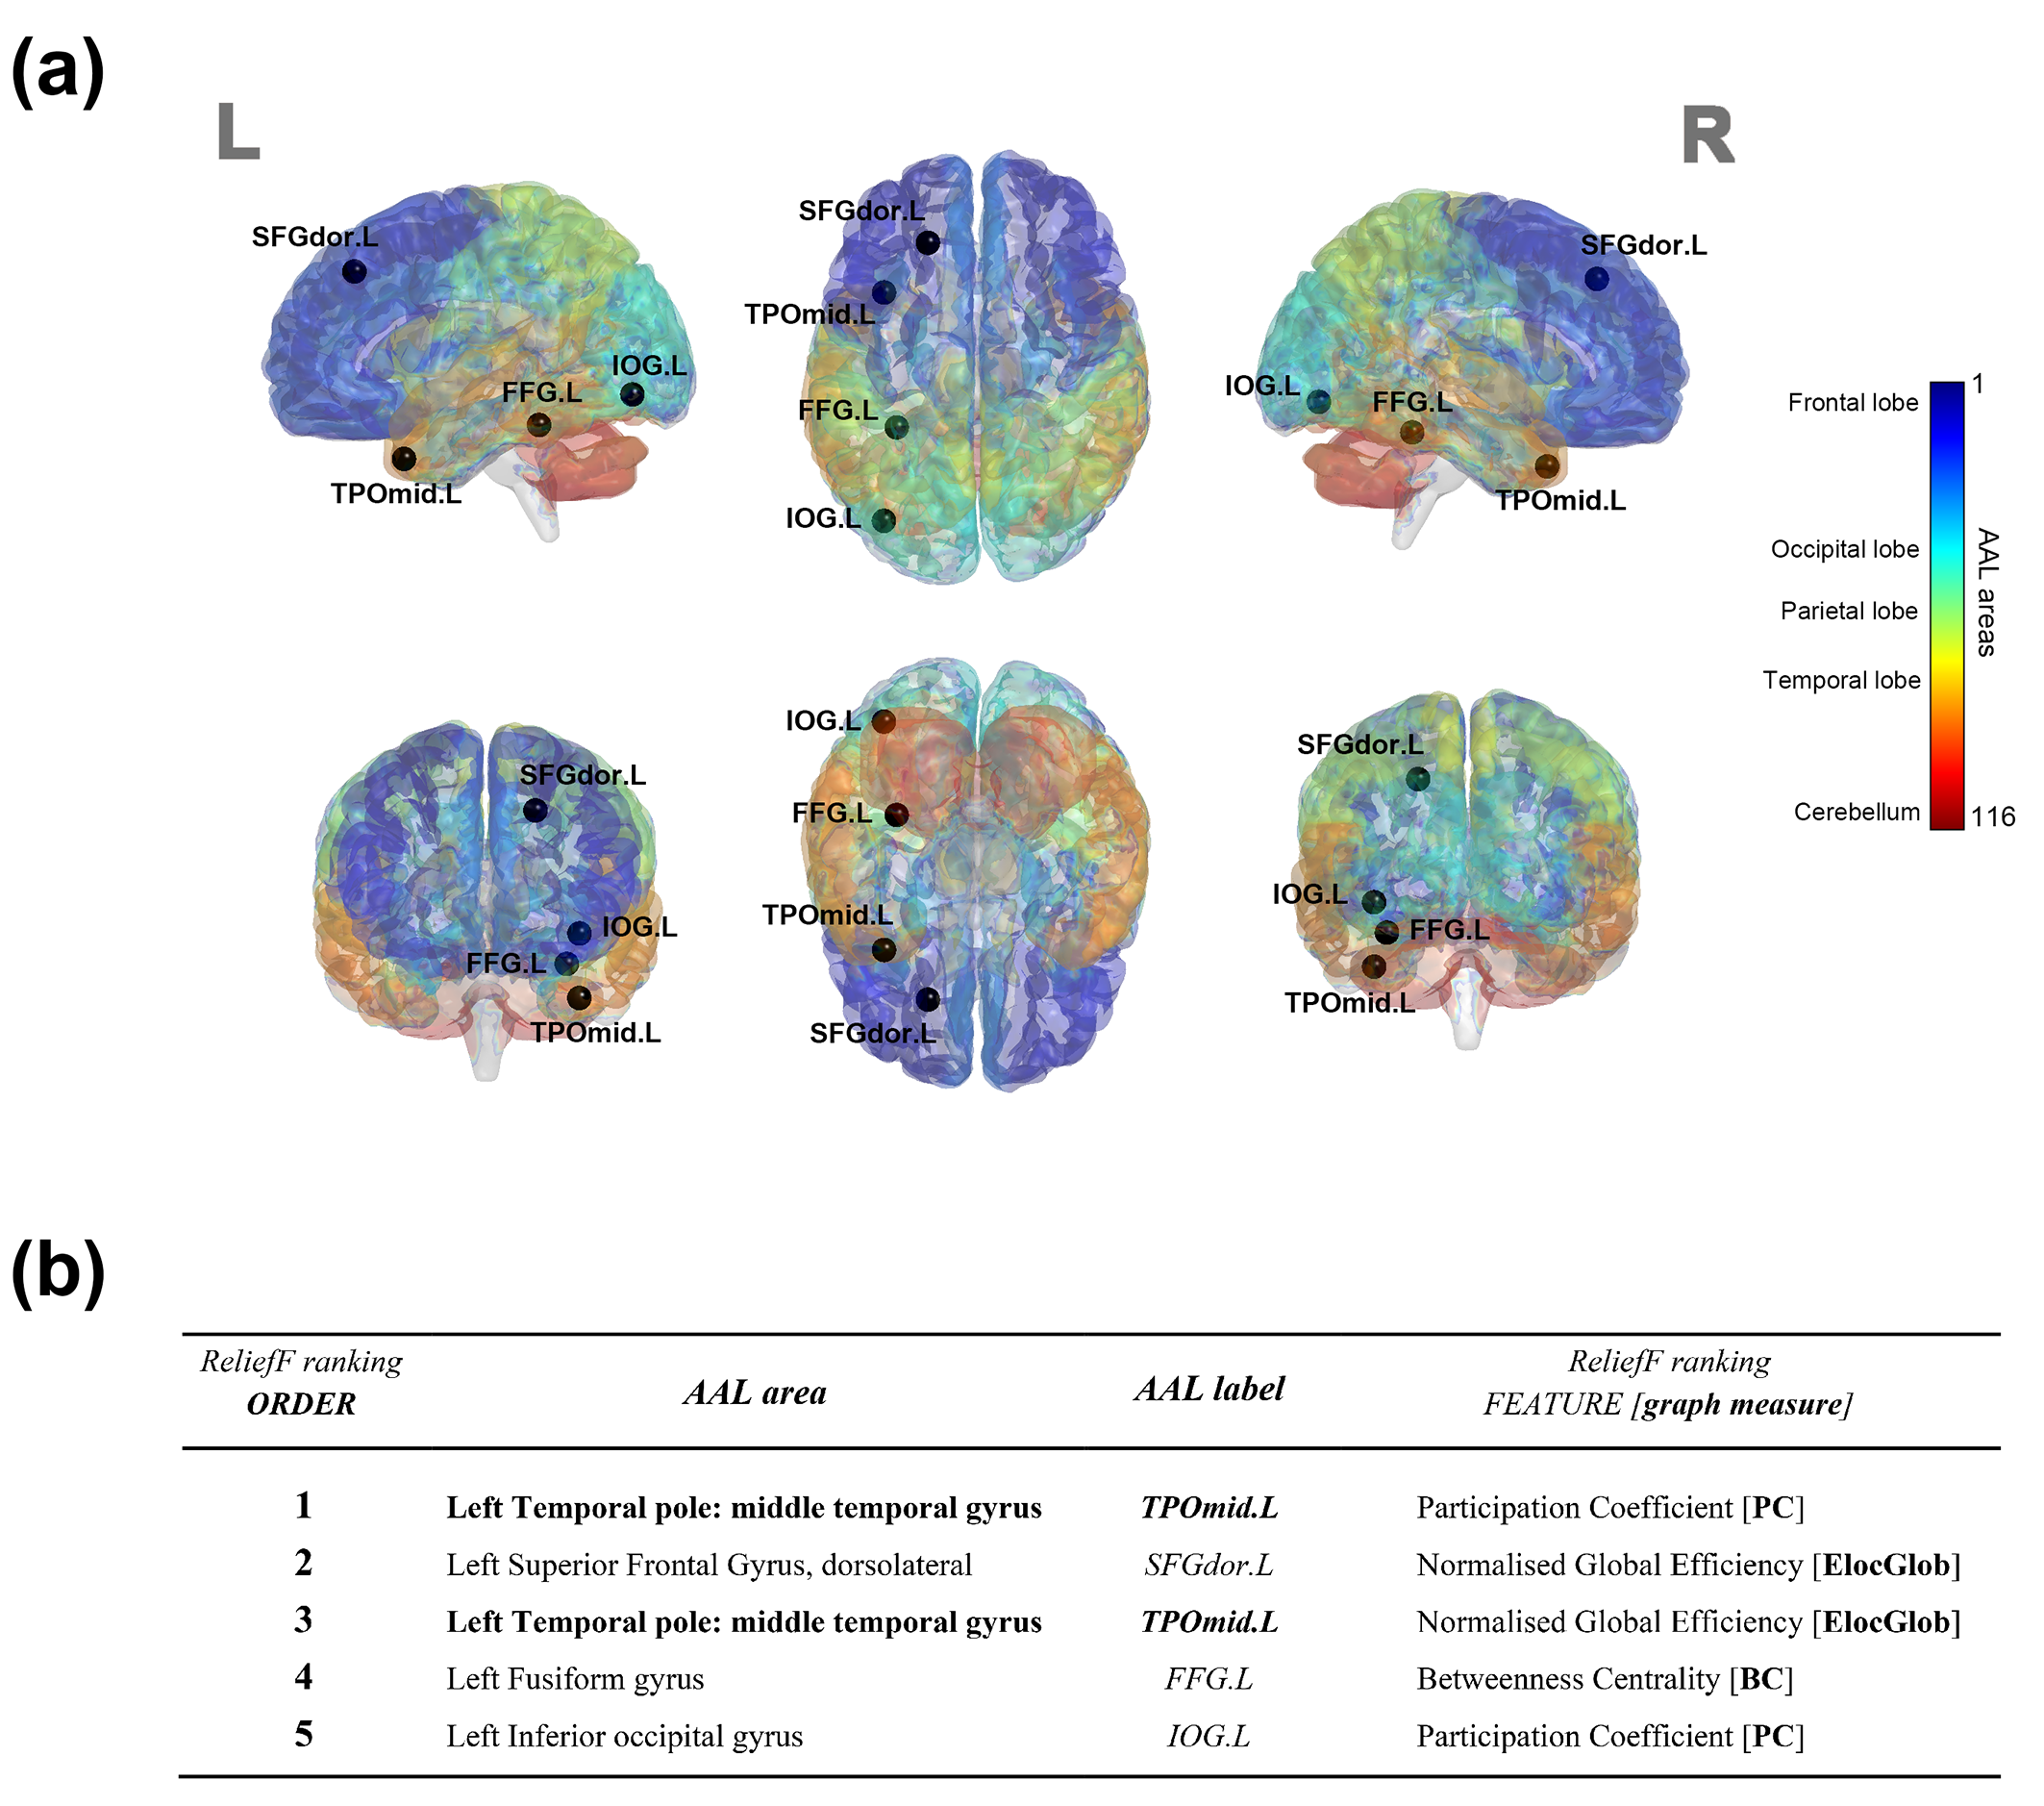
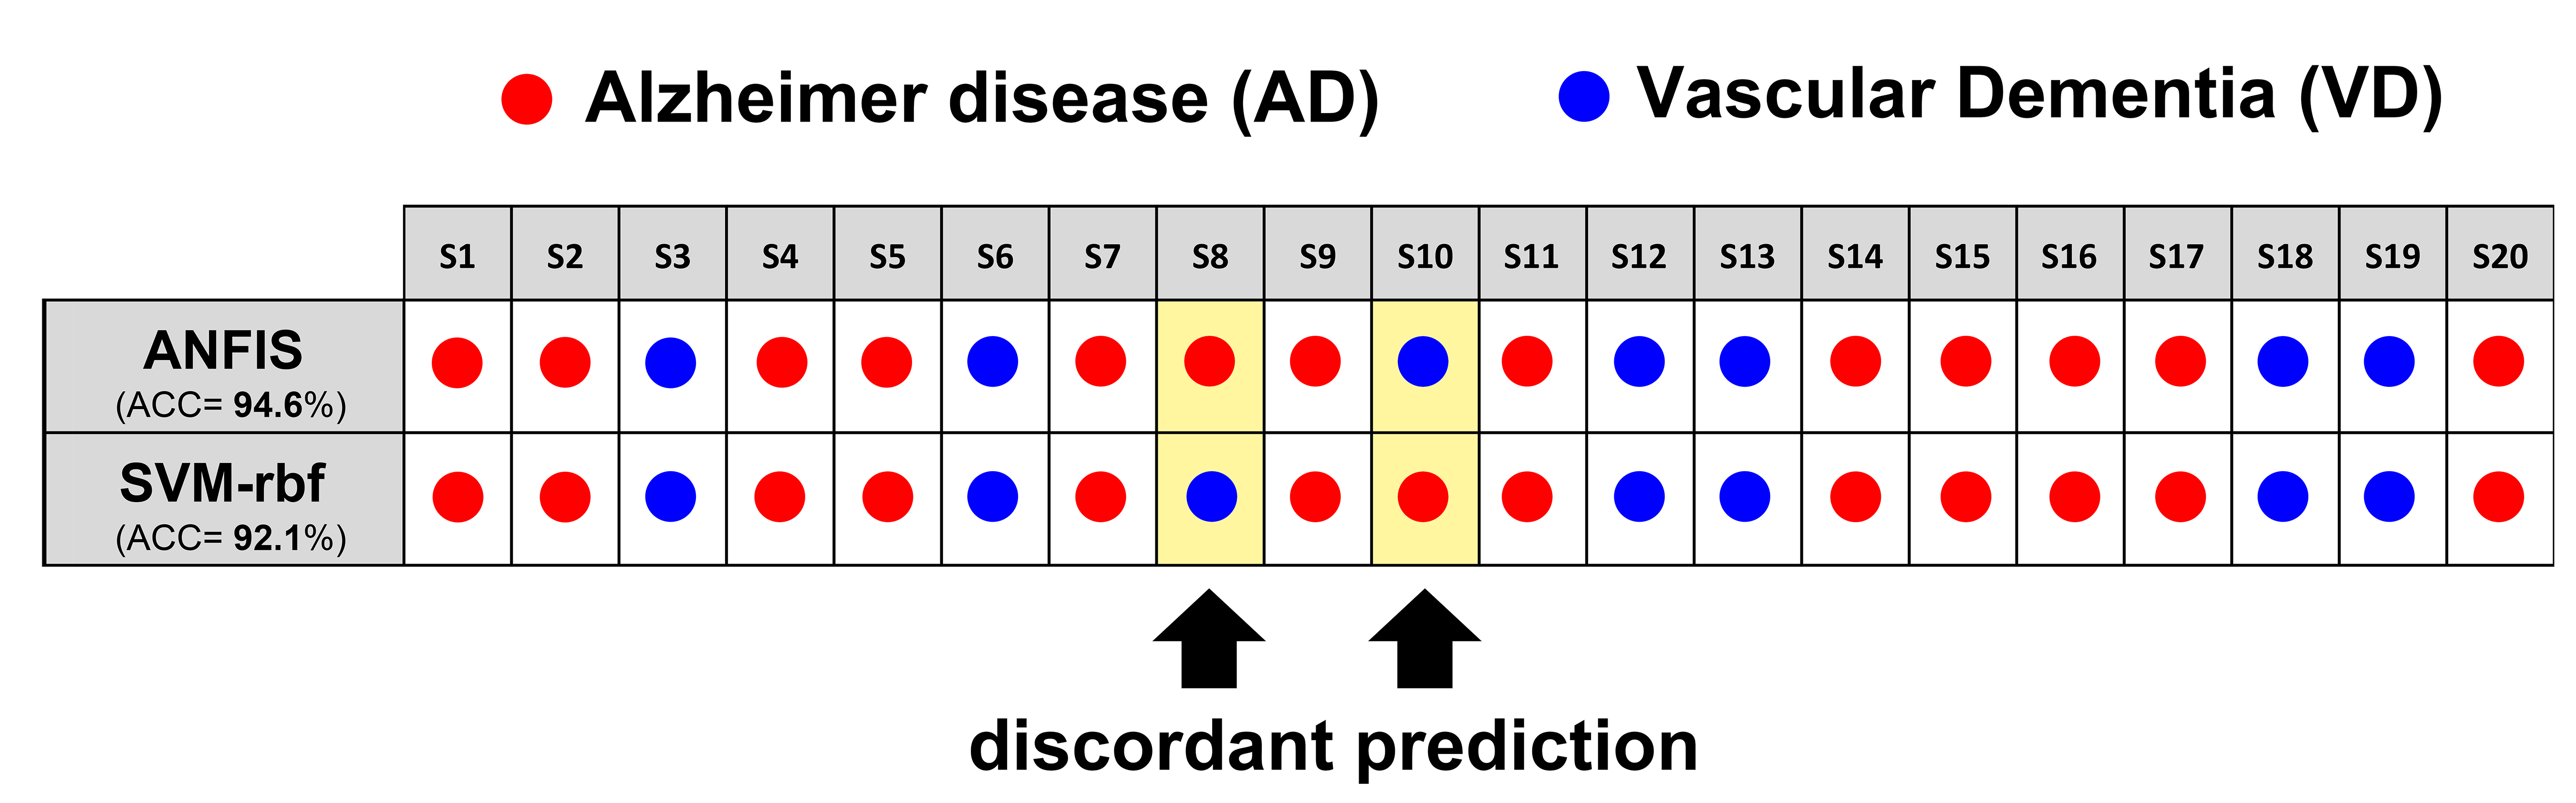
ANFIS reported the highest classification performance (ACC=94.6%) in discriminating pure AD from pure VD (Fig.2) using a set of only 5 features (graph metrics) from 4 distinct AAL areas (left.TPOmid, left.SFGdor, left.FFG, left.IOG)(Fig.3). Interestingly, SVM identified the same feature set as ANFIS (Fig.3) to discriminate AD and VD, but with a lower classification accuracy (ACC=92.1%, Fig.2). The feature set in Fig.3 was then used to assess the ability of ANFIS and SVM to classify the MXD patients (i.e. assigning them to AD or VD). ANFIS and SVM assigned the same class for 18 of the 20 MXD subjects (Fig.4). Furthermore, 3 of the 18 MXDs coherently predicted by ANFIS and SVM were also confirmed to be correctly classified by molecular screening.Discussions and Conclusions
Our results showed that the SVM and ANFIS algorithms applied to graph metrics detected a specific small set of features (brain graph measures) that enabled discrimination of pure AD subjects from pure VD with high classification accuracy (>90%). ANFIS resulted as the most efficient classifier reaching a classification accuracy >94.5%. Both ANFIS and SVM identified the same set of 5 features as best discriminant pattern to classify pure AD and pure VD. Furthermore, using this discriminant pattern, ANFIS and SVM showed high concordance (90%) in assigning the prevalent underlying disease (class) in MXD subjects (Fig.4). Molecular screening for all patients is needed in future studies to validate the classifier. These encouraging results suggest that graph theoretical methods combined with machine learning represents a suitable approach to build an image-based system for the automatic classification of dementia-like diseases, as well as for advising on prevalent underlying disease in patients with mixed dementia.Acknowledgements
University of Pavia, C. Mondino National Neurological institute (Pavia, Italy) for funding (5 x 1000, year 2013); UCL-UCLH Biomedical Research Centre (London, UK) for ongoing support.References
1- Graham NL (2004) Distinctive cognitive profiles in Alzheimer's disease and subcortical vascular dementia. J Neurol Neurosurg Psychiatry 75(1): 61-71
2- Matioli MN (2010) Limitations in differentiating vascular dementia from Alzheimer's disease with brief cognitive tests. Arq Neuropsiquiatr 68(2): 185-8
3- Khazaee A (2015) Identifying patients with Alzheimer's disease using resting-state fMRI and graph theory. Clin Neurophysiol 126(11):2132-41
4- Cacace R (2016) Molecular genetics of early-onset Alzheimer’s disease revised. Alzheimers Dement 12(6): 733-48
5- FSL, www.fmrib.ox.ac.uk/fsl
6- Tzourio-Mazoyer N (2002) Automated anatomical labeling of activations in SPM using a macroscopic anatomical parcellation of the MNI MRI single-subject brain. Neuroimage 15:273-89
7- Rubinov and Sporns O (2010) Complex network measures of brain connectivity: uses and interpretations. Neuroimage 52:1059-1069
8- Hosseini MS (2012) Review of medical image classification using the Adaptative Neuro-Fuzzy Inference System. J Med Signals Sens 2(1): 49-60
9- Durgabai RPL (2014) Feature selection using ReliefF algorithm. IJARCCE 3(10): 8215-8218
10- Palesi F (2016) Exploring patterns of alteration in Alzheimer’s disease brain networks: a combined structural and functional connectomics analysis. Front Neurosci 10:380
11- Castellazzi G (2014) A comprehensive assessment of resting state networks: bidirectional modification of functional integrity in cerebro-cerebellar networks in dementia. Front Neurosci 8:223
12- Guo CC (2016) Network-selective vulnerability of the human cerebellum to Alzheimer’s disease and frontotemproal dementia. Brain 139:1527-1538
Figures