4121
Fibre-specific white matter changes in Alzheimer's disease: novel insights from Fixel-Based Analysis1Florey Institute of Neuroscience and Mental Health, Melbourne, Victoria, Australia, 2Florey Institute of Neuroscience and Mental Health, University of Melbourne, Melbourne, Victoria, Australia, 3Department of Neurology, Austin Health, Victoria, Australia, 4Health & Biosecurity, CSIRO, Brisbane, Queensland, Australia, 5Eastern Clinical Research Unit, Box Hill Hospital, Monash University, Victoria, Australia, 6Department of Medicine, Austin Health, University of Melbourne, Victoria, Australia, 7Department of Molecular Imaging & Therapy, Centre for PET, Austin Health, Heidelberg, Victoria, Australia
Synopsis
Alzheimer’s disease (AD) is characterised by extensive white matter disruption, however voxel-based studies have been unable to provide fibre-specific insight into how this alters brain connectivity. Here, we applied fixel-based analysis (FBA) to diffusion MRI data to investigate changes in AD and mild cognitive impairment (MCI) patients. AD patients exhibited significant reductions in both fibre density and cross-section across multiple fibre tracts, while significant decreases in MCI were only evident in the posterior cingulum and uncinate, upon tract-of-interest analysis. This work demonstrates the value of FBA in identifying both macroscopic and microscopic changes to specific fibre pathways in the investigation of AD.
Introduction
Alzheimer’s disease (AD) is increasingly considered a large-scale network disconnection syndrome1,2, which is presumably associated with substantial disruption to white matter (WM) connectivity. There are two major changes to WM fibre structures that could contribute to functional disconnection: (1) macroscopic changes in WM tract morphology, and (2) microscopic changes to fibre density. Thus far, studies in AD have examined WM volume with voxel-based, and tensor-based morphometry to assess the former3,4, while the most common approach to address the latter has been voxel-based (or tract-based) analysis of tensor-derived metrics5. Such studies have been neither fibre-specific, nor able to provide a comprehensive insight into both macro- and microscopic WM changes. Here, we perform fixel-based analysis (FBA)6 on diffusion-weighted MRI (DWI) data from AD and mild cognitive impairment (MCI) patients. A key advantage of FBA is its ability to not only detect fibre-specific, within-voxel (“fixel”)7 changes, but additionally to attribute detected WM changes to fibre density loss or altered fibre bundle morphology.Purpose
To investigate how white matter connectivity may be altered in AD and MCI patients, using fixel-based analysis of DWI data.Methods
Diffusion-weighted MRI data was acquired from 49 AD patients, 33 MCI patients, and 95 healthy elderly control (HC) subjects, from the Australian Imaging, Biomarkers and Lifestyle flagship study of aging (AIBL) (Table 1). Images were acquired on a Siemens 3T Trio (60 directions at b-value=3000s/mm2, 8 b=0 s/mm2, 2.3mm isotropic voxels), and DWIs were preprocessed as described in 6. Fibre orientation distributions (FODs) were computed with single-shell, 3-tissue constrained spherical deconvolution (SS3T-CSD)8,9, and spatial correspondence was achieved by registering all FOD images to a study-specific FOD template. Measures of fibre density (FD), fibre bundle cross-section (FC), and a combined measure of fibre density and cross-section (FDC) were obtained6. FBA of FD, FC, and FDC was performed across all white matter fixels to compare AD, MCI and HC groups. Statistical analyses were performed with Connectivity-based Fixel Enhancement (CFE)10 using a General Linear Model, while adjusting for age and intracranial volume (ICV). Each fixel was assigned a family-wise error corrected p-value, and significant fixels (p<0.05) were displayed. All preprocessing steps, statistical analyses and visualisations were performed using MRtrix3 (www.mrtrix.org). Tract-of-interest analysis was subsequently performed to determine if MCI patients exhibited decreases in FDC specifically within the 11 WM fibre tracts that were significantly altered in the AD group. Tracts were identified from the results of whole-brain FBA, and mean FDC within each tract was compared between AD, MCI and HC groups in R, using a one-way ANCOVA (with age, sex and ICV as covariates) with Dunnett’s correction for multiple groups.Results
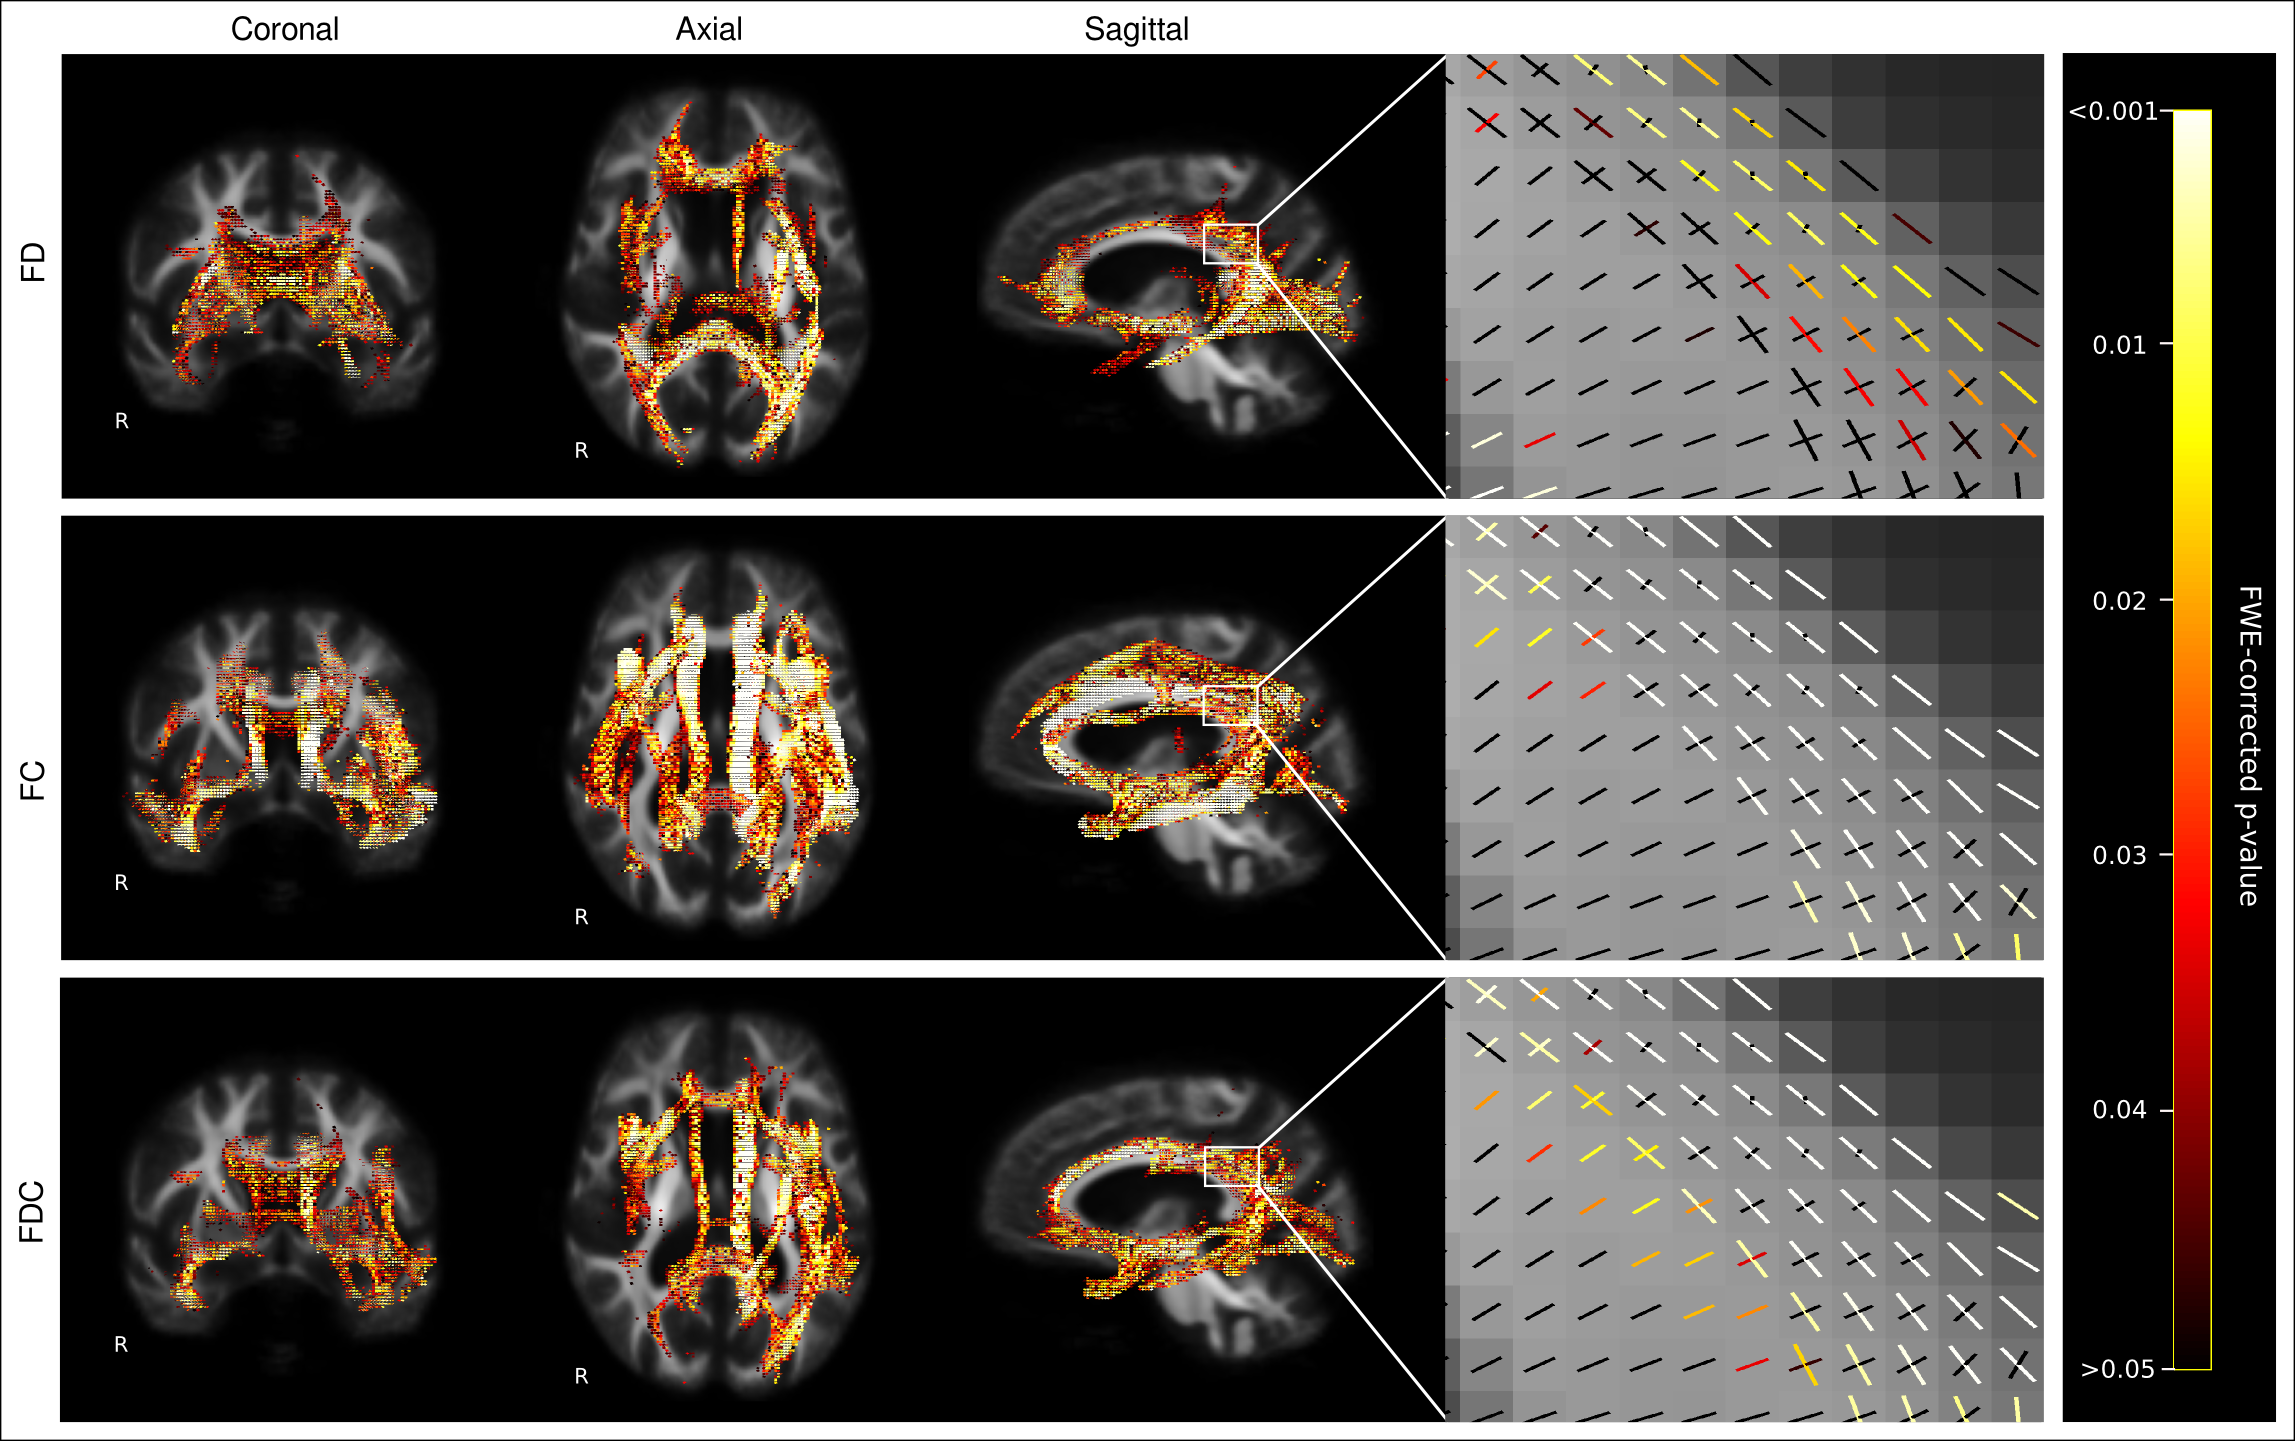
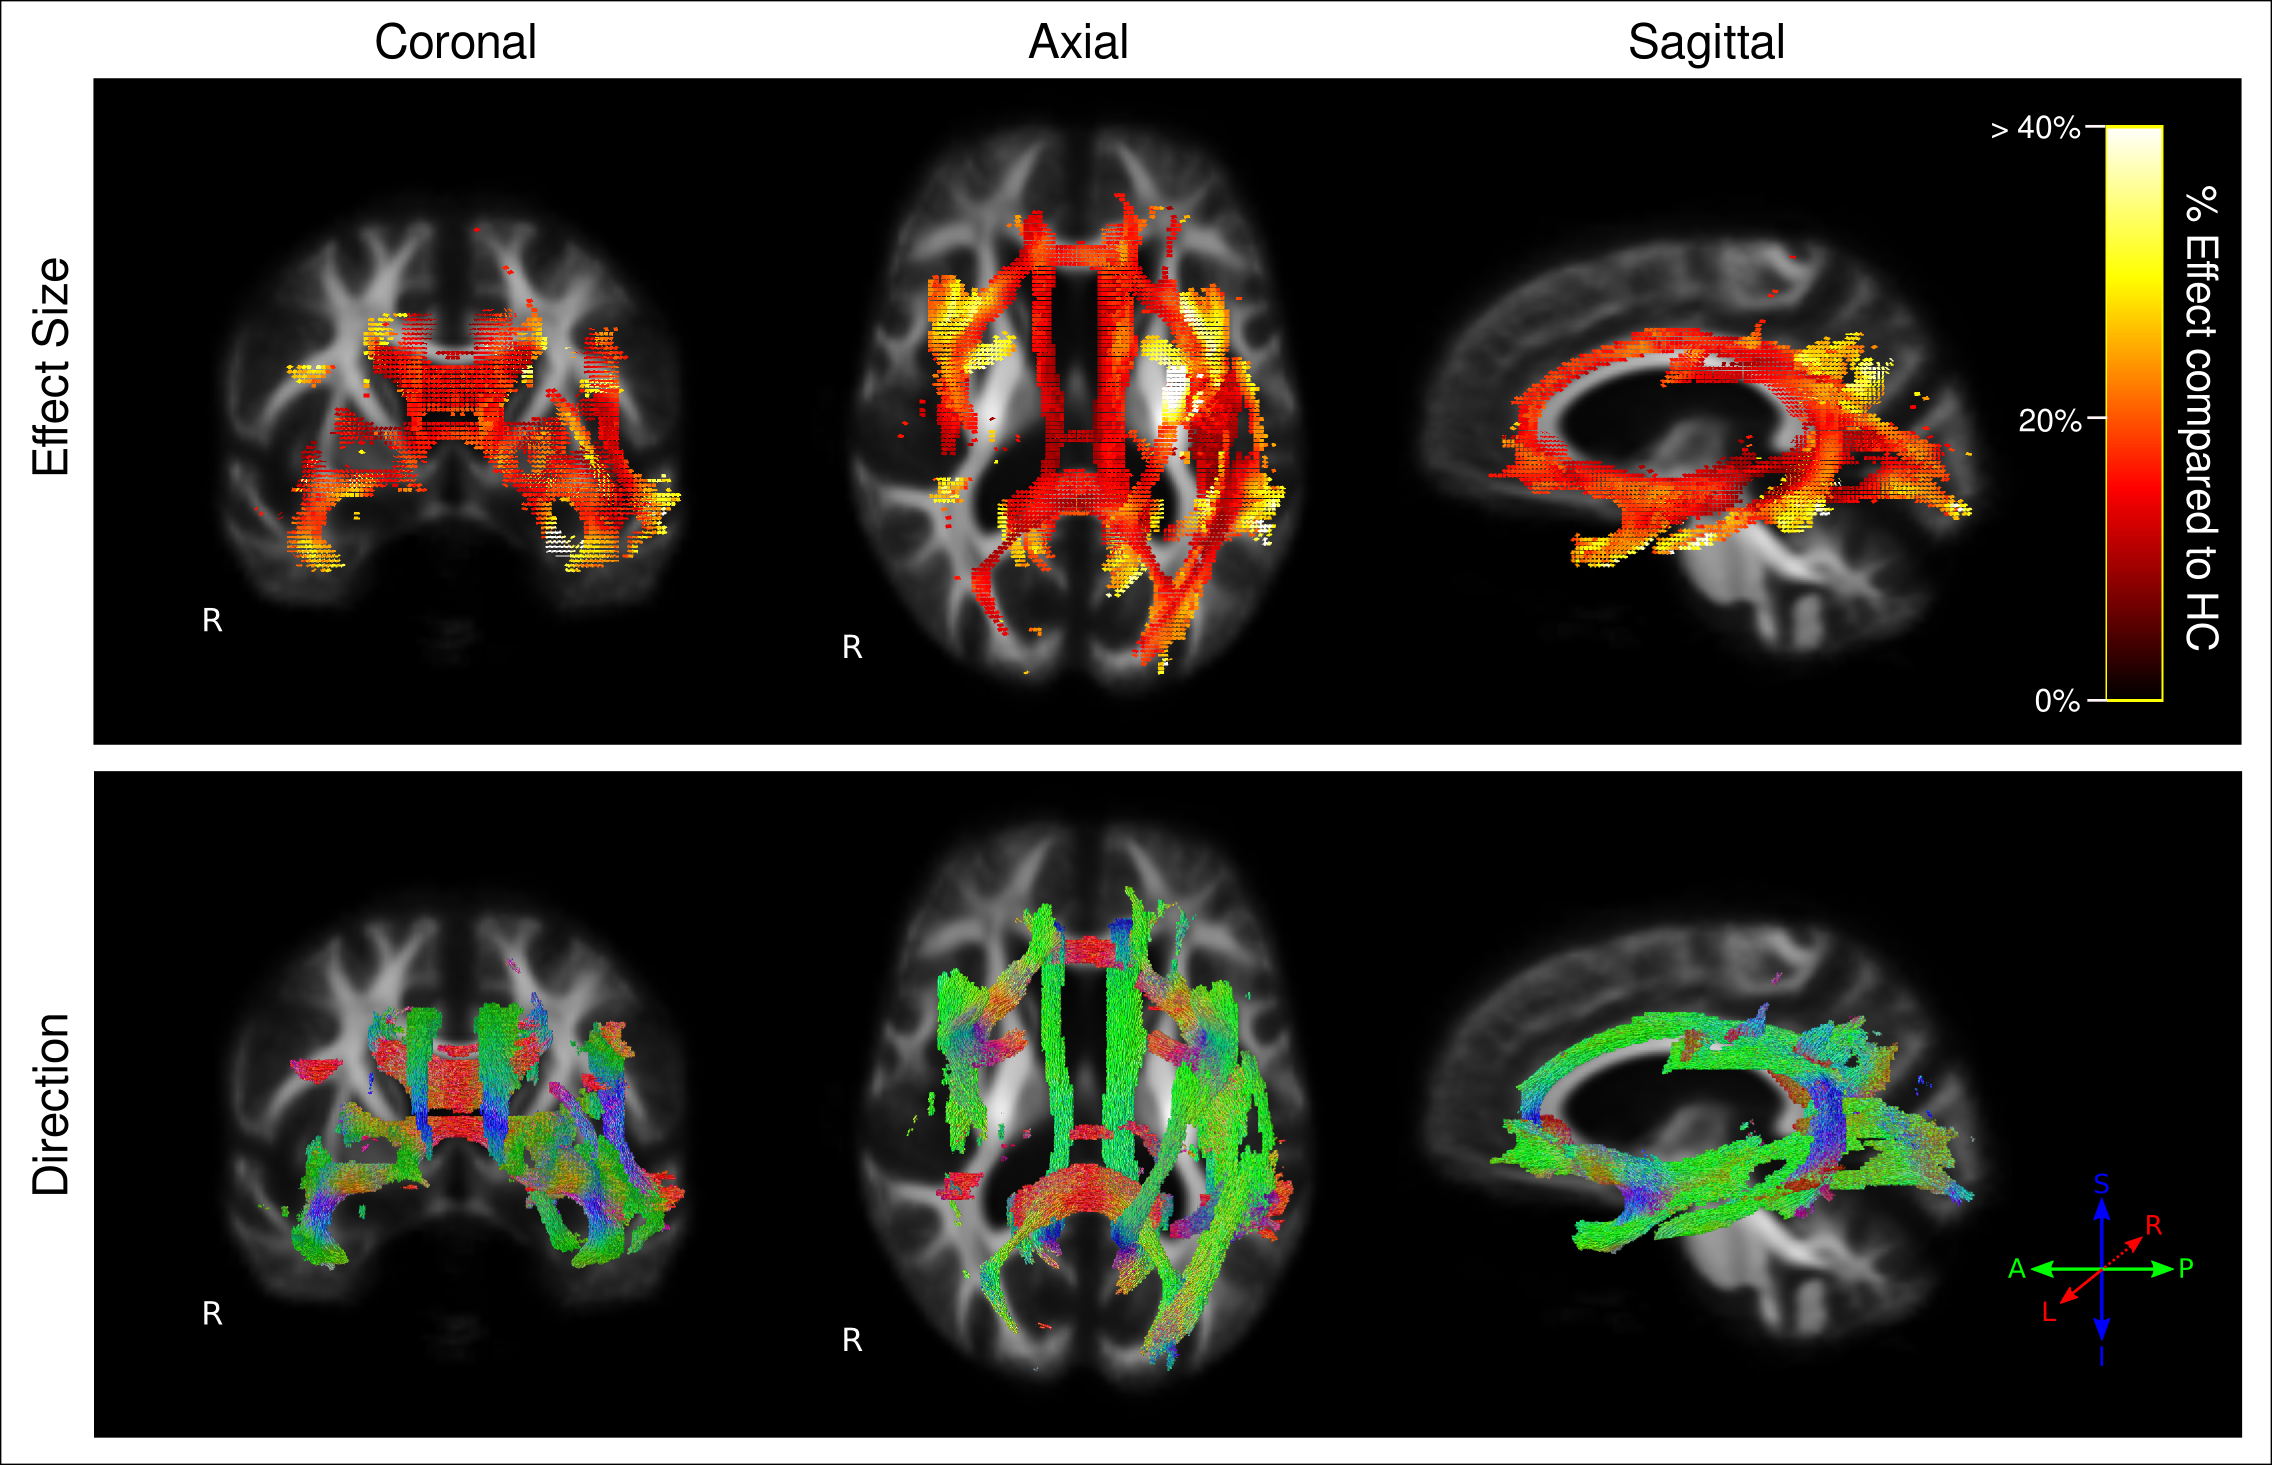
Figure 1 shows fixels with significant decreases in FD, FC, and FDC in AD patients compared to control subjects. FDC is considered the most comprehensive metric, given that fibre density and cross-section changes are combined6. As shown by the effect size map in Figure 2, large reductions in FDC were observed in AD patients, which could be interpreted as a decrease in the intra-axonal volume within affected fibre bundles. Fibre tracts identified with a significant reduction in FDC included the cingulum, uncinate fasciculus, arcuate fasciculus, inferior longitudinal fasciculus (ILF), inferior fronto-occipital fasciculus (IFOF), and splenium and genu of the corpus callosum (Figure 2).
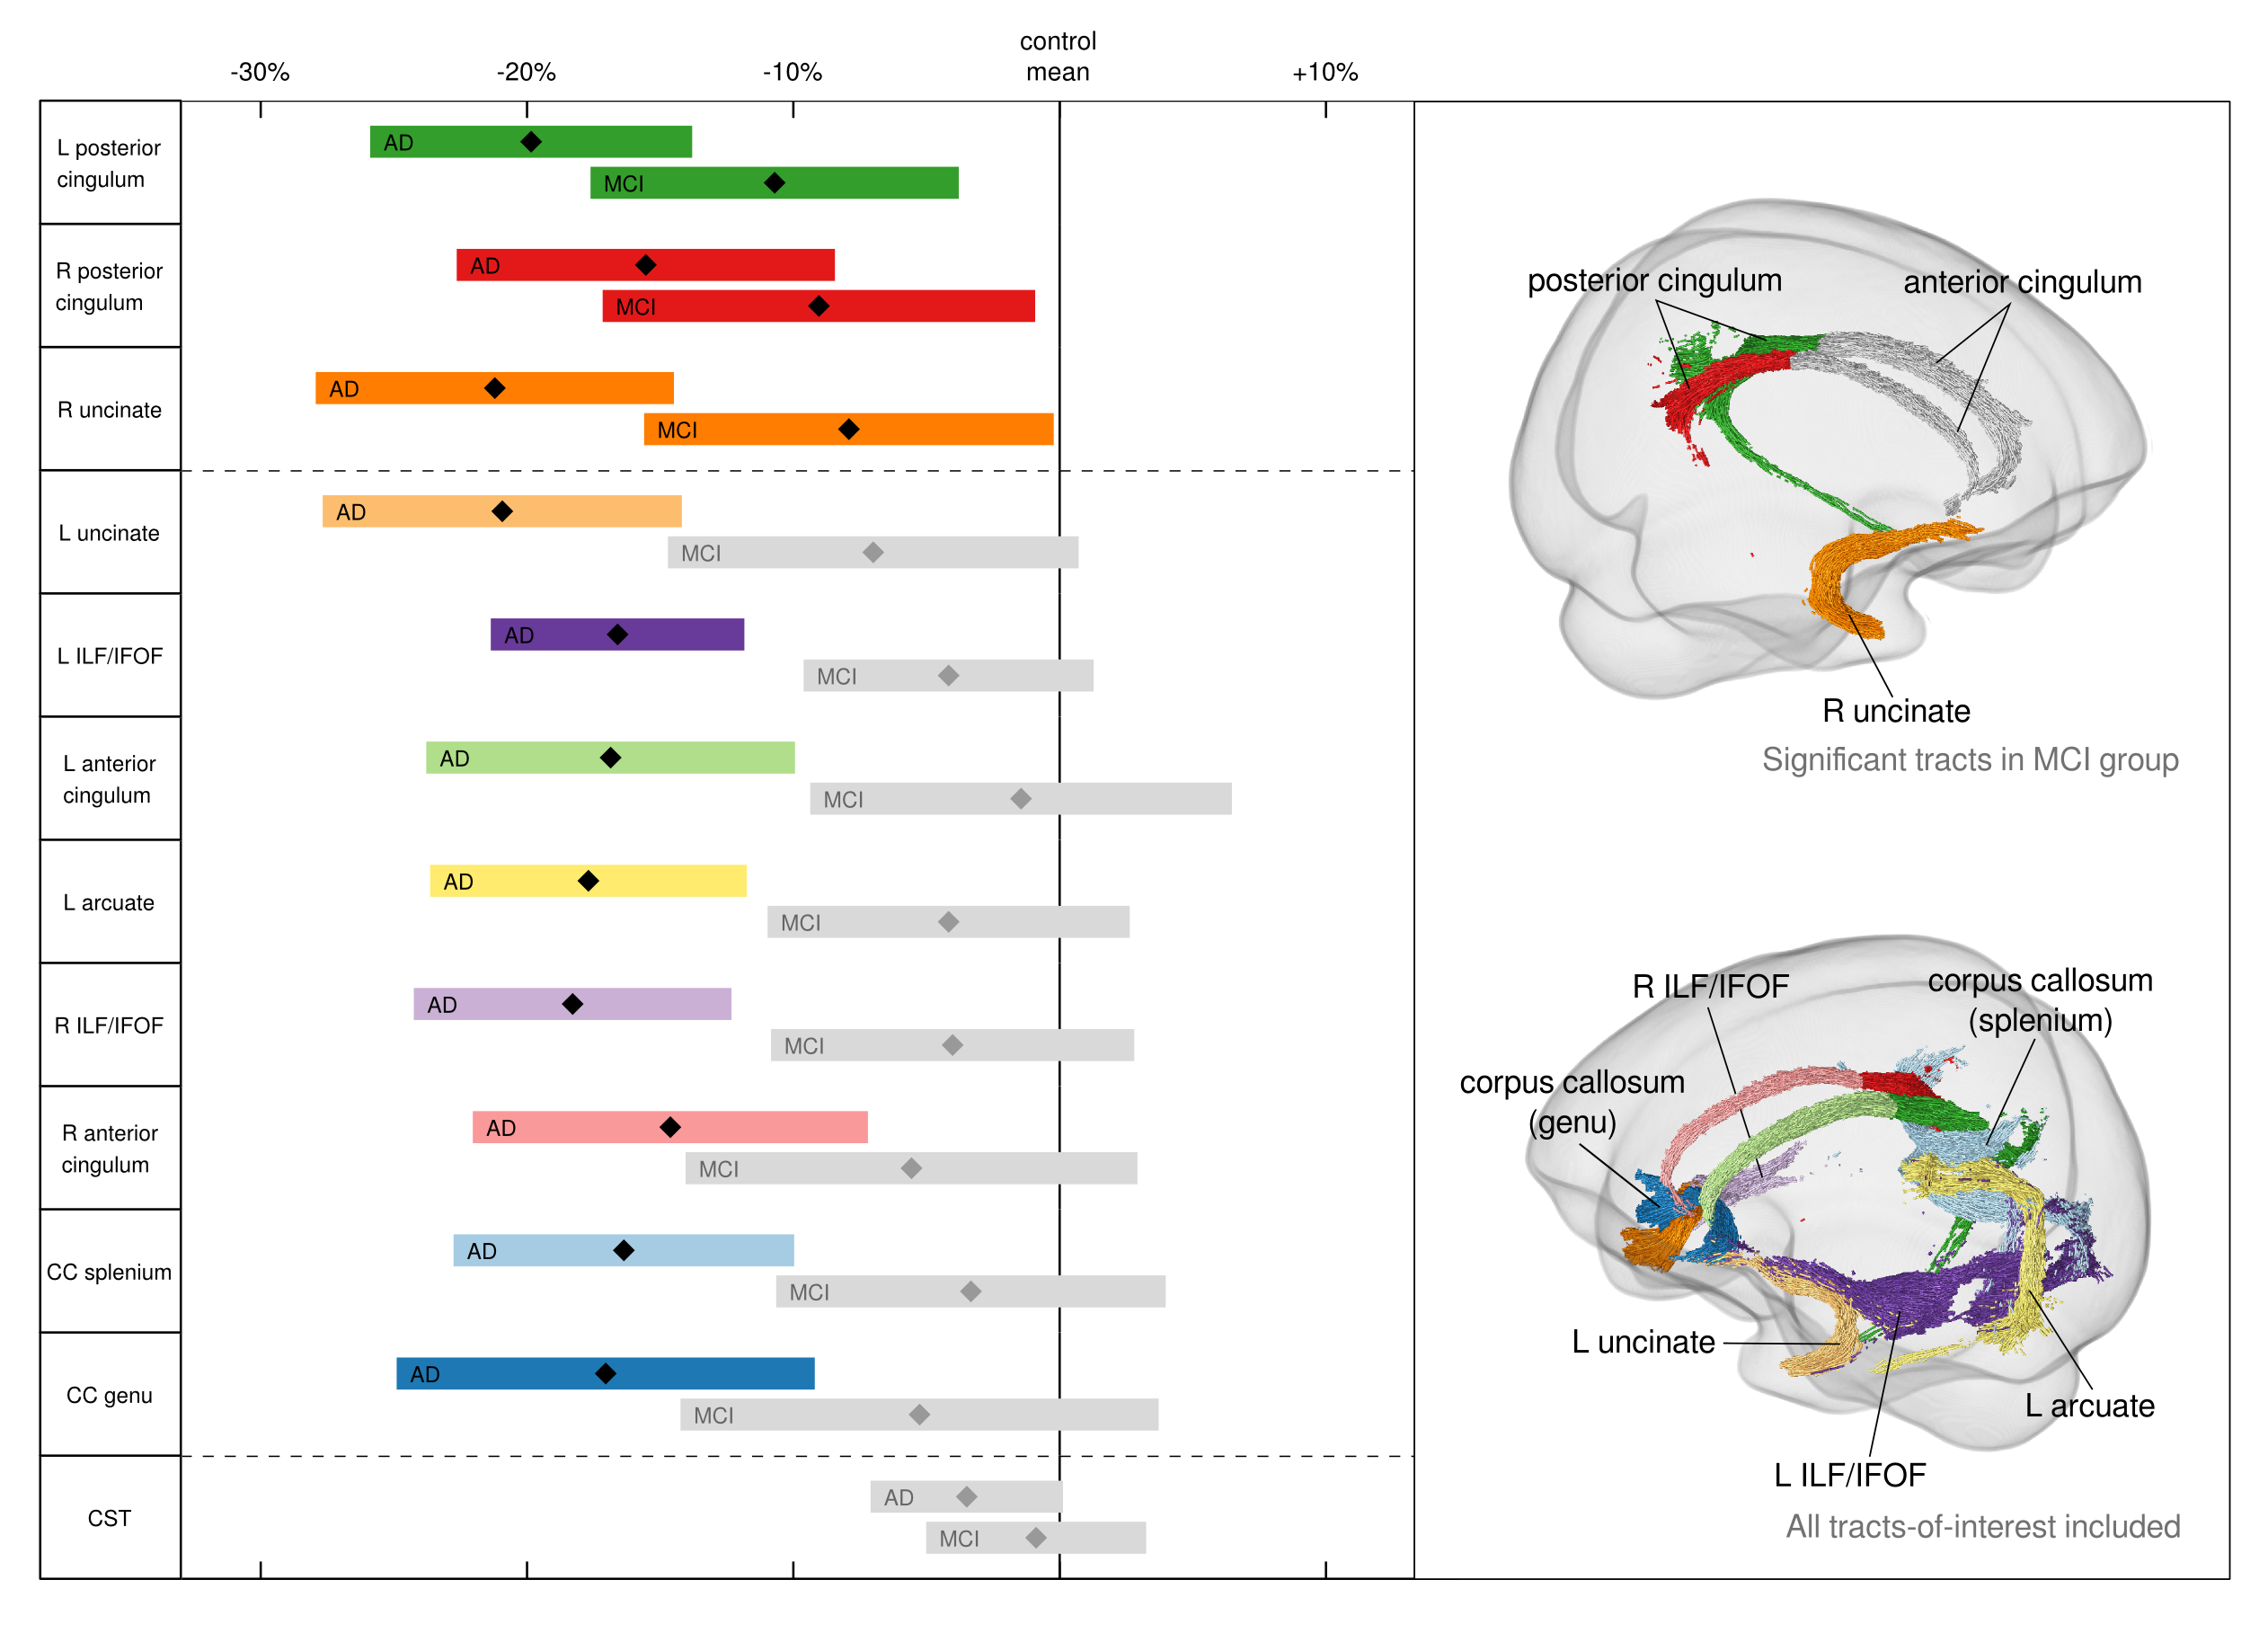
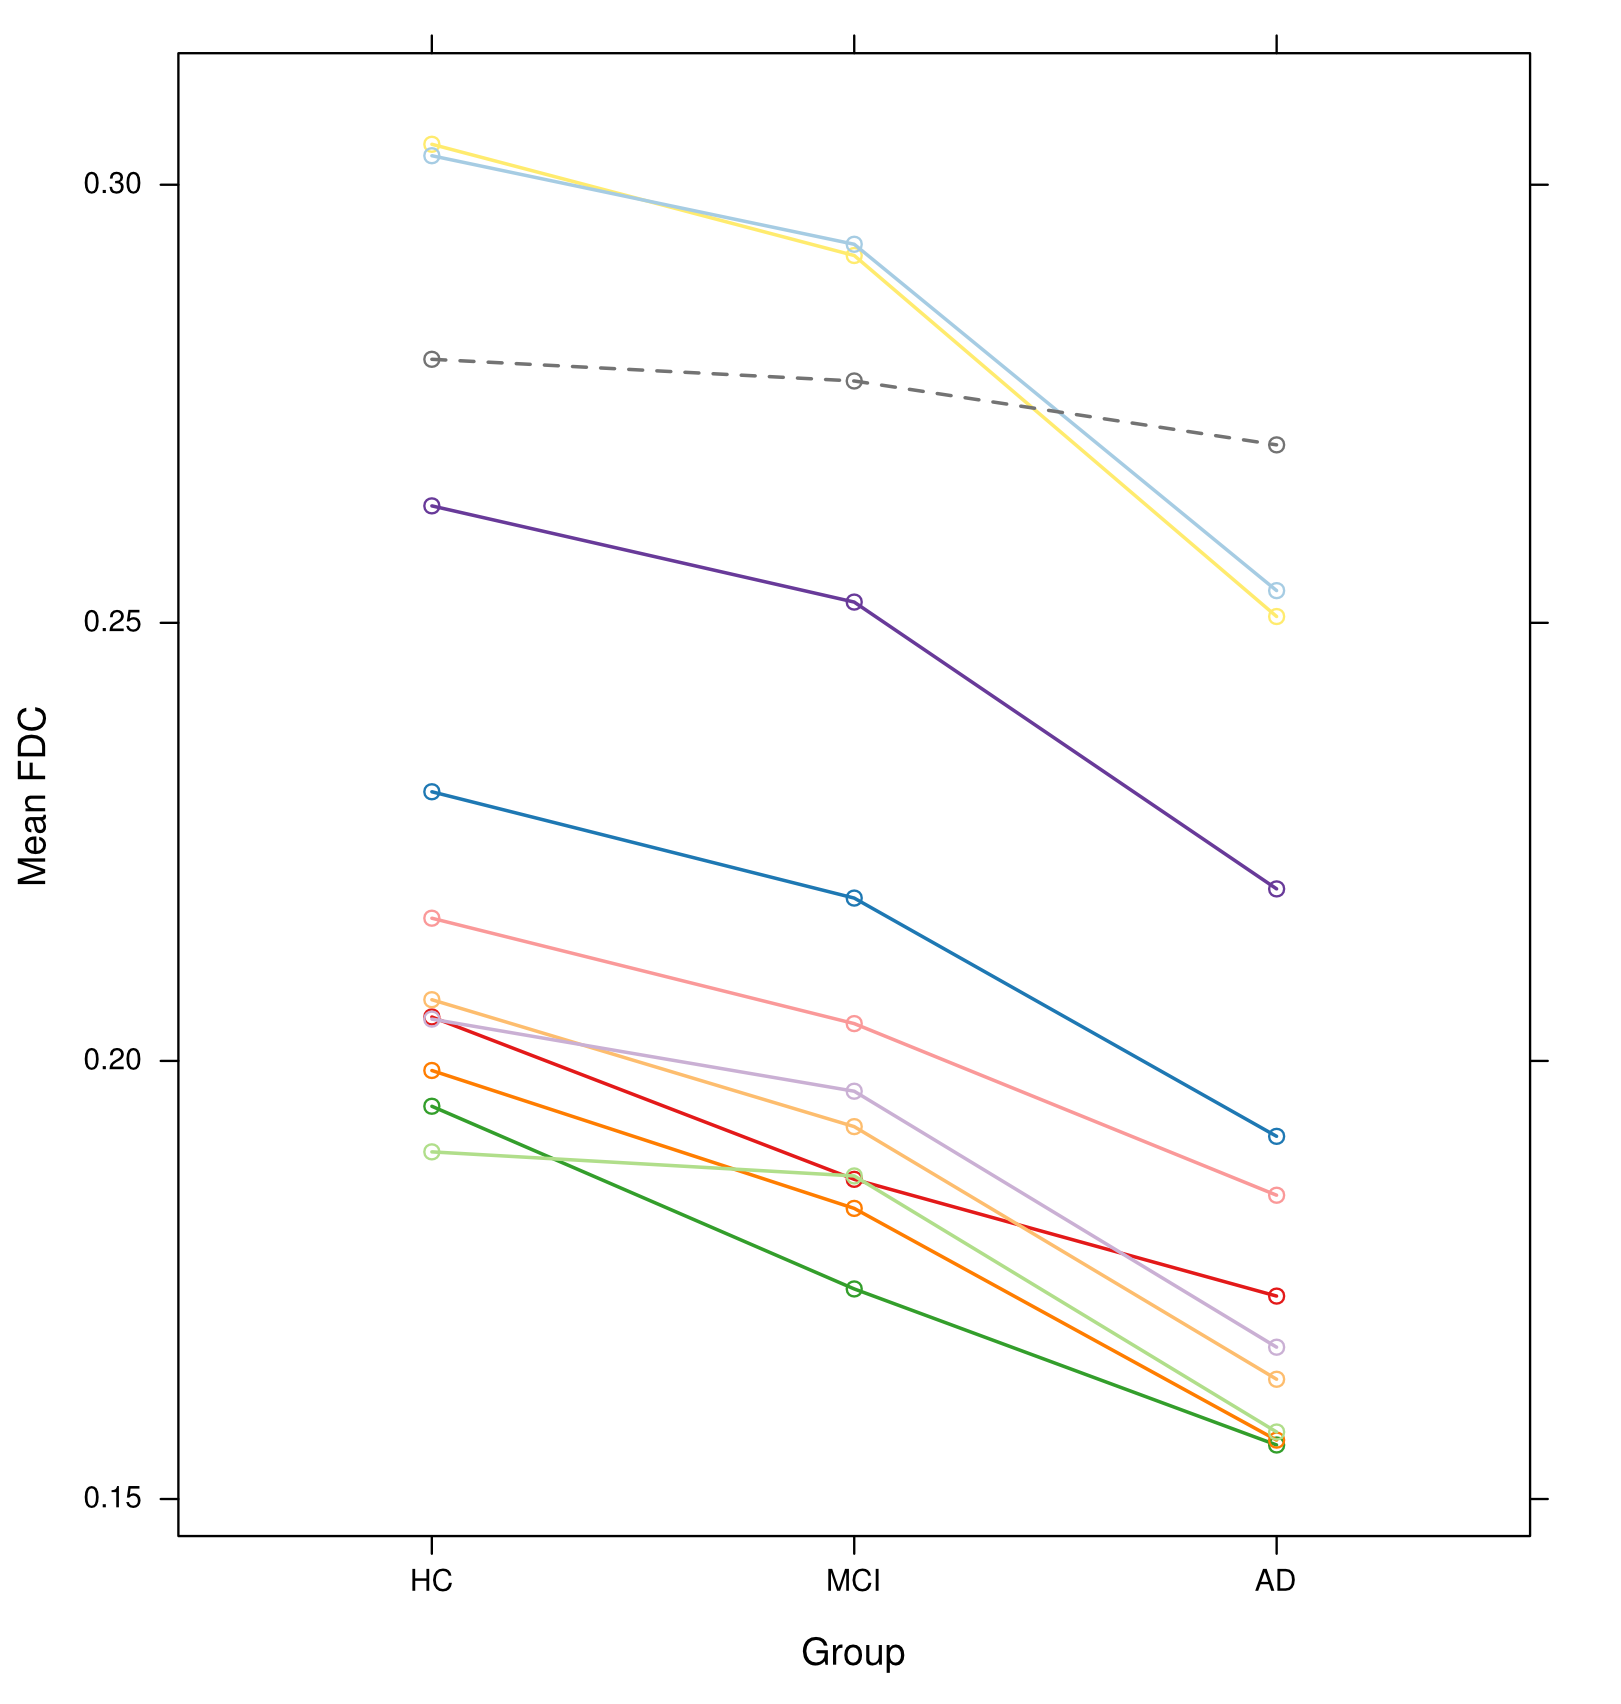
MCI patients did not exhibit significant decreases in any metric when compared to HC upon whole-brain FBA. Figure 3 shows that, when tract-of-interest analysis was performed for further characterisation, MCI participants exhibited significantly decreased FDC in the bilateral posterior cingulum and right uncinate fasciculus only. However, all 11 tracts showed a consistent trend toward decreased FDC compared to control subjects (Figures 3 & 4).
Discussion and Conclusion
We observed extensive decreases in FD, FC, and FDC across several fibre pathways that have been previously implicated in AD5. However, the added value of this study was that, by using FBA, substantial reductions in the total intra-axonal volume of specific fibre pathways could be identified, even within crossing-fibre regions. MCI patients did not exhibit such substantial decreases, although tract-of-interest analysis revealed the posterior cingulum and uncinate as early affected pathways in this group.
Together, our results demonstrate widespread, specific WM changes that are associated with AD, and indicate that altered connectivity in AD patients likely arises from a combination of microscopic fibre density loss, and macroscale fibre bundle atrophy. Furthermore, while the MCI patients in our study cannot all be assumed to represent a prodromal AD cohort, the findings from tract-of-interest analysis suggest that WM changes are likely to be closely linked to cognitive deficits, and may progress along the AD spectrum.
Acknowledgements
No acknowledgement found.References
1. Seeley WW, Crawford RK, Zhou J, Miller BL, Greicius MD. Neurodegenerative diseases target large-scale human brain networks. Neuron. 2009;62(1):42-52.
2. Delbeuck X, Van der Linden M, Collette F. Alzheimer's disease as a disconnection syndrome? Neuropsychol Rev. 2003;13(2):79-92.
3. Ashburner J, Friston KJ. Voxel-based morphometry—the methods. NeuroImage. 2000;11(6):805-21.
4. Li J, Pan P, Huang R, Shang H. A meta-analysis of voxel-based morphometry studies of white matter volume alterations in Alzheimer's disease. Neurosci Biobehav R. 2012;36(2):757-63.
5. Sexton CE, Kalu UG, Filippini N, Mackay CE, Ebmeier KP. A meta-analysis of diffusion tensor imaging in mild cognitive impairment and Alzheimer's disease. Neurobiol Aging. 2011;32(12):2322. e5-. e18.
6. Raffelt DA, Tournier J-D, Smith RE, Vaughan DN, Jackson G, Ridgway GR, et al. Investigating white matter fibre density and morphology using fixel-based analysis. NeuroImage. 2016.
7. Raffelt D, Tournier J-D, Rose S, Ridgway GR, Henderson R, Crozier S, et al. Apparent fibre density: a novel measure for the analysis of diffusion-weighted magnetic resonance images. NeuroImage. 2012;59(4):3976-94.
8. Dhollander T, Connelly A. A novel iterative approach to reap the benefits of multi-tissue CSD from just single-shell (+b=0) diffusion MRI data. Proc ISMRM 2016;24:3010.
9. Dhollander T, Raffelt D, Connelly A. Unsupervised 3-tissue response function estimation from single-shell or multi-shell diffusion MR data without a co-registered T1 image. Proc ISMRM Workshop on Breaking the Barriers of Diffusion MRI 2016:5.
10. Raffelt DA, Smith RE, Ridgway GR, Tournier J-D, Vaughan DN, Rose S, et al. Connectivity-based fixel enhancement: Whole-brain statistical analysis of diffusion MRI measures in the presence of crossing fibres. NeuroImage. 2015;117:40-55.
Figures
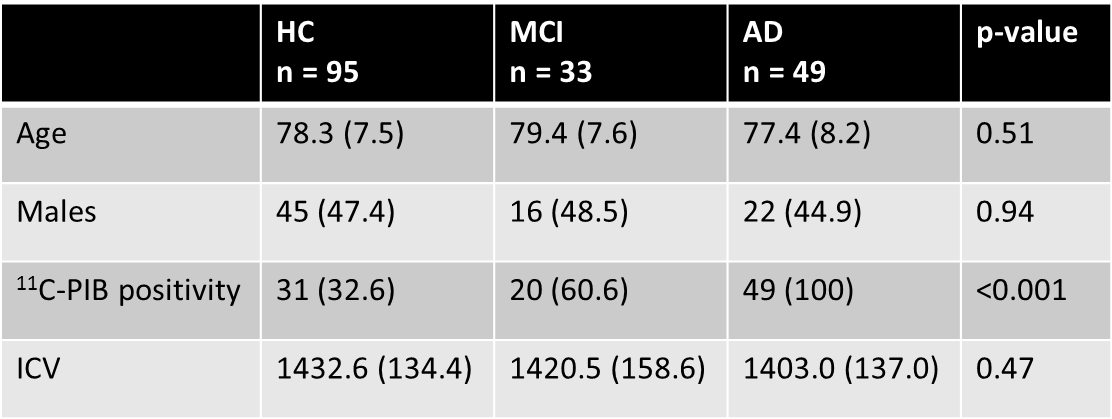
Table 1: Demographic and clinical characteristics of participants
Data are presented as mean (SD) or number (%). Reported p-values from one-way between-groups ANOVA for age and intracranial volume, and chi-square test for independence for sex and 11C-PIB positivity. AD = Alzheimer’s disease patients. 11C-PIB = Carbon-11 labelled Pittsburgh Compound B. HC = healthy elderly controls. ICV = intracranial volume (cm3). MCI = mild cognitive impairment patients.