4120
Reduced BOLD connectivity is related to hypoperfusion in Alzheimer’s disease1Department of Neuroradiology, Technische Universität München, Munich, Germany
Synopsis
BOLD-functional connectivity (BOLD-FC) is decreased in Alzheimer’s disease (AD), and suggested to reflect reduced coherence of neural activity. However, the BOLD signal is based on vascular hemodynamics, therefore, impaired perfusion might also contribute to reduced BOLD-FC. Here, 32 AD patients and 22 controls underwent a simultaneous MR/PET, assessing BOLD-FC by resting-state fMRI, baseline CBF by pASL, and neuronal activity by FDG-uptake. Patients’ BOLD-FC, CBF, and FDG-uptake were reduced within the same precuneal regions. BOLD-FC was positively associated with mean CBF, specifically in patients and independently from FDG-uptake. Data indicate that impaired vascular hemodynamics contribute to reduced BOLD-FC in AD.
Purpose:
Reductions in the functional connectivity of blood oxygenation level dependent signal fluctuations (BOLD-FC) in resting-state functional magnetic resonance imaging (fMRI) are consistent findings in Alzheimer’s disease (AD), ranging from preclinical stages to mild cognitive impairment and dementia 1-3. Such BOLD-FC changes are most consistently located in temporal and parietal regions of the posterior default mode network (pDMN) and typically interpreted as a loss in coherence of neuronal population activity 4. However, as the BOLD signal reflects the hemodynamic response to neuronal activity, it also highly depends on cerebral blood flow (CBF) and oxygenation changes induced by local neuronal activity 5. Therefore, changes in BOLD-FC in AD might reflect changes in both neuronal and vascular-hemodynamic processes. Indeed, both reduced neuronal activity estimated by 18F-fluorodeoxyglucose-positron emission tomography (FDG-PET) and reduced baseline CBF measured by arterial spin labelling (ASL) overlapped remarkably in the pDMN of AD patients 6-8. To address this question, we used a hybrid MR/PET to acquire resting-state fMRI to assess BOLD-FC in the pDMN, pulsed ASL (pASL), and FDG-PET in patients with AD and healthy controls. BOLD-FC and CBF of the pDMN were associated by the use of ANCOVA across all subjects, controlled for glucose metabolism.Methods:
32 AD patients (65.9 ± 7.4 years, 18 female, MMSE 22.1 ± 4.2) and 22 controls (63.6 ± 7.3 years, 11 female, MMSE 28.6 ± 1.2) were examined on a clinical 3T mMR Biograph scanner (Siemens Medical Solutions), where resting-state fMRI, pASL and FDG-PET were assessed simultaneously. 240 fMRI EPI volumes were acquired (TR/TE/α = 2000ms/30ms/90°; 35 slices (gap 0.6mm), FOV 192mm; matrix size 64x64; voxel size 3.0x3.0x3.0mm3), preprocessed and subjected to an independent component analysis using gift-toolbox (http://icatb.sourceforge.net) to calculate BOLD-FC within the pDMN (Fig. 1A). PASL data (TR/TE = 2500ms/13ms; 11/16 oblique slices (gap 0.6mm); matrix size 64x63, voxel size 4x4x6mm3; 80 pairs of label-control) were preprcocessed and corrected for partial volume effects as described previously 9. FDG-PET (list-mode acquisition 30min p.i., 15min acquisition time, 128 slices covering the whole brain; FOV 450 mm; matrix size 192x192; voxel size 3.7x2.3x2.7mm, UET-based attenuation correction) was performed, resulting activity maps were normalized on cerebellar uptake and corrected for partial volume effects using PMOD (PMOD Technologies Ltd., Adliswil, Switzerland). All maps were normalized to MNI space and smoothed with the same Gaussian kernel of 8x8x8mm (FWHM) using SPM12 (Wellcome Department of Cognitive Neurology, London, UK). Maps of BOLD-FC, CBF and relative FDG-uptake were subjected to a two-sample t-test between groups, controlled for age, sex and atrophy using SPM12. We conducted an ANCOVA as implemented in SPSS 23 (IBM, Armonk, NY, USA) with pDMN’s averaged BOLD-FC as the dependent variable. Independent variables were the factor group (patients vs. healthy controls), the variables-of-interest pDMN’s mean CBF and the interaction of group with CBF. To investigate the effects of CBF on BOLD-FC independently from effects of neuronal activity, we introduced pDMN’s mean relative FDG-uptake as a covariate-of-no-interest. Likewise, age, sex and atrophy were included as variables-of-no-interest. Furthermore, we applied a corresponding voxel-wise ANCOVA design to spatially localize the observed effects in the pDMN using SPM12. Here, voxel-wise BOLD-FC maps were the dependent variable and the independent variables and variables-of-no-interest were the same as mentioned above.Results:
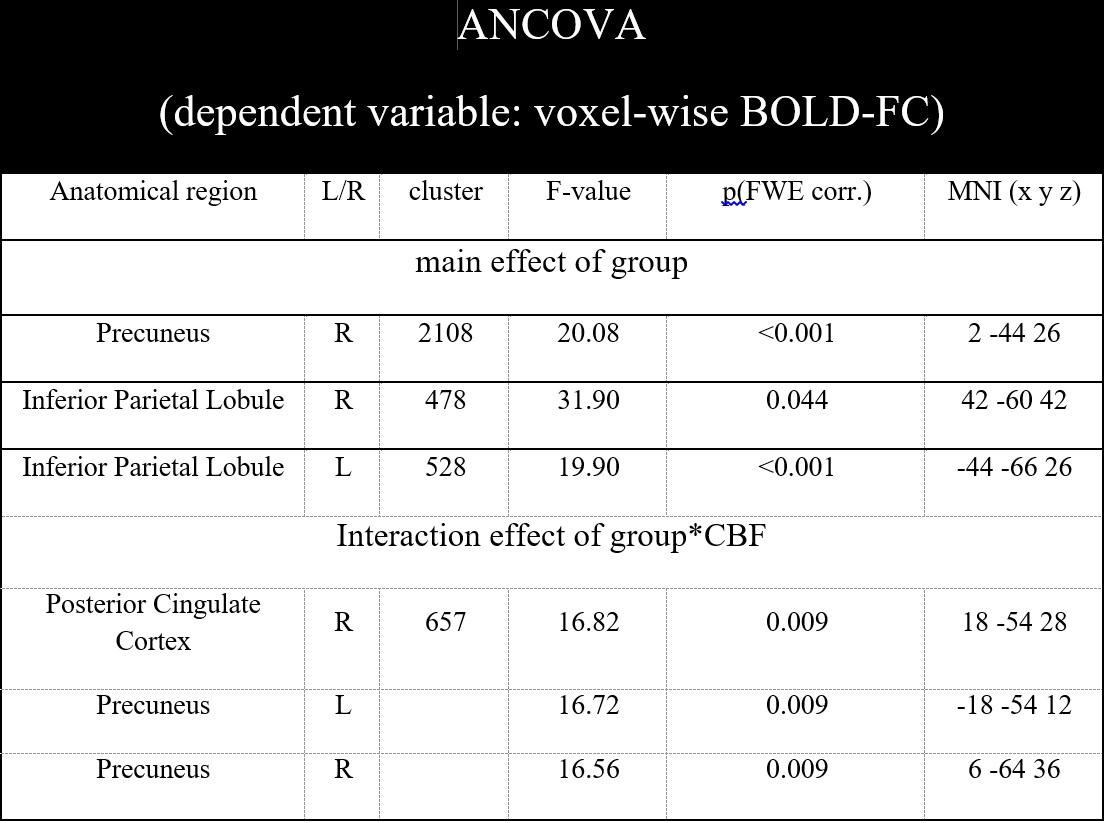
Patients’ BOLD-FC, CBF, and glucose metabolism were reduced within the same precuneal parietal regions (Fig. 1B). ANCOVA of averaged BOLD-FC yielded a significant main effect of group (F(1,54)=5.764, p=0.020; Tab. 1) and an interaction effect of group*CBF (F(1,54)=5.254, p=0.027; Tab. 1). Voxel-wise ANCOVA also yielded a significant main effect of group in the whole pDMN and an interaction effect for group*CBF in a cluster within the precuneus (k=657, F(1,42)=16.82, p=0.009 FWE corrected, Fig. 2A). To visualize the interaction effect, correlations between mean CBF and BOLD-FC in the cluster of the interaction effect were calculated (patients: r=0.386, p=0.029; healthy controls: r=-0.379, p=0.082, Fig. 2B).Discussion:
We found overlapping reductions of BOLD-FC, hypoperfusion and glucose hypometabolism in AD. Reduced pDMN’s BOLD-FC was significantly associated with hypoperfusion, independently of reduced neuronal activity, specifically in AD. These findings were located in the precuneal pDMN, which overlaps with patterns of reduced BOLD-FC and CBF (Fig. 1 and 2). The precuneus is at the focus of the earliest and multidimensional alterations that occur across the course of AD, suggesting complex interaction trajectories among distinct pathophysiological processes 10. Our study contributes to this research by studying explicitly interactions between BOLD-FC and vascular-hemodynamic processes while controlling for neuronal activity.Conclusion:
Results support the notion that in AD, vascular-hemodynamic factors disrupt BOLD-FC beyond effects of reduced neuronal activity.Acknowledgements
The authors would like to thank the members of the Departments of Nuclear Medicine and Psychiatry at the Klinikum rechts der Isar, Technische Universität München, for their fruitful collaboration.References
1. Sorg C, Riedl V, Muhlau M, et al. Selective changes of resting-state networks in individuals at risk for Alzheimer's disease. Proceedings of the National Academy of Sciences of the United States of America 2007;104:18760-5.
2. Greicius MD, Srivastava G, Reiss AL, et al. Default-mode network activity distinguishes Alzheimer's disease from healthy aging: evidence from functional MRI. Proceedings of the National Academy of Sciences of the United States of America 2004;101:4637-42.
3. Lim HK, Nebes R, Snitz B, et al. Regional amyloid burden and intrinsic connectivity networks in cognitively normal elderly subjects. Brain : a journal of neurology 2014;137:3327-38.
4. Buckner RL, Andrews-Hanna JR, Schacter DL. The brain's default network: anatomy, function, and relevance to disease. Annals of the New York Academy of Sciences 2008;1124:1-38.
5. Buxton RB, Uludag K, Dubowitz DJ, et al. Modeling the hemodynamic response to brain activation. NeuroImage 2004;23 Suppl 1:S220-33.
6. Musiek ES, Chen Y, Korczykowski M, et al. Direct comparison of fluorodeoxyglucose positron emission tomography and arterial spin labeling magnetic resonance imaging in Alzheimer's disease. Alzheimer's & dementia : the journal of the Alzheimer's Association 2012;8:51-9.
7. Chen Y, Wolk DA, Reddin JS, et al. Voxel-level comparison of arterial spin-labeled perfusion MRI and FDG-PET in Alzheimer disease. Neurology 2011;77:1977-85.
8. Verclytte S, Lopes R, Lenfant P, et al. Cerebral Hypoperfusion and Hypometabolism Detected by Arterial Spin Labeling MRI and FDG-PET in Early-Onset Alzheimer's Disease. Journal of neuroimaging : official journal of the American Society of Neuroimaging 2016;26:207-12.
9. Preibisch C, Sorg C, Forschler A, et al. Age-related cerebral perfusion changes in the parietal and temporal lobes measured by pulsed arterial spin labeling. Journal of magnetic resonance imaging : JMRI 2011;34:1295-302.
10. Iturria-Medina Y, Sotero RC, Toussaint PJ, et al. Early role of vascular dysregulation on late-onset Alzheimer's disease based on multifactorial data-driven analysis. Nature communications 2016;7:11934.
Figures
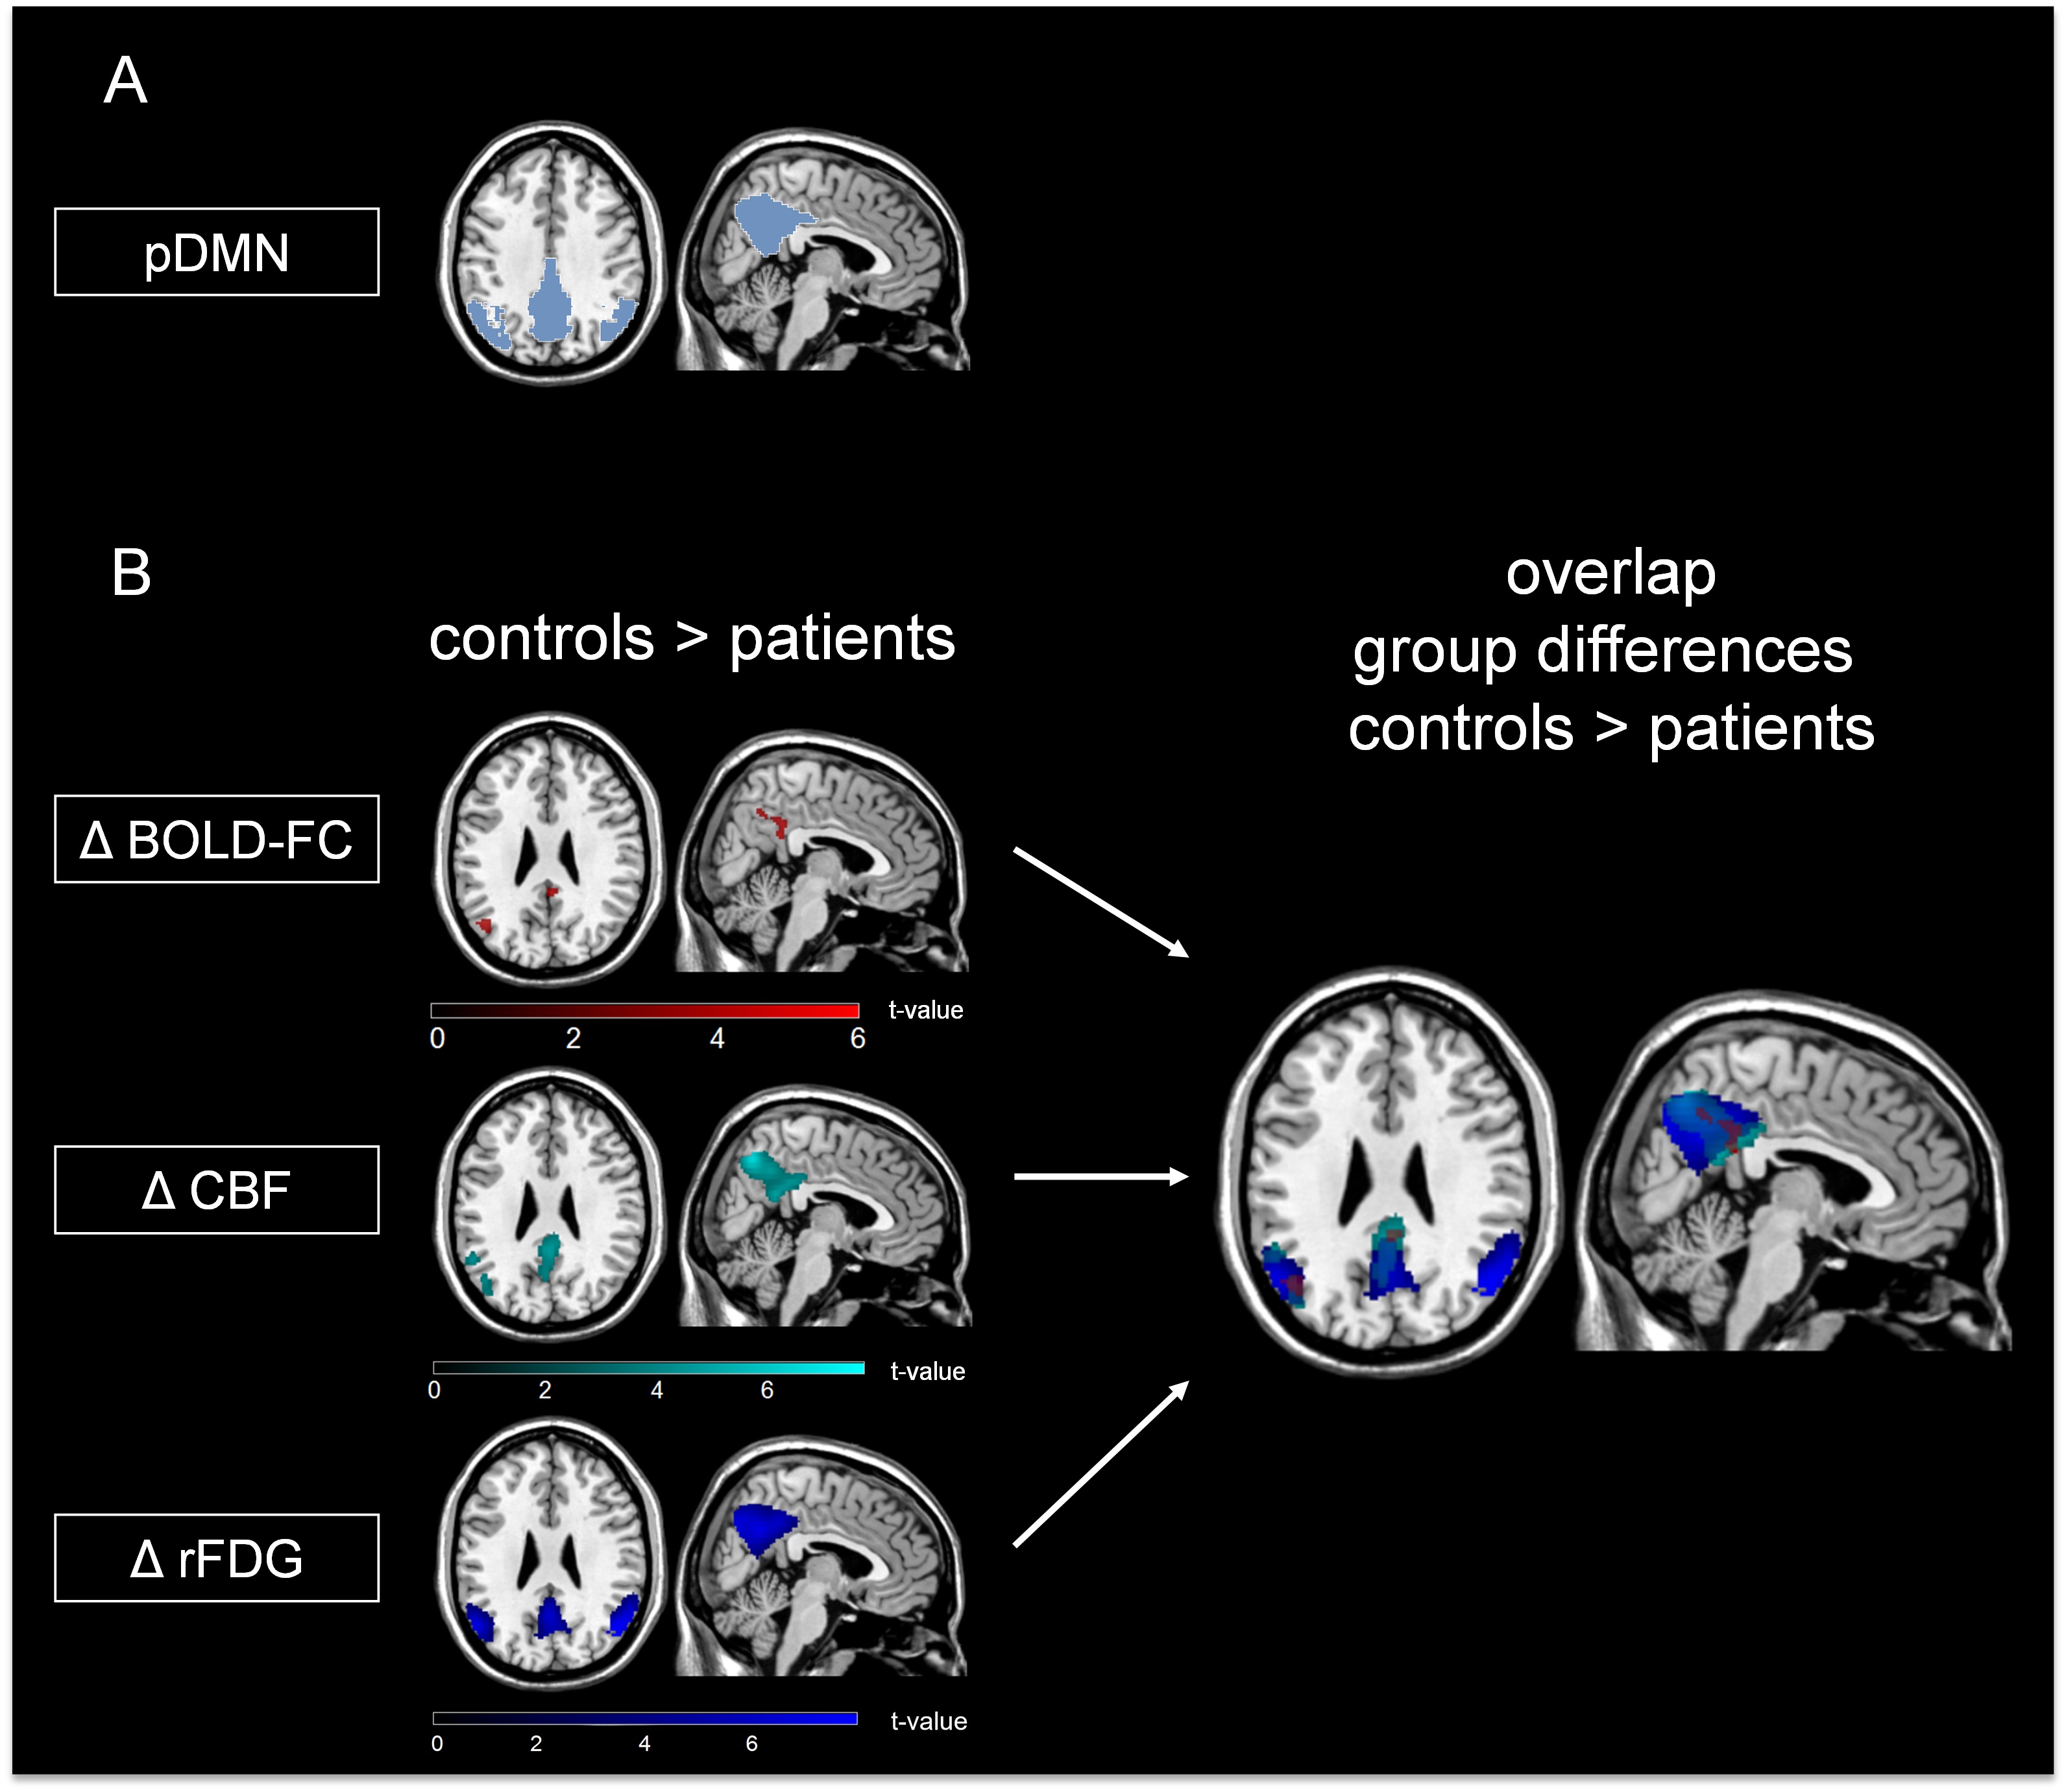
Fig. 1: Spatial overlap of reduced BOLD-FC, CBF and relative FDG-uptake in patients with AD compared to healthy controls.
(A) pDMN mask: Independent component analysis of resting-state fMRI data revealed a pDMN matching component for each subject. Patients’ and healthy controls’ BOLD-FC maps of the pDMN were binarized based on a one-sample t-test, p<0.05 FWE corrected, k=1000. (B) Group differences and spatial overlap of areas with reduced BOLD-FC (Δ BOLD-FC (red)), CBF (Δ CBF (cyan)) and relative FDG-uptake (Δ rFDG (blue)) in patients compared to healthy controls are demonstrated (two-sample t-test, p<0.001 (cluster defining threshold), k>50, p<0.05 FWE corrected).
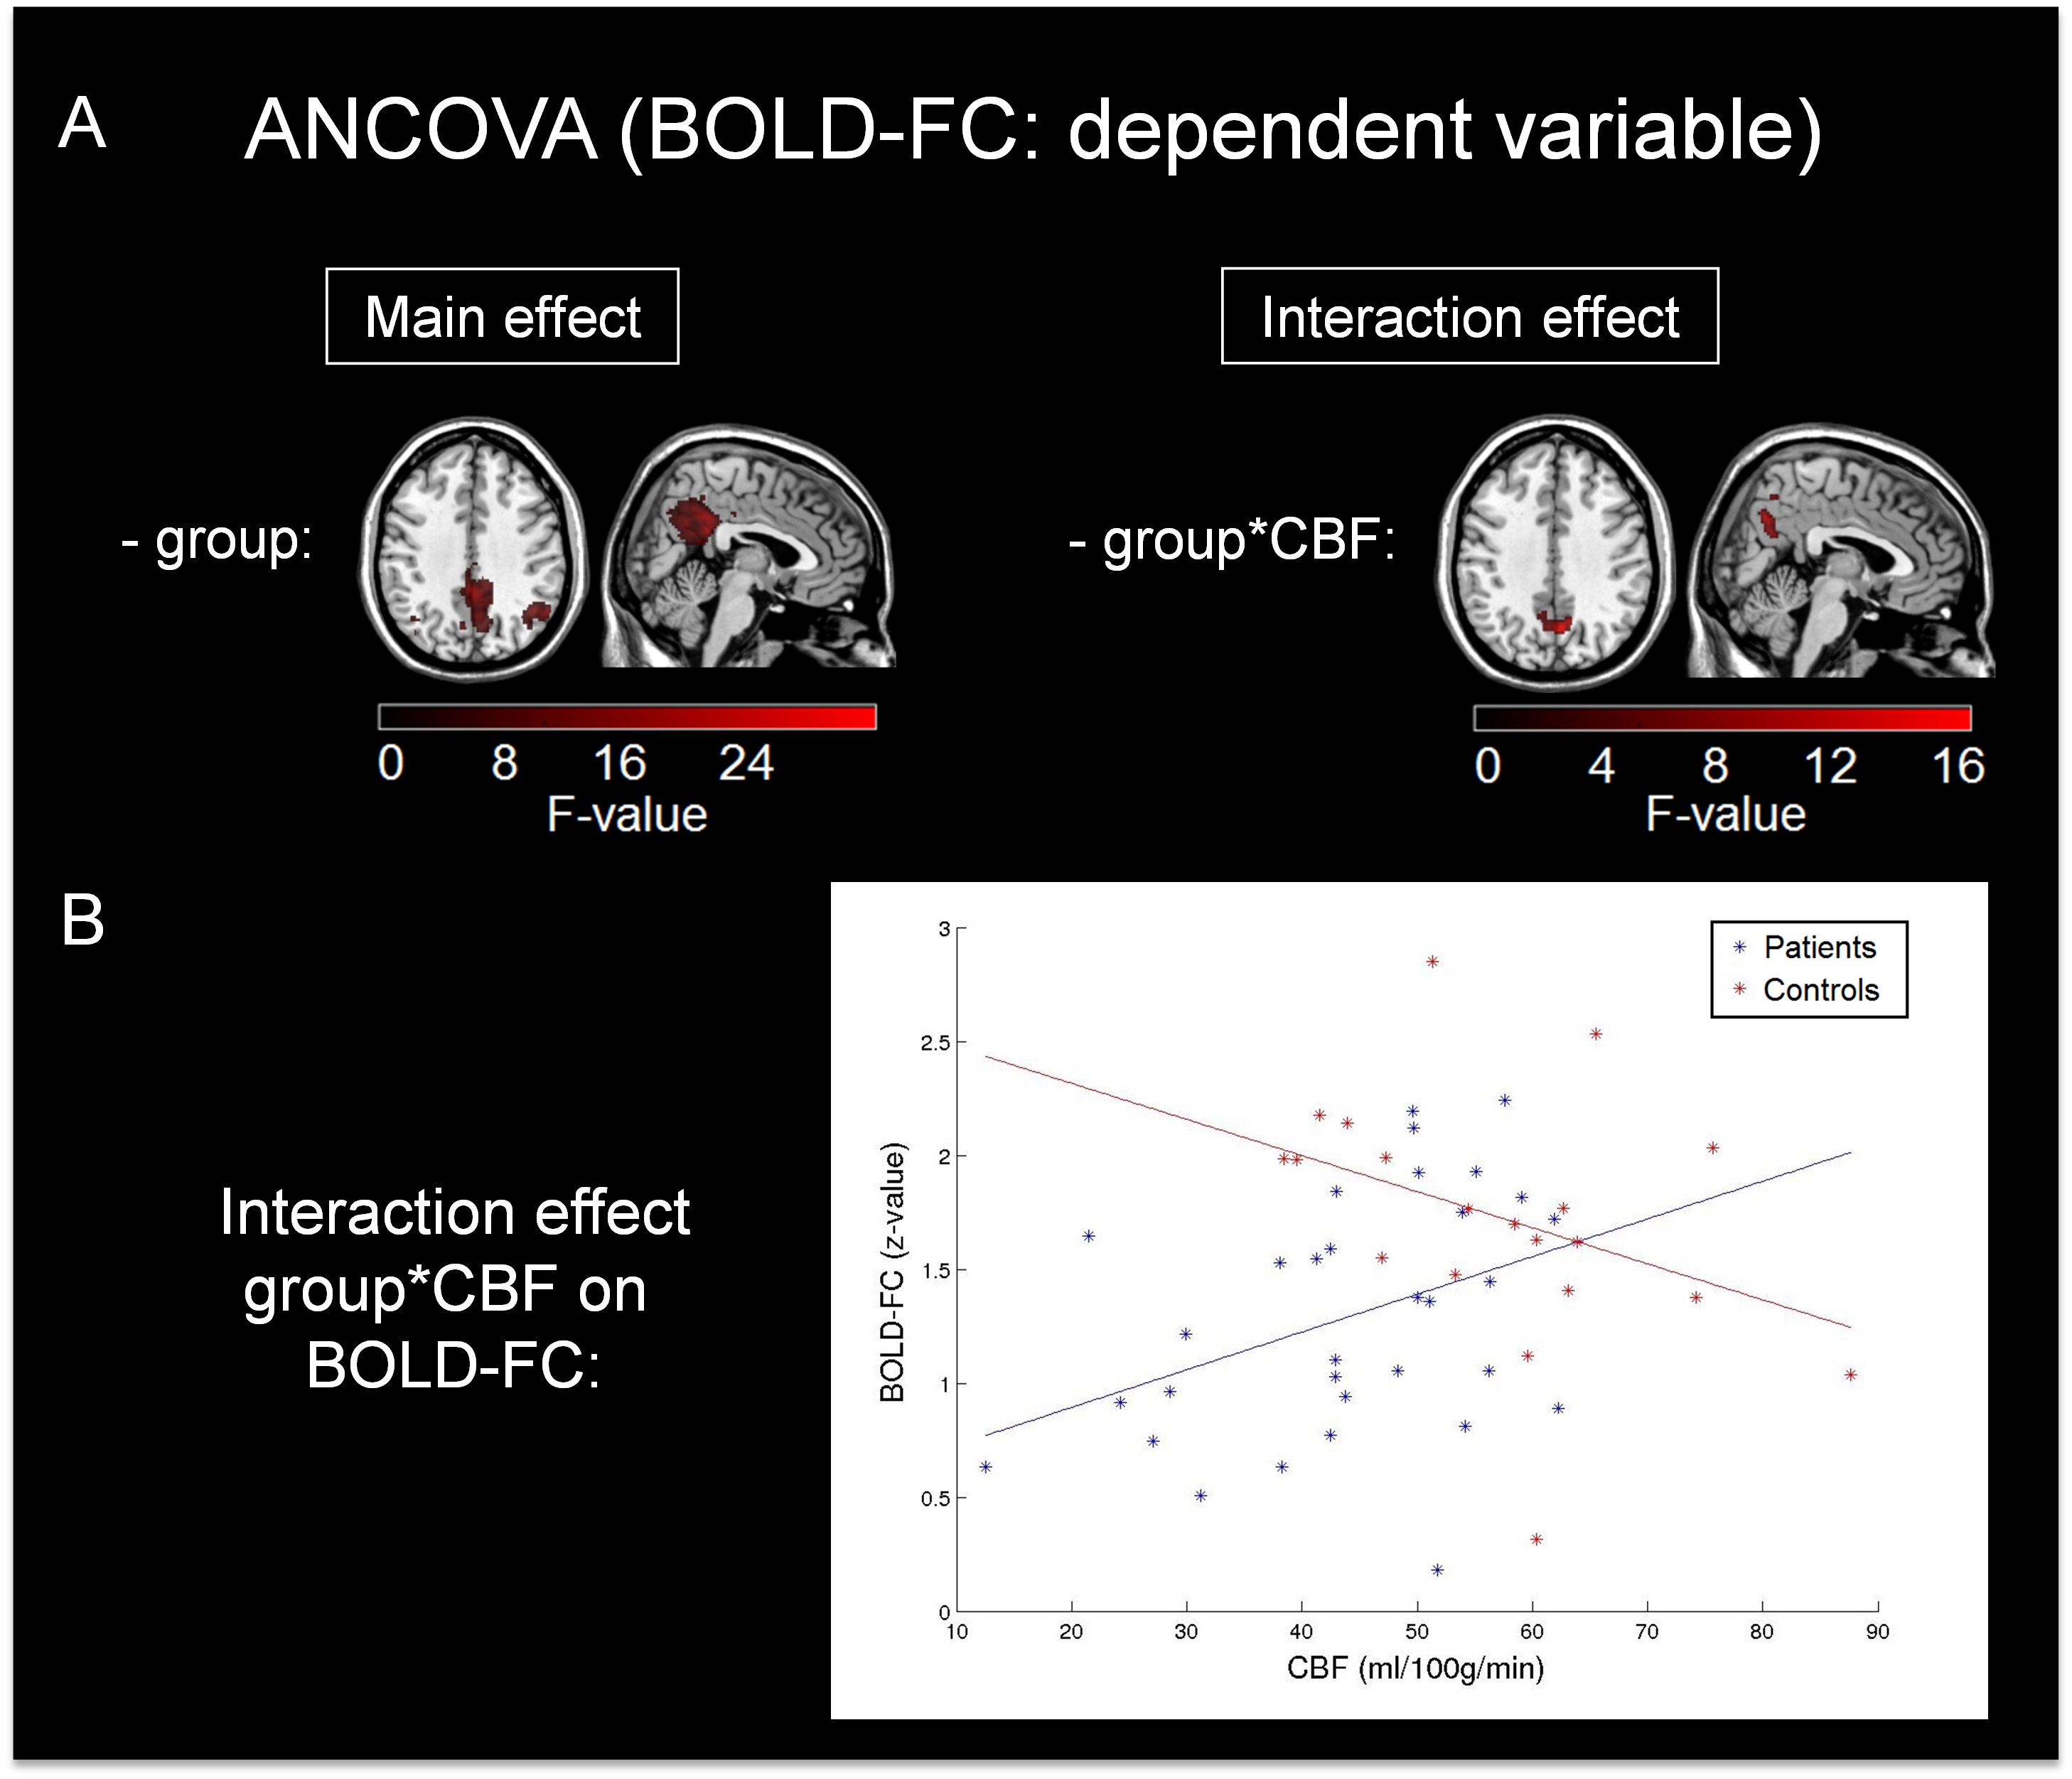
Fig. 2: Specific association of BOLD-FC with mean pDMN’s CBF in precuneus, independently from glucose metabolism in AD.
(A) Significant effects of a voxel-wise ANCOVA of BOLD-FC with the independent variables group, CBF and group*CBF (controlled for relative FDG uptake, age, sex, and atrophy). Significant main effect of group in the whole pDMN and an interaction effect of group*CBF on BOLD-FC in a cluster in the precuneus (k=657, F(1,42)=16.82, p=0.009 FWE-corrected). (B) Scatterplot and regression lines of pDMN’s mean CBF and mean BOLD-FC within the significant cluster of the reported interaction effect (patients (blue): r=0.386; healthy controls (red): r=-0.379).