4118
Detecting Perfusion Deficit in AD and MCI by Resting-State Functional MRI1MR Collaboration NE Asia, Siemens Healthcare, Beijing, People's Republic of China, 2Radiology, Xuanwu Hospital Capital Medical University, Beijing, People's Republic of China
Synopsis
Resting-state fMRI has been widely used to investigate the functional deficits of Alzheimer's disease (AD) and mild cognitive impairment (MCI). In this study, we applied this method to investigate the differences in tissue perfusion deficits between MCI, AD, and normal control (NC) groups. The results show that the AD and MCI groups have areas with less fast perfusion than normal controls. While the MCI group has more perfusion deficits in the frontal lobe, the AD group has more perfusion deficits in the parietal and occipital lobe.
PURPOSE
Resting-state fMRI has been widely used to investigate the functional deficits of Alzheimer's disease (AD) and mild cognitive impairment (MCI). However, the fMRI only shows what lobe of the brain is affected from neuron-functional level, a more detailed mechanism of the disease process and treatment option is still not clear. A new method was proposed in previous studies where timing of tissue perfusion could be obtained from resting-state fMRI (rs-fMRI)[1,2]. In this study, we applied this method to investigate the differences in tissue perfusion between MCI, AD, and normal control (NC) groups to test if perfusion deficits could be detected to improve clinical diagnosis.METHODS
Three groups of subjects were enrolled in this study, including 24 AD, 24 MCI and 24 age-matched NC subjects. MRI exam included routine protocols for screening obvious lesions5 and a resting-state fMRI (rs-fMRI) session. The parameters of rs-fMRI were as follows: TR=2000 ms, TE=30 ms, 33 slices, slice thickness=3.5 mm, distance factor=20%, FOV=210 ×210 mm², matrix= 64×64, measurements=200. All data were collected on a MAGNETOM Trio Tim 3T MR scanner (Siemens, Erlangen, Germany). The fMRI data was pre-processed with a standard pipeline for resting-state data analysis (without regressing out the global signal). The time-shift map could be obtained using the following steps1: 1) Averaging the time series of the whole brain to create the first time series template. 2) Shifting the time course for each voxel from -6TR to +6TR and correlating with the template at each TR. Each voxel was then labeled as the number of TR having the maximum correlation coefficient value. 3) Realigning the time series of all voxels based on their relative blood arrival time determined by step 2. 4) Averaging the realigned whole-brain time series to create a new global template. 5) Repeating steps 2 and 3 until the number of voxels that had changed their blood arrival values between two iterations was less than 100. The results were defined as time-shift map (TSM). The time-shift value of each subject was then converted to z-score for group analysis. The probability density map of z-score for each group was calculated to compare group differences from the histogram. The voxel-based analysis of the normalized time-shift map in 2nd level test was done using SPM8.RESULTS
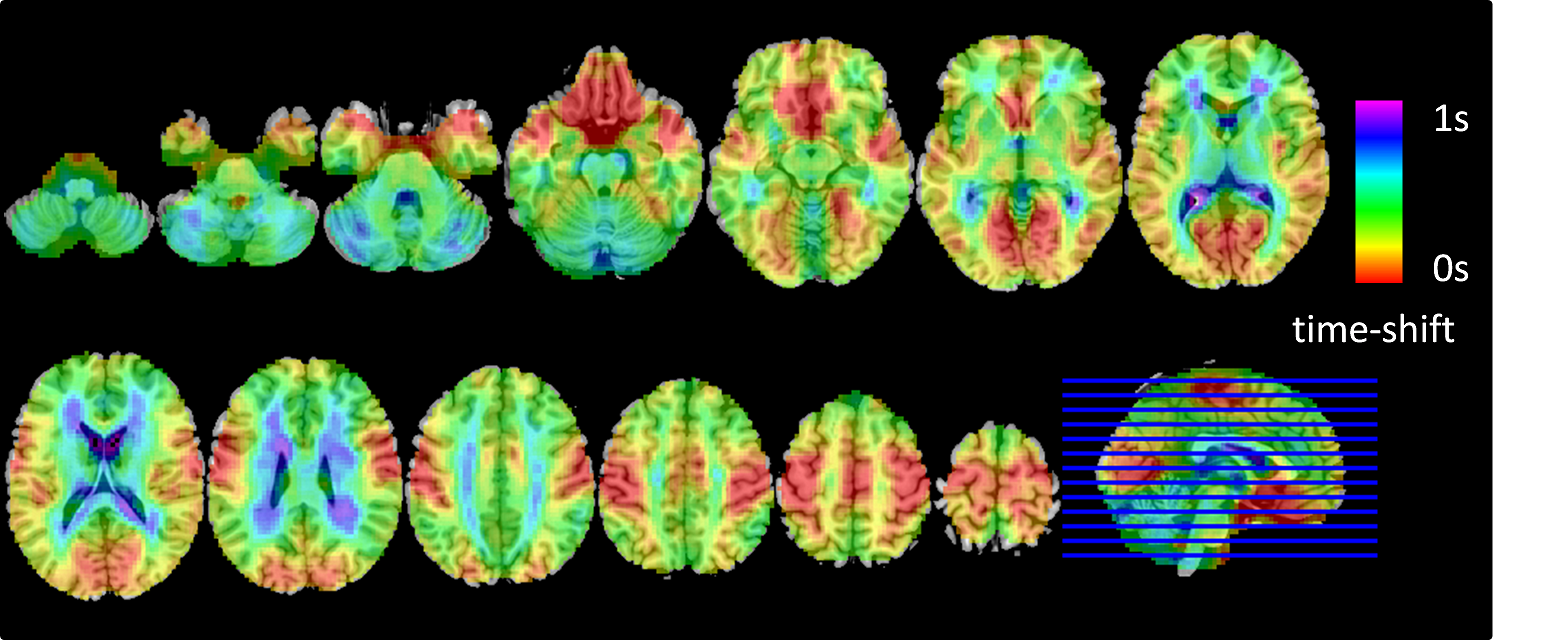
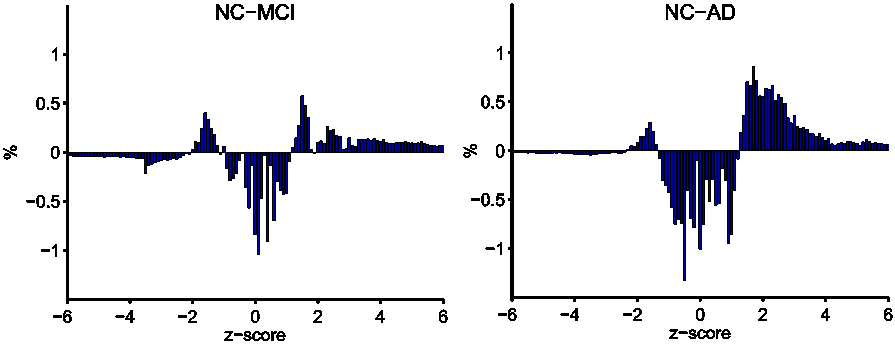
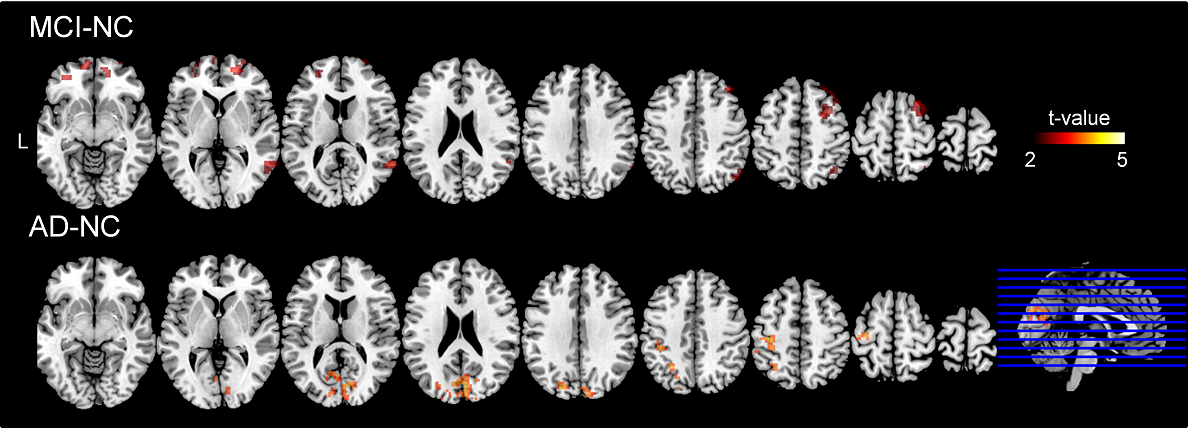
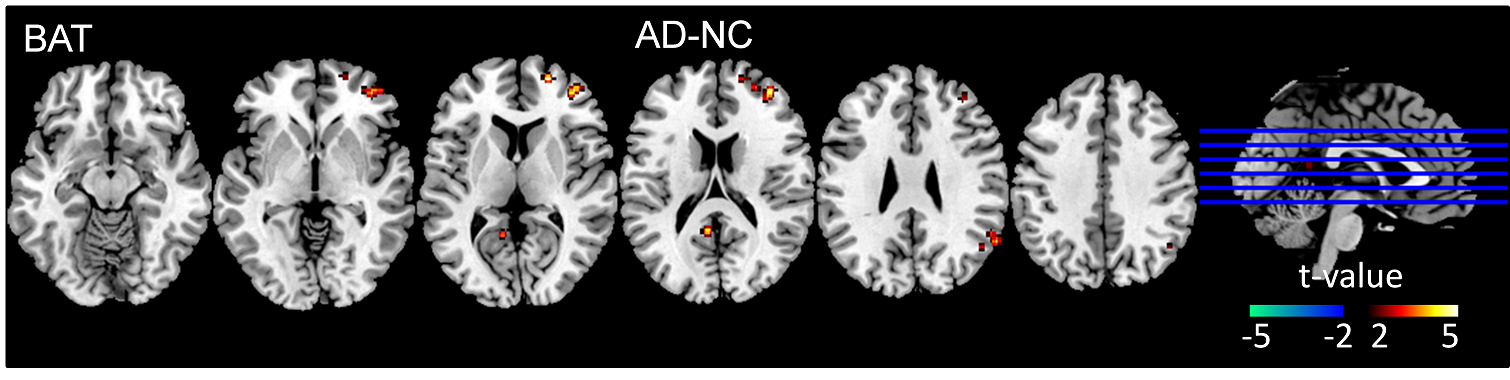
Figure1 shows an averaged time-shift map among the normal control group. The area supplied by the middle cerebral artery (MCA) showed significantly shorter blood arrival time (or artery transit time, ATT) while the cerebellum showed the longest ATT. An increase in ATT was observed in the areas from the frontal horn of the lateral ventricle to the frontal cortex and the areas from the occipital horn of the lateral ventricle to the parietal-occipital cortex. The histogram differences (Fig.2) demonstrated that both the MCI and AD groups had fewer fast-perfusion arrival areas than normal controls, and the number of voxels close to mean time-shift value has grown larger. This indicates that in the MCI and AD groups, the blood arrival time to several areas of the brain are slower than that in the normal control group. There is no negative t-value in the group differences map shown in Fig.3. The positive t-value indicates the blood arrival time in these areas is longer in AD and MCI groups than in normal controls. The delayed blood arrival time for MCI group is mainly located in the orbital gyrus of the bilateral frontal lobe, the right mid-frontal gyrus, the mid-temporal lobe, and the superior parietal lobule. For the AD group, the delayed blood arrival time areas were located in the bilateral calcarine sulcus, the bilateral precuneus and the sensory-motor cortex in the left hemisphere. The differences of TSM between the AD and the NC group are consistent with the bolus arrival time differences (Fig. 4) in our previous report using multi-TI ASL method [3].DISCUSSION
Besides functional connectivity, the low-frequency fluctuation also contained perfusion information due to the mechanism of Blood Oxygen Level Dependent (BOLD) signal acquisition. A delay of blood supply due to abnormal brain-vascular condition in some areas may also lead to a decrease in functional connectivity, characteristic of the disease process. If the functional deficit or brain degeneration is due to a perfusion deficit, therapeutic methods for brain-vascular diseases might be suitable for MCI or AD treatment[4]CONCLUSION
The time-shift maps obtained from rs-fMRI are consistent with the cerebral blood supply atlas. This method could detect the perfusion deficits in AD and MCI non-invasively. The perfusion deficits detected by rs-fMRI may provide new evidence for understanding the mechanism of neuro-degeneration.Acknowledgements
No acknowledgement found.References
1. Tianyi Qian, Zhiwei Zuo, Yituo Wang, et.al,. A Non-Invasive Method for Measuring Perfusion in Moyamoya disease with Functional Magnetic Resonance Imaging. ISMRM2015
2. Lv Y, Margulies D S, Cameron Craddock R, et al. Identifying the perfusion deficit in acute stroke with resting-state functional magnetic resonance imaging[J]. Annals of neurology, 2013, 73(1): 136-140.
3. Shuang Yang, Tianyi Qian, Bin Zhao, et, al.. Voxel-based analysis of cerebral perfusion in subcortical ischemic vascular dementia and Alzheimer’s disease dementia: a multi-parametric multi-TI rterial-spin-labeling study ISMRM2016
4. Román G C. Vascular dementia: distinguishing characteristics, treatment, and prevention[J]. Journal of the American Geriatrics Society, 2003, 51(5s2): S296-S304.
Figures