4113
Imaging Genomics of Young Children with Global Developmental Delay: Preliminary DTI connectome study correlated with Allen brain atlas gene expression level1Pediatrics and Neurology, Wayne State University, Detroit, MI, United States, 2Translational Imaging Lab, Children's Hospital of Michigan, Detroit, MI, United States, 3Neurology, Nemours DuPont Hospital for Children, Wilmington, DE, United States
Synopsis
This study is to investigate if
different types of genetic mutations observed in children with global
developmental delay (GD) are associated with white matter dysmorphologies and
neuropsychological assessments. Eight children with GD having different mutations
underwent a 3T MRI including diffusion tensor imaging with topological whole
brain connectome analysis. Four of eight GD-associated mutations having high
gene expression level in frontal and hippocampal regions showed apparently
increased connectivity strengths in frontal and hippocampal regions which were
significantly correlated with three behavioral phenotypes (IQ, memory, communication)
suggesting that white matter abnormalities in different regions are perhaps
driven by different genetic mutations.
Purpose
To study if different types of genetic mutations observed in children with global developmental delay (GD) are associated with white matter dysmorphologies and neuropsychological assessments in frontal, hippocampal and cerebellar regions.Methods
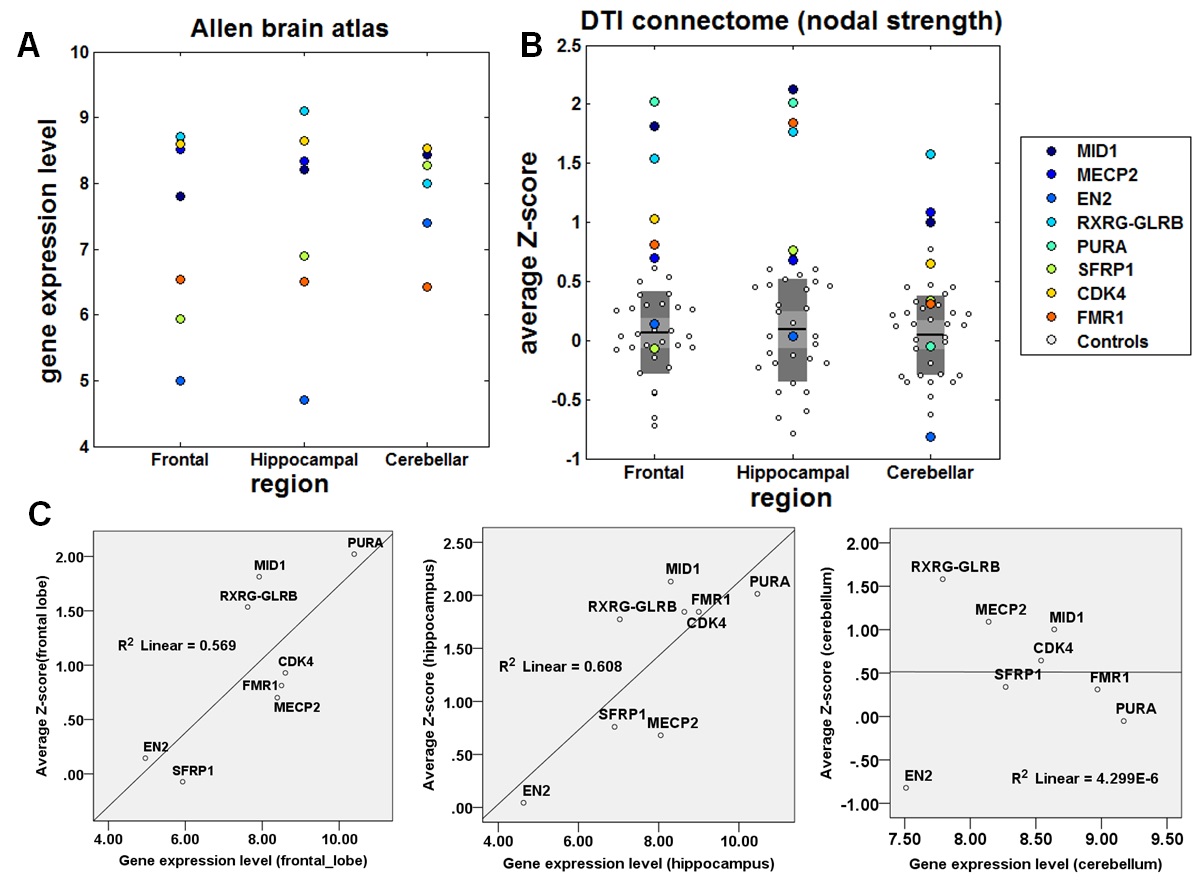
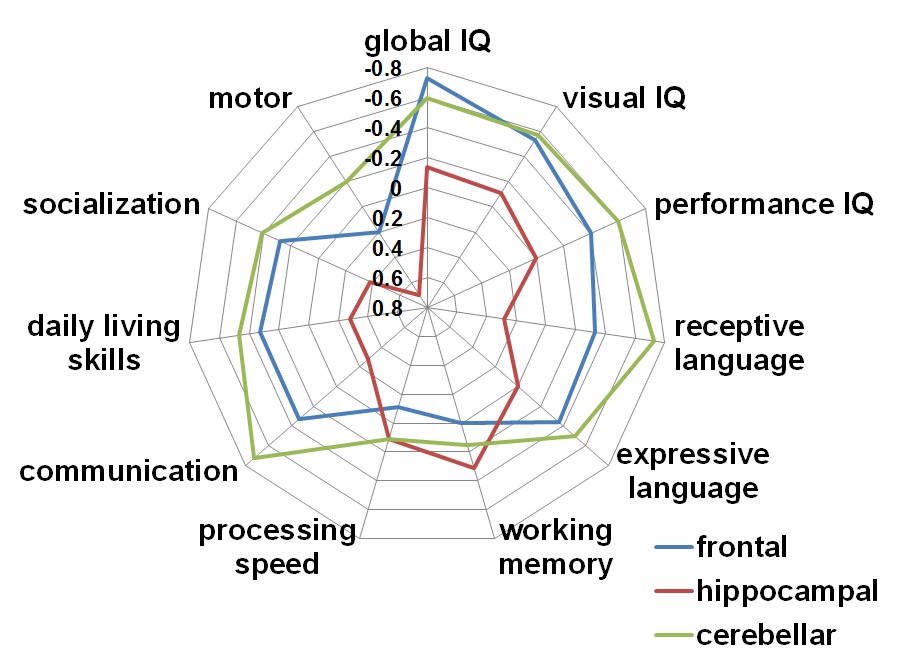
Eight children with GD (age: 8.6±6.6 years) having eight mutations in MID1, MECP2, EN2, RXRGGLRB, PURA, SFRP1, CDK4 and FMR1 and thirty two healthy children (age: 9.2±6.8 years) underwent a 3T MRI at TR = 12,500ms, TE = 88.7ms, FOV = 24cm, 128×128 acquisition matrix, contiguous 3mm thickness in order to cover entire axial slices of whole brain using 55 isotropic gradient directions with b= 1000s/mm2, one b=0 acquisition, and number of excitations=1. For each subject, whole brain tractography using independent component analysis with ball and stick model (ICA+BSM)1 was performed to isolate up to 3 fiber bundles crossing at every voxel. Using SPM DARTEL procedure2, pediatric age-specific T1 templates were created from T1 images of healthy children. An automated anatomical labeling atlas (AAL, http://www.gin.cnrs.fr/spip.php) template was spatially normalized to the pediatric T1 templates using linear normalization, diffeomorphic normalization and iterative averaging3. SPM DARTEL approach was again used to obtain an optimal nonlinear deformation to warp the age-matched AAL template to the T1 image. The warped template was co-registered to b0 image in order to sort whole brain tractography connecting every pair of total 116 nodes, resulting in a 116×116 connectivity matrices in which the elements quantify the pair-wise connectivity scores (i.e., the number of fibers scaled by both fiber length and volume of the nodes to stabilize inter-subject variability of the network metrics4). Brain Connectivity Toolbox (BCT, https://sites.google.com/site/bctnet) was utilized to assess the strength of inter-nodal connections (the number of the shortest paths) at individual nodes. To identify representative patterns of regional white matter abnormality existing in whole brain network of GD children, Z-scores of nodal strengths were evaluated to localize the degrees of white matter abnormality at individual nodes, Z(n)=(x(n)-m(n))/std(n) where n and x represent node index and nodal strength of a patient, respectively. ‘m’ and ‘std’ are mean and standard deviation of healthy children. Finally, to investigate the presence of association in anatomical versus gene phenotype and anatomical vs. functional phenotype, average Z-scores of nodal strengths in three functional networks: 1) bilateral frontal network (superior/middle/inferior/superior medial/superior orbital/mid orbital/inferior orbital frontal gyrus), 2) bilateral hippocampal network (hippocampus, caudate, putamen, pallidum and parahippocampal gyrus) and 3) cerebellar network (crus 1,2/cerebellum 3-10/vermis 1-10) were obtained and then correlated using Pearson’s analysis with regional gene expression levels of Allen bran atlas (http://human.brain-map.org/) and specific neuropsychological assessments including global IQ, language/communication skill, and working memory.Results
Compared with healthy children, 4 of 8 GD-associated mutations having high gene expression level in frontal and hippocampal regions including MID1, RXRG-GLRB, PURA and CDK showed apparently increased strengths in frontal and hippocampal regions (Figure 1 A and B). Such increases were significantly correlated with regional gene expression level in frontal region (R2=0.43, p=0.05) and hippocampus (R2=0.62, p=0.02) (Figure 1 C). Greater frontal, hippocampal and cerebellar abnormalities were associated with a lower global IQ (R2=0.75, p=0.01), lower auditory working memory (R2=0.43, p=0.05) and poorer communication skills (R2=0.46, p=0.04), respectively (Figure 2).Discussion
The present study provided preliminary evidence that specific mutations associated with GD may affect the development of white matter in three different regions: frontal lobe, hippocampus, and cerebellum. Four mutations including MD1, RXRG-GLRB, PURA and CDK had high gene expression level and apparent increase of nodal connectivity in both frontal and hippocampal regions. Similarly, three mutations (RXRG-GLRB, MECP2, MID1) showed both high gene expression level and increased strength in cerebellum, suggesting that the enhanced synaptogenesis and white matter volume in frontal and hippocampal regions may be associated with specific types of gene mutations in children with GD. Also, such increases of nodal strengths in frontal lobe, hippocampus and cerebellum were significantly associated with functional impairments in global IQ, working memory and communication, respectively, underlying that DTI connectome analysis may aid in understanding the biology of functional impairment in GD in-vivo. Refining the genotype-phenotype relationship of GD in such unprecedented and detailed manner (including brain connectivity, neurocognitive profile, exome sequencing) performed in this study is highly significant as it may greatly improve our understanding of the genetic and neuroanatomic mechanisms of GD children5.Conclusion
The findings of the present study provide preliminary evidence to suggest that white matter abnormalities in different regions are perhaps driven by different genetic mutations which, when mutated, may result in different types of neurocognitive phenotypes in developmental delay.Acknowledgements
This study was funded by a grant from National Institute of Neurological Disorders and Stroke (R01-NS089659 to J.J). All authors would like to thank all participants and their families for their time and interest in this study. The authors declare no conflicts of interest.References
1.Jeong JW, Asano E, Yeh FC, Chugani DC, Chugani HT. Independent component analysis tractography combined with a ball-stick model to isolate intravoxel crossing fibers of the corticospinal tracts in clinical diffusion MRI. Magn Reson Med 2013;70(2):441-53.
2.Ashburner J. A fast diffeomorphic image registration algorithm. Neuroimage. 2007;38:95-113.
3. Akiyama LF, Richards TR, Imada T, Dager SR, Wroblewski L, Kuhl PK. Age-specific average head template for typically developing 6-month old infants. PLOS one. 2013;8:e73821.
4.Cheng H. Wang Y, Sheng J, Kronenberger WG, Mathews VP. Characteristics and variability of structural networks derived from diffusion tensor imaging. Neuroimage. 2012;61:1153-64.
5.Shevell M, Ashwal S, Donley D, et al. Practice parameter: evaluation of the child with global developmental delay: report of the Quality Standards Subcommittee of the American Academy of Neurology and The Practice Committee of the Child Neurology Society. Neurology 2003;60(3):367-80.
Figures