4111
Diffusion-Weighted MR Signal Sparsity Indicates Impaired White Matter Organization in Lissencephaly1University of California, Los Angeles, Los Angeles, CA, United States
Synopsis
We demonstrate a novel technique for studying white matter pathology by examining the statistical properties of the DWI signal. We apply a sparse coding method, K-SVD, to decompose a diffusion-weighted series. We then quantify the efficiency of the resulting encoding by computing the Gini coefficient. We show that this measure is abnormally decreased in a cohort of lissencephaly patients compared to age-matched control subjects. Our results support the hypotheses that more organized white matter can be more sparsely encoded and that the sparsity of the encoding may thus be used to infer pathological white matter states.
Purpose
Investigation of white matter architecture with diffusion-weighted MRI has generally relied on the examination of anisotropy measures within specific brain regions or the analysis of connectivity measures derived from fiber tracking. Recently, however, aggregate statistical properties of the diffusion-weighted MR signal itself have been demonstrated to have biological relevance. Specifically, the efficiency with which a diffusion-weighted MR data set can be sparsely encoded using a learned dictionary appears to be inversely correlated with the complexity of the white matter microstructure. Though this relationship has been demonstrated in normal brain maturation and development, the utility of such a metric in pathological states remains to be established. Here, we apply this technique in a cohort of patients with lissencephaly to provide the first assessment of how the sparsity of the DWI signal may identify pathologies in a diffusion model-independent manner.Methods
We queried our institutional database for all brain MR studies performed over the 60-month period ending in October 2016 that included multidirectional diffusion-weighted imaging. Only studies performed on individuals younger than 21 years of age and reported as either normal or lissencephaly were evaluated. For each lissencephaly case, the two closest age-matched controls were included for further comparison. Diffusion-weighted images were acquired at 1.5 T with b = 1200 s/mm2 over 30 gradient directions. Images were corrected for head motion and eddy current effects, and fractional anisotropy maps were computed1 and thresholded (FA > 0.2) to produce a white matter mask.
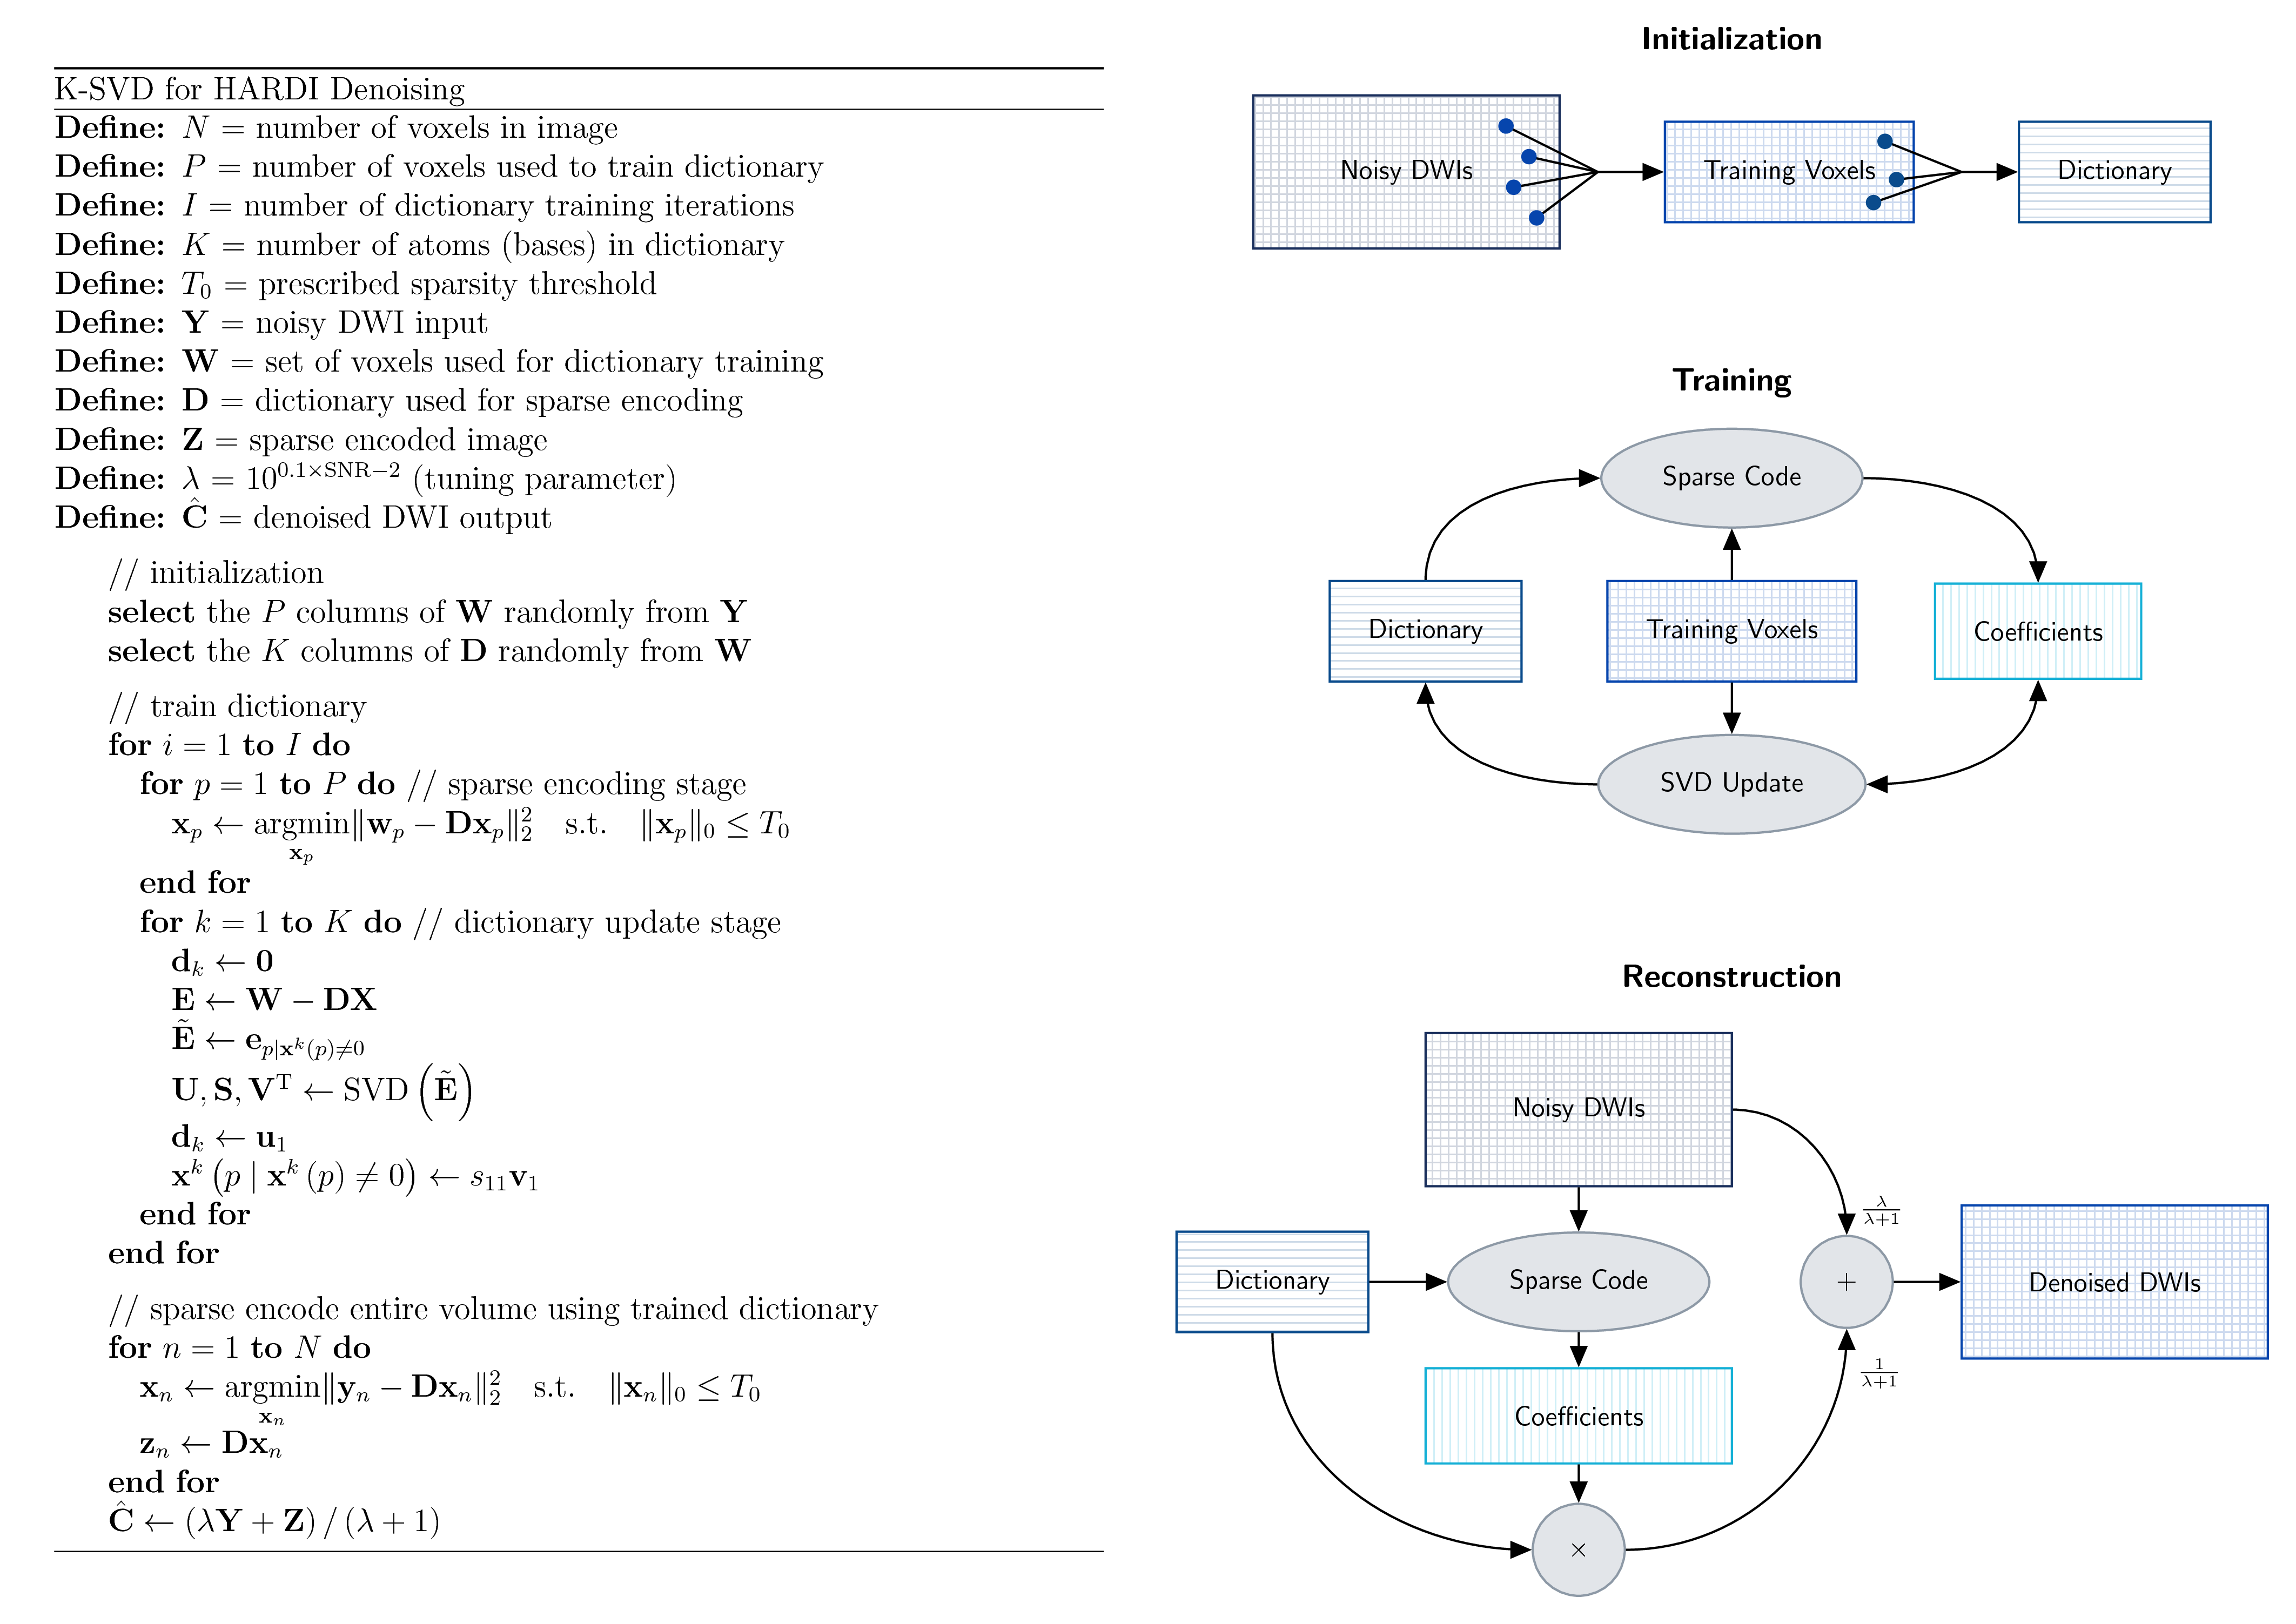
Each diffusion-weighted series was decomposed using K-SVD2, a coding method which simultaneously seeks both an optimal dictionary $$$\mathbf{D}$$$ and sparse coefficients $$$\mathbf{X}$$$ that approximate the observed data $$$\mathbf{Y}$$$ subject to a sparsity constraint $$$T_0$$$ on each coefficient vector $$$\mathbf{x}_p$$$:
$$\DeclareMathOperator{\argmin}{argmin} \underset{\mathbf{D},\mathbf{X}}{\argmin} \lVert\mathbf{Y} - \mathbf{DX}\rVert^2_\mathrm{F} \quad \text{s.t.} \quad \forall p,\, \lVert\mathbf{x}_p\rVert_0 \leq T_0$$
We summarize the K-SVD algorithm, initially proposed for DWI denoising, in Figure 1 and refer the reader to previous descriptions3,4 for implementation details. As in prior works utilizing K-SVD for DWI encoding, a fixed dictionary size ($$$K=200$$$) and sparsity threshold ($$$T_0=10$$$) were used throughout this study.
The sparsity of the encoding was quantified by computing the Gini coefficient5, previously validated in this context6, for each coding vector:
$$\textrm{Gini Coefficient}\left(\mathbf{x}\right)=1-2\sum^{K}_{k=1}\frac{\mathbf{x}\left[k\right]}{\lVert \mathbf{x} \rVert_1} \left( \frac{K-k+\frac{1}{2}}{K} \right)$$
The Gini coefficient takes values over the interval $$$\left[0, 1\right]$$$, with unity representing a maximally sparse coding vector containing a single nonzero element. This sparsity measure has several important advantages7 over the $$$\ell^0$$$ and $$$\ell^1$$$ norms, including invariance to constant offset and scaling, and has previously been shown to increase monotonically thoughout normal pediatric white matter maturation6.
For each subject, the mean Gini coefficient was calculated across the entire segmented white matter, and the distribution of these means was compared between the lissencephaly and control sample populations using a two-sample t-test.
Results
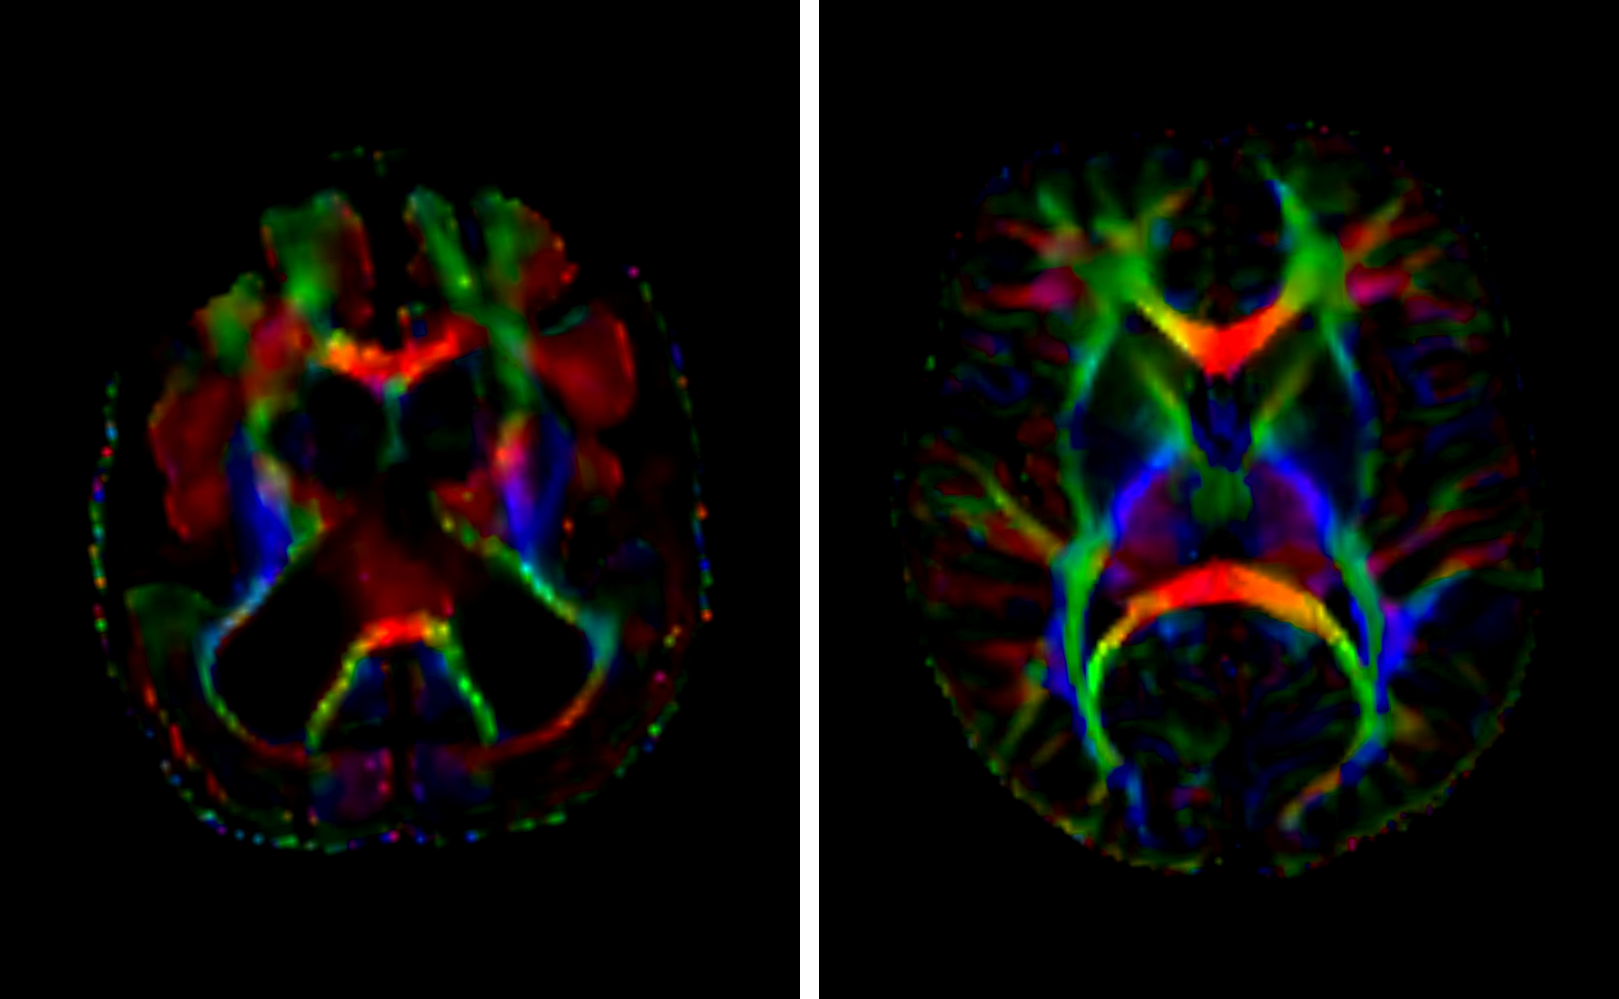
Within the examinations satisfying the inclusion criteria, we identified 7 lissencephaly cases and selected 14 age-matched controls. To illustrate the severe white matter derangement in lissencephaly, representative directionally-encoded color maps from a lissencephaly case and age-matched control are depicted in Figure 2. Basic demographic data for the groups were compiled and, as tabulated in Figure 3, there were determined to be no statistically significant differences between the sample populations. The mean of the global white matter Gini coefficients across the lissencephaly cases was 0.96343, which was less than the value computed for the control group, 0.96549, by a statistically significant margin (p = 0.042).Discussion
The results reveal that the sparsity of the DWI signal encoding is decreased in lissencephaly compared to healthy age-matched controls. This finding is in keeping with previous work that has demonstrated an increase in the Gini coefficient throughout the course of pediatric brain development6. Intuitively, this finding implies that maturation (i.e., organization and myelination) of white matter permits a more compact and efficient representation of the DWI signal using a constrained basis. Conversely, immature or disorganized white matter, as found in lissencephaly, results in more complex DWI signal profiles that are not as easily represented as sparse linear combinations of a limited set of basis vectors.Conclusion
We have shown for the first time that the sparsity of the diffusion-weighted MR signal, quantified as the Gini coefficient derived from a K-SVD encoding, can be used directly to identify pathological white matter conditions such as lissencephaly. This technique provides a means for quickly identifying potential disease states without requiring the manual investigation of particular brain regions and avoids the biases and assumptions inherent in diffusion model fitting and tractography.
Acknowledgements
No acknowledgement found.References
1. Basser PJ, Pierpaoli C. Microstructural and physiological features of tissues elucidated by quantitative-diffusion-tensor MRI. Journal of Magnetic Resonance B. 1996;111(3):209–19.
2. Elad M, Aharon M. Image denoising via sparse and redundant representations over learned dictionaries. IEEE Transactions on Image Processing. 2006;15(12):3736–45.
3. Rubinstein R, Zibulevsky M, Elad M. Effcient implementation of the K-SVD algorithm using batch orthogonal matching pursuit. Technical Report. CS Technion. 2008.
4. Patel V, Shi Y, Thompson PM, Toga AW. K-SVD for HARDI denoising. IEEE International Symposium on Biomedical Imaging. 2011:1805–08.
5. Dixon PM, Weiner J, Mitchell-Olds T, Woodley R. Bootstrapping the Gini coeffcient of inequality. Ecology. 1987;68:1548–51.
6. Patel V, Fitzgibbons M, Thompson PM, Toga AW, Salamon N. Examining global white matter development via the sparse coding properties of diffusion-weighted MRI. International Society for Magnetic Resonance in Medicine. 2016.
7. Hurley N, Rickard S. Comparing measures of sparsity. IEEE Transactions on Information Theory. 2009;55(10):4723–41.
Figures