4098
Assessment of subcortical white matter myelination progression based on T2WI visual evaluation during the age of 6-48 months: a DTI-based validation study1Department of Diagnostic Radiology, the First Affiliated Hospital of Xi’an Jiaotong University, Xi'an,China, People's Republic of China, 2Department of Diagnostic Radiology, the First Affiliated Hospital of Xi’an Jiaotong University, Xi’an 710061, P.R. China, 3Department of Diagnostic Radiology, the First Affiliated Hospital of Xi’an Jiaotong University, Xi’an 710061, P.R. China, People's Republic of China
Synopsis
Assessment of WM myelination is important to diagnose WM disorders in infants and children. We retrospectively evaluated 109 subjects (age of 6-48 months) using modified Cecilia Parazzini’s scoring method based on T2WI visual evaluation. A significantly positive correlation was found between age and total scores of WM myelination with non-linear correlation coefficient of 0.948 (p<0.01). TBSS results demonstrated WM myelination progressed rapidly during age of 6-20 months and relatively stable during age of 21-48 months. The modified scoring method was more applicable to assess the WM myelination in infant with age of 6-20 months.
Introduction
Myelination proceeds predominantly until age of 3-4 years1. So assessment of white matter (WM) myelination is important to diagnose WM disorders in infants and children. In general, changes of WM myelination are observed best on T2-weighted image (T2WI) during age of 6-18 months2, 3. However, Cecilia Parazzini’s study respectively assessed subcortical WM myelination of each brain lobe at age of 20-40months on T2WI4. Our previous study used Cecilia Parazzini’s method and summed the score of each brain lobe to assess the subcortical WM myelination during age of 6-48months, and a positive correlation between age and the total scores of WM myelination was found5. We believe this scoring method could be used to evaluate WM myelination in infants and children. The purpose of this study was to evaluate WM myelination and validate whether the method is reliable and applicable in infants and children during age of 6-48 months through the tract-based spatial statistics (TBSS) for Diffusion Tensor Imaging (DTI).
Method
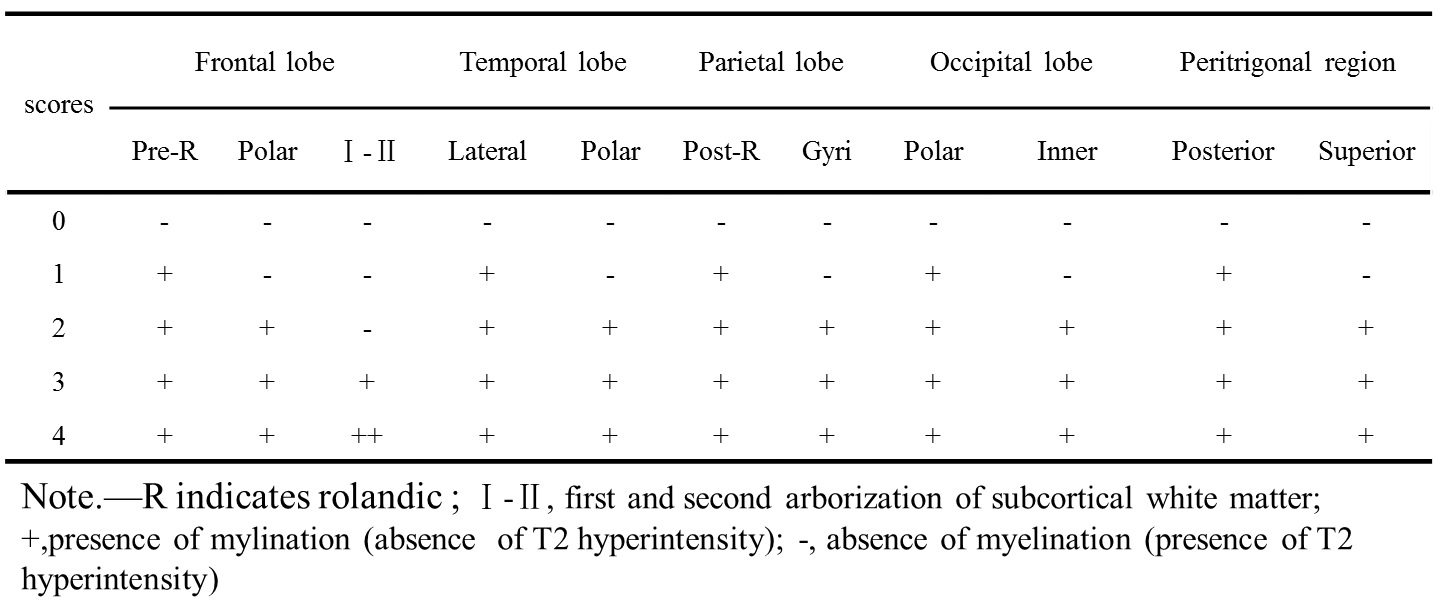
This study was approved by the local Internal Review Board and all parents of participants had signed the informed consents before MRI scanning. Patients 109 subjects with age of MR scanning during 6-48 months (62 boys, 47 girls) were retrospectively evaluated and all born at full term without abnormalities in brain MR images. MR Protocols Images were acquired using GE 3.0T scanner (Signa HDxt) with 8-channel head coil. The protocols included sequences: (1) 2D T2-weighted sequence (TR/TE, 4200ms/120ms; matrix, 256×256; section-thickness, 4mm; FOV, 240mm); (2) DTI (30 directions; b-value, 600 s/mm2; TR/TE, 11000ms/69.5ms; section-thickness, 2.5mm; FOV, 240mm; matrix, 256×256). Data and statistical analysis In this study, two pediatric neuroradiologists, blinded to the age of any subject, assessed the WM myelination on T2WIs according to our modified Cecilia Parazzini’s scoring method (Table 1). Then the total scores representing the maturity of cerebral WM myelination were acquired by summing the WM score of each brain lobe. The correlation analysis between age of the month and the total scores of myelination were statistically analyzed by GraphPad Prism5. The inter-observer and intra-observer agreement were evaluated by using Bland-Altman analysis. The locally scatterplot smoothing model (LOESS) was used to detail the relationship between age and total scores of cerebral WM myelination and to find the inflection point of WM myelination progression. DTI data was processed with the aid of the FMRIB software library (FSL, www.fmrib.ox.au.uk/fsl). Group-average target was chose through the target choice procedure. The tract-based spatial statistics (TBSS) was used to investigate the relationship between total myelination scores and FA values in cerebral WM, age of the month and FA values in cerebral WM.Results
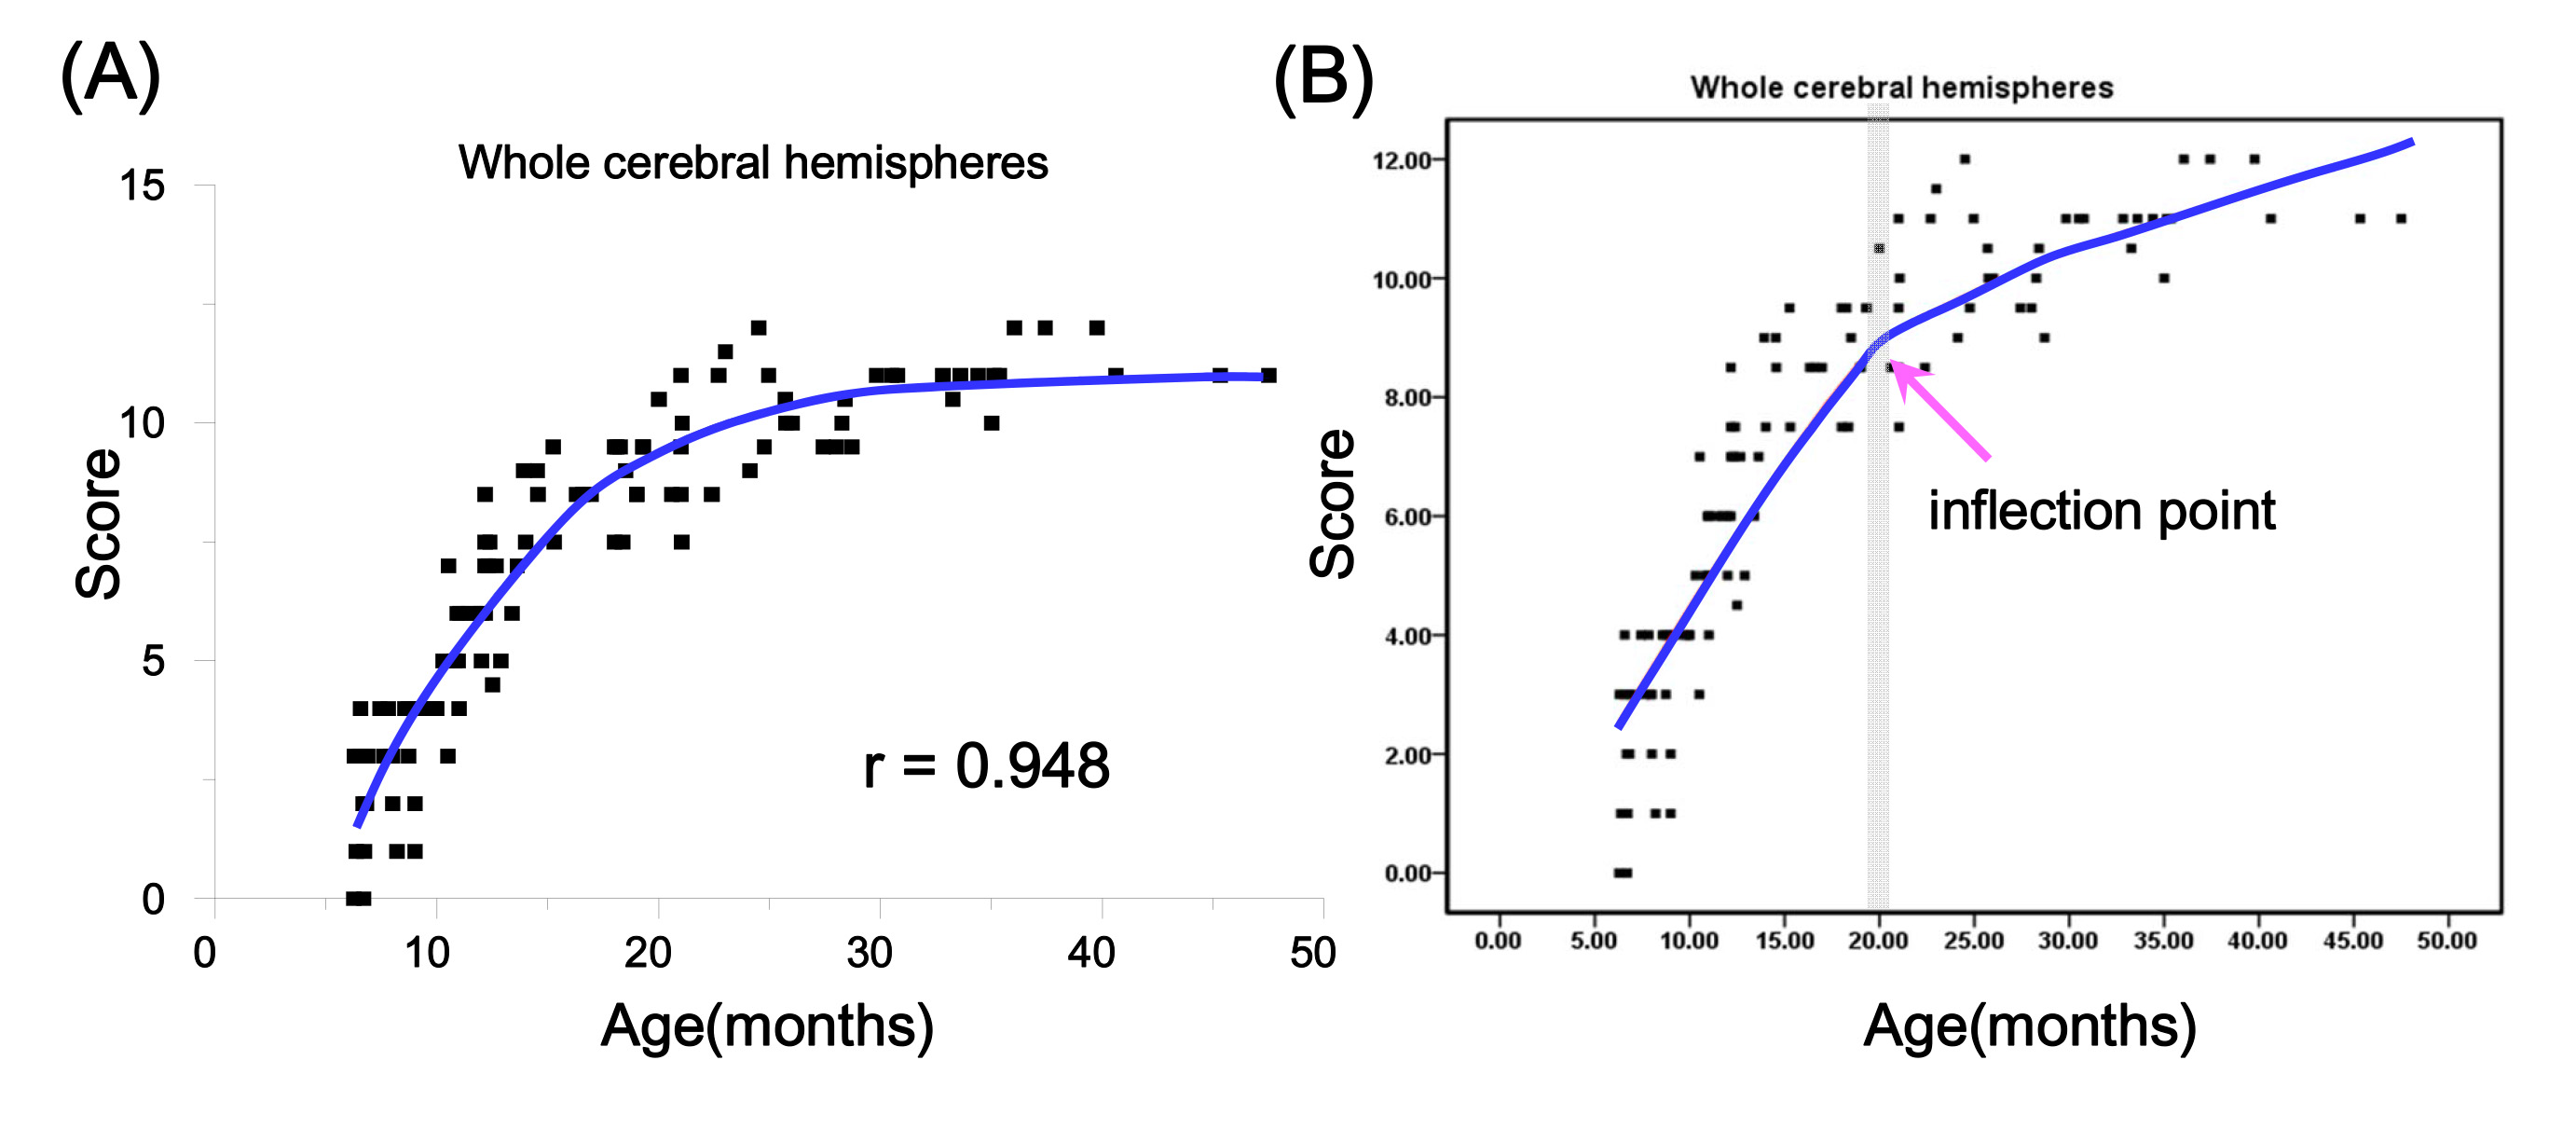
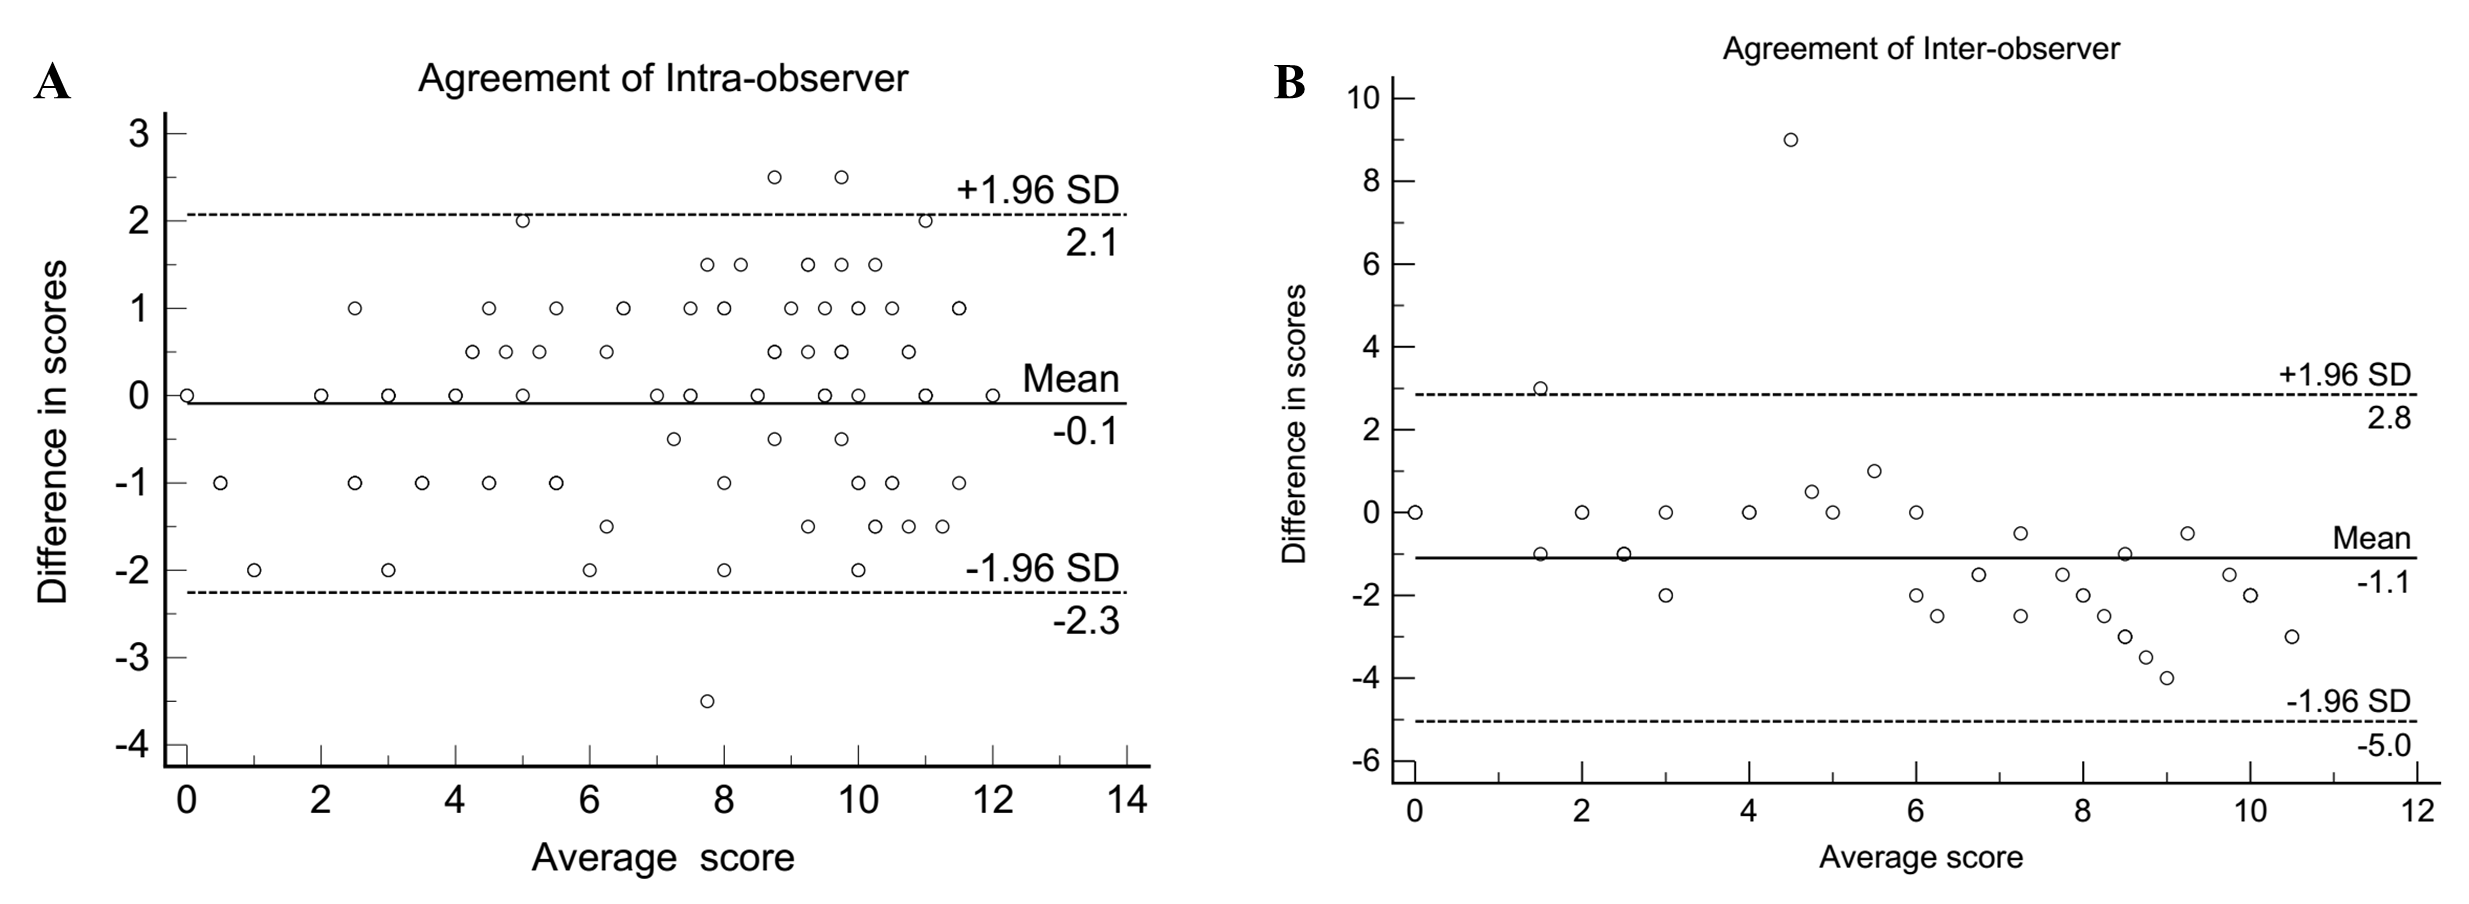
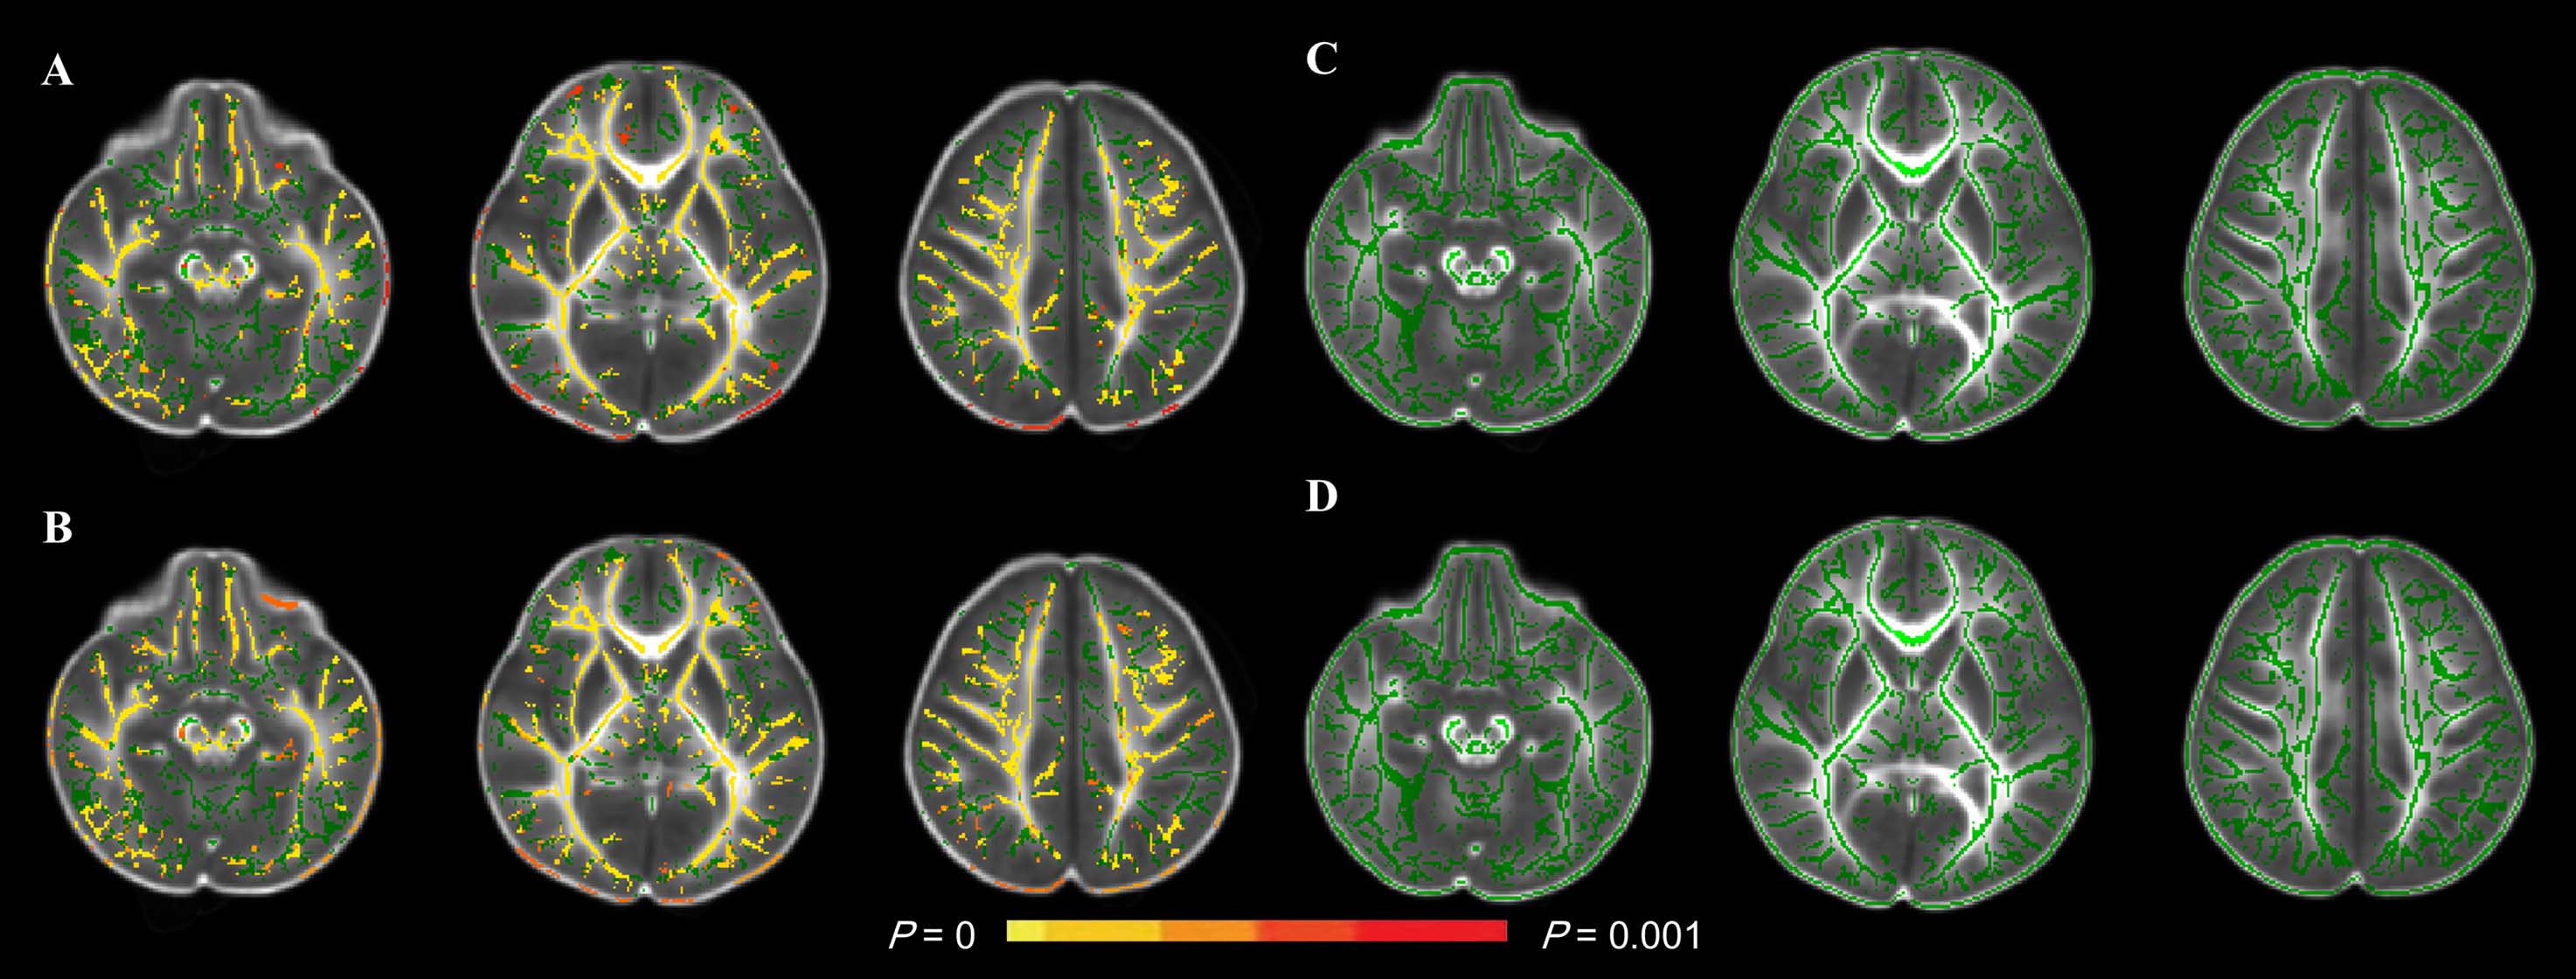
In this study, the positive correlation with non-linear coefficient of 0.948(p<0.001) was found between age of the month and the total scores of WM myelination based on T2WI visual evaluation (Figure 1A). The inter-observer and intra-observer agreement were both good proved by Bland-Altman statistical analysis (Figure 2). After the LOESS analysis, the status of cerebral WM myelination during age of 6-48 months was divided into two phase based on an inflection point at age of 20 months (Figure 1B). Linear coefficient was 0.902(P<0.001) and 0.551 (P<0.001) between the total scores and age during 6-20 months and 21-48months respectively. The TBSS analysis shown the positive correlation between FA values and total scores of WM myelination (p<0.001), between FA values and age (p<0.001) during age of 6-20minths. However, there was no significant correlation neither FA values between and total scores of WM myelination or between age and FA values during age of 21-48months (Figure 3).Discussion
This study indicates that WM myelination progressed rapidly during age of 6-20 months and relatively stable during age of 21-48 months. Coefficient of the first phase was significantly higher than the second phase. WM including fine-arborization of subcortical WM myelinated during age of 6-18 months2, 3, that was consistent with the first phase myelinating rapidly. Previous study showed FA values of WM were relatively stable after age of 24 months6-7, which was consistent with our study. In this study, WM skeleton analysis by TBSS showed FA values of WM skeleton was correlated with scores of subcortical WM myelination during age of 6-20 months and wasn’t correlated during age of 21-48 months. It may suggest development of subcortical WM and WM skeleton was simultaneous during age of 6-20 months, while it was not simultaneous during age of 21-48 months.Conclusion
The modified Cecilia Parazzini’s scoring method based on T2WI visual evaluation is more applicable to assess cerebral WM myelination progression of infant with age of 6-20 months in clinic.Acknowledgements
This work was supported by the National Key Research and Development Program of China (2016YFC0100300), National Natural Science Foundation of China (No.81171317, 81471631), and the 2011 New Century Excellent Talent Support Plan of the Ministry of Education, China (NCET-11-0438).References
1.Deoni SC, Mercure E, Blasi A, et al. Mapping infant brain myelination with magneticresonance imaging. J Neurosci, 2011. 31(2):784–91.
2.Barkovich A.J. Magnetic resonance techniques in the assessment of myelin and myelination. Journal of inherited metabolic disease, 2005. 28(3): 311-343.
3. Barkovich A.J, Kjos B.O, Jackson Jr, et al. Normal maturation of the neonatal and infant brain: MR imaging at 1.5 T. Radiology, 1988. 166: 173-180.
4. Cecilia Parazzini, Cristina Baldoli, Giuseppe Scotti, and Fabio Triulzi. Terminal zones of myelination: MR evaluation of children aged 20-40 months. AJNR Am J Neuroradiol, 2002. 23(10): 1669-73.
5. Jian ZJ, Gao J, Han JH, et al. Half-quantitative assessment of myelination progression in normal infants and children during 6-48 months with conventional T2-weighted images. 2013 Annual Meeting of International Society of Magnetic Resonance in Medicine (ISMRM), Salt Lake City, USA.
6. Laurent Hermoye, Christine Saint-Martin, Guy Cosnard, et al. Pediatric diffusion tensor imaging: Normal database and observation of the white matter maturation in early childhood. NeuroImage, 2006. 29: 493-504.
7. Shaimaa R.A. Fadeel, Moataz M. Montasser, et al. The role of diffusion weighted magnetic resonance imaging in assessment of normal myelination in infantile brain. AJM, 2015. 51: 271-276.
Figures