4096
Quantification of myelin in children using multi-parametric quantitative MRI1Radiology, Ajou University School of Medicine, Suwon, Korea, Republic of, 2MR Apps & WF, GE Healthcare, Korea, Republic of, 3Neurology, Yonsei University College of Medicine, Seoul, Korea, Republic of
Synopsis
Clinical usage of myelination quantification is wide in children. With multi-parametric quantitative MRI, it is possible to acquire T1-weighted or T2-weighted contrast image simultaneously with absolute values of R1 and R2 relaxation rates and proton density. Using the absolute values, myelination water fraction (MWF) can be calculated.
PURPOSE: The goal of this study was to evaluate the usage of multi-parametric quantitative MRI for determination of myelination quantification in children.
METHODS:
Since May 2016, our institution has been acquiring multi-parametric quantitative MRI sequence in pediatric patients who are undergoing brain MRI in the 3T scanner (GE MRI 750w, GE Healthcare, Milwaukee, WI). Patients with contrast enhancement studies acquired the sequence prior to the contrast administration. Total of 22 pediatric patients (age range: 9 to 5400 days) were included in the study.
MR imaging data were acquired using multi-echo, multi-delay saturation recovery spin echo sequence. The sequence was a 2D FSE multi-dynamic multi–echo sequence, with 4 saturation delays and 2 echoes. The saturation delays were at 130, 500, 1370, and 2970 ms with a TR 4452 ms. The TEs were 22 and 128 msec. Each acquisition led to 8 images per section with different combinations of saturation delay times and TEs. Slice thickness was 5 mm and 20 to 28 axial sections were collected to cover the whole brain without intersection gap. The scanning time was 5 minutes.
Using the software SyMRI 8.0 (SyntheticMR, Linko¨ping, Sweden), the total volume of MWF (Msum), the percentage of Msum within the whole brain parenchyma (Mbpv), and the percentage of Msum within intracranial volume (Micv) were calculated. By drawing region of interests, MWF of the twelve brain regions (pons, middle cerebellar peduncle, genu of corpus callosum, splenium of corpus callosum, caudate, putamen, thalamus, frontal white matter [WM], occipital WM, parietal WM, temporal WM, and centrum semiovale) were obtained.
Using the Bayesian information criterion (BIC), the best model of the values was selected among Logarithmic, Logit, Gompertz, and modified Gompertz models. For each brain region, R2 value was calculated for the best fitting model.
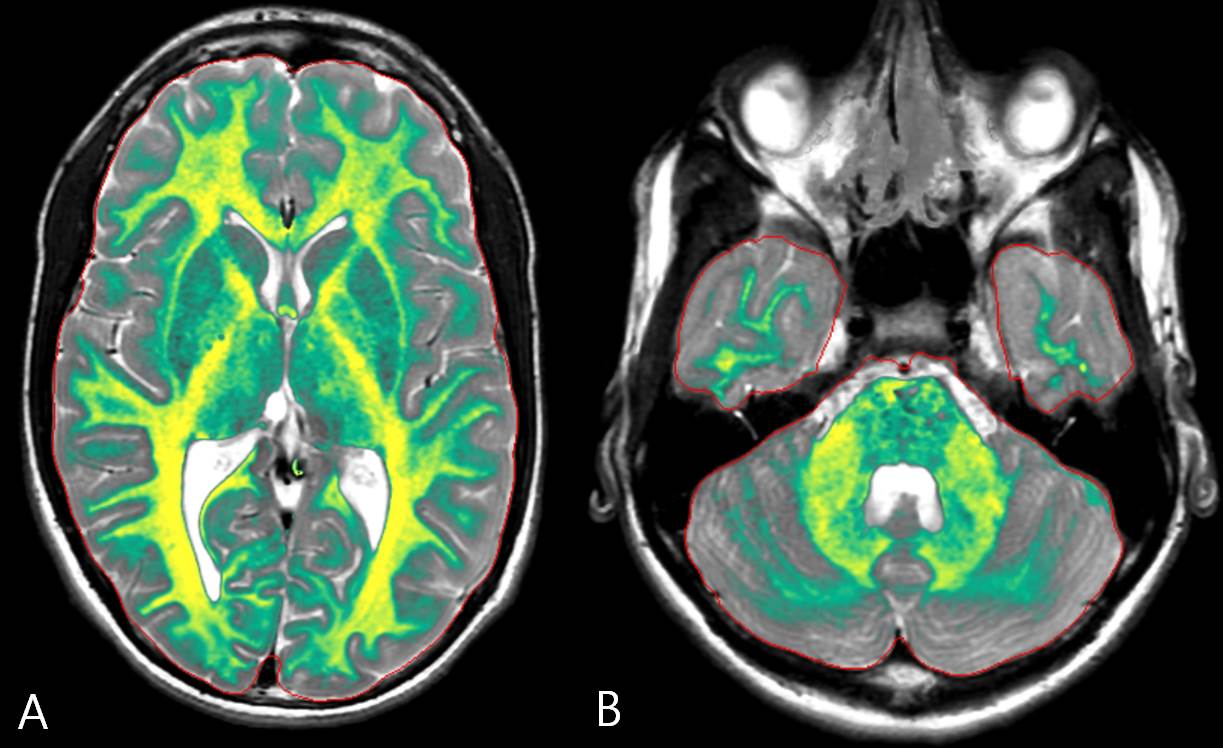
RESULTS: Acquired myelination mapping images followed the known spatio-temporal development of myelination (Figure 1 and 2). The range of calculated Msum, Mbpv, and Micv were 0.8 – 160.9 ml, 0.2 – 13.0 %, and 0.0 – 11.6 %, respectively. Gompertz model showed the best-fit model to Msum, Mbpv, and Micv with the lowest BIC values. In the analysis of MWF in each brain region, Gompertz model was the best-fit model of pons (R2 = 74.6), middle cerebeller peduncle (R2 = 75.5), frontal WM (R2 = 95.7), and centrum semiovale (R2 = 82.1). Logit model was the best-fit model of MWF in genu of corpus callosum (R2 = 93.6), splenium of corpus callosum (R2 = 79.7), caudate (R2 = 24.9), thalamus (R2 = 85.8), parietal WM (R2 = 95.1), temporal WM (R2 = 93.7), and occipital WM (R2 = 94.5).
DISCUSSION: This is the first application of synthetic MR imaging on myelination quantification in children. In this study, we found that synthetic MR imaging may be feasible method to obtain MWF in children. Gompertz model is a growth model characterized by three periods; a period of slow growth, a period of rapid exponential growth, and a period of reduced growth-rate.1 When fitting was done with Gompertz model of maturation like in the previous studies with diffusion tensor imaging or MWF,2,3 the total volume of MWF and its percentage to the brain parenchymal volume and intracranial volume well fitted to the model. Developmental trajectory of MWF in each brain region well fitted to the developmental models of Gompertz and Logit as well.
CONCLUSION: Multi-parametric quantitative MRI is a useful tool for MWF
quantification that well fitted to the myelination developmental model of children.
Acknowledgements
No acknowledgement found.References
1. Gompertz B. On the nature of the function expressive of the law of human mortality, and on a new mode of determining the value of life contingencies. Philosophical transactions of the Royal Society of London 1825; 115:513-583.
2. Sadeghi N, Prastawa M, Fletcher PT, et al. Regional characterization of longitudinal DT-MRI to study white matter maturation of the early developing brain. Neuroimage 2013; 68:236-247.
3. Deoni, S.C, O'Muircheartaigh J, Dirks H, et al. Investigating white matter development in infancy and early childhood using myelin water faction and relaxation time mapping. Neuroimage, 2012. 63(3): 1038-53.
Figures
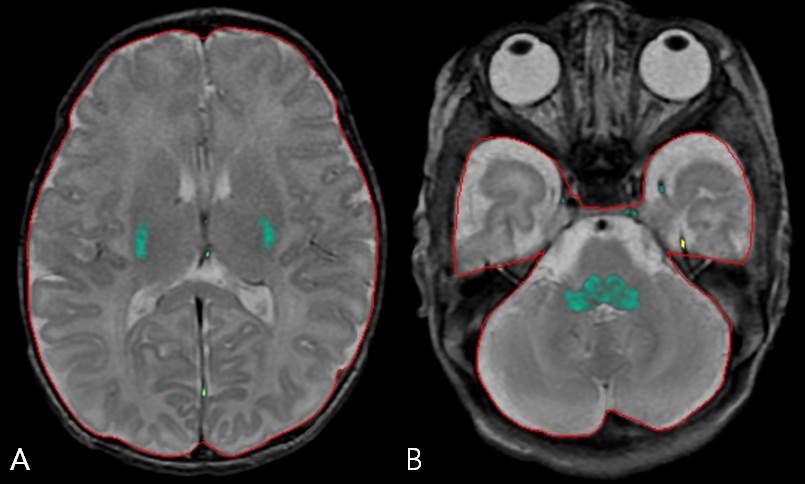
Figure 1. Myelination mapping images in a 9 days-old neonate. Myelination (green) is limited to posterior limb of internal capsule (A) and middle cerebellar peduncle (B).