4095
Developmental Susceptibility changes from neonate to early childhood using Quantitative Susceptibility Mapping (QSM)1Department of Diagnostic Imaging and Nuclear medicine, Graduate school of Medicine, Kyoto University, Kyoto, Japan, 2Human Brain Research Center, Graduate School of Medicine, Kyoto University
Synopsis
To assess the susceptibility changes in early childhood (0 45 months) and these consistencies with previous reports. In our study, 35 children were enrolled and QSM was calculated from 3D gradient-echo images. Susceptibility values in deep gray matter structures showed positive correlation with the subjects’ age and theoretical iron contents, and these in white matter structures showed negative correlation in posterior peduncle of internal capsule and optic radiation. These results reflect the normal neural development in the early childhood and QSM can provide us quantitative methods to evaluate brain development.
Introduction
Brain development occurs rapidly in the early childhood, especially in the first three months [1]. Myelination and decrease in water content are observed on MRI, iron deposition particularly in the deep gray matters also assumed to occur. In clinical practices, iron deposition in deep gray matters contribute to signal decrease on T2WI and myelination in white matters causes signal increase on T1WI and signal decrease on T2WI [2,3]. Signal changes on T1WI according to myelination occur earlier than those on T2WI in early infancy, however, signal changes on T2WI reflect myelination process from 8 to 18 months [3]. Quantitative Susceptibility Mapping (QSM) could provide us unique values that voxel-wise magnetic susceptibility and shows good consistency and reproducibility. QSM potentially differentiates positive susceptibility associated with iron deposition from negative susceptibility related to myelination [4]. The purpose of this study is to assess the developmental susceptibility changes in the deep gray matter and representative white matter structures, and compare with the previous reports about iron deposition [5].Methods
Subject
We retrospectively enrolled 35 children (0 – 45 months) without any abnormalities on conventional brain MR images. Local institutional review board approved this study and written informed consent was waived. We divided the subjects into 6 groups (0 - ≤ 1 month, 5 subjects; 1 - ≤ 2 months, 5 subjects; 4 - ≤ 8 months, 4 subjects; 8 - ≤ 12 months, 4 subjects; 18 - ≤ 22 months, 5 subjects; and 36 - ≤ 44 months, 4 subjects). Eight subjects were excluded because of motion artifact or tilted head position.
MR imaging
MR scans were performed at 3T MR unit (MAGNETOM Skyra, Siemens Healthcare GmbH, Erlangen, Germany) with using 32-channel head coil. Imaging parameters of 3D multi-echo gradient-echo sequence were as follows: TR / TE /ΔTE, 55 ms / 20-50 ms / 10 ms; flip angle, 15°; resolution, 0.9 × 0.9; slice thickness, 2.0 mm; axial acquisition.
Post-processing
We used STI Suite version 2.10 (http://people.duke.edu/~cl160/) to calculate QSM. Phase unwrapping and background phase removal was done with the Laplacian based phase unwrapping and V-SHARP [6]. Then, QSM was calculated from tissue phase images using the iLSQR method [6,7].
Data analysis
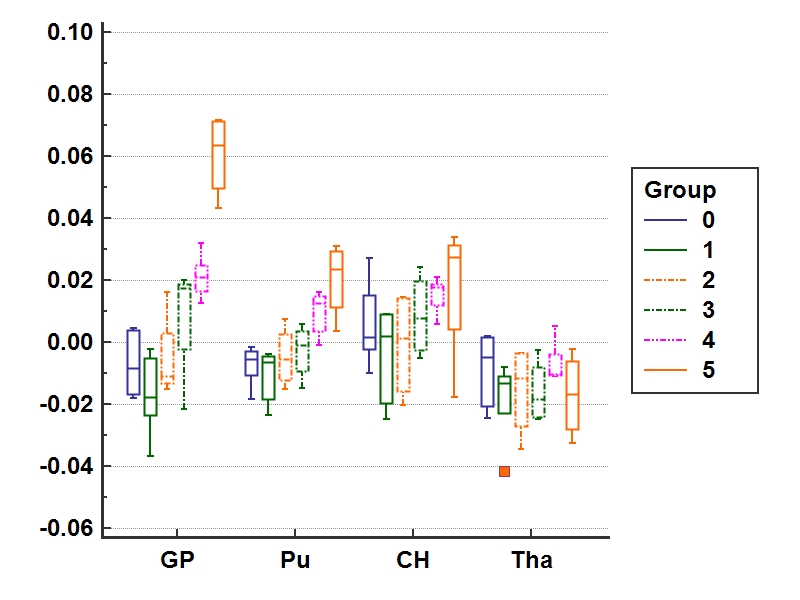
Regions of interest (ROIs) were manually placed on caudate nucleus (CN), putamen (PUT), thalamus (THA), globus pallidus (GP), middle cerebellar peduncle, posterior and anterior area of pons, posterior peduncle of internal capsule (IC), and optic radiation. We assessed linear correlations between these susceptibility values on each ROI and subjects’ age or iron concentrations in the previous postmortem study.
Results
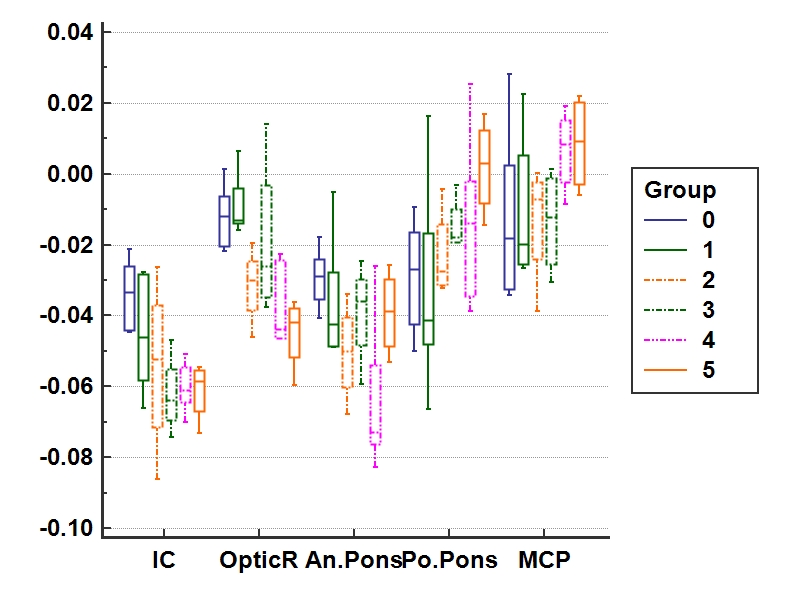
The representative QSM images are shown in Fig.1. The susceptibility values showed significantly positive correlations with subjects’ age on GP (R = 0.80, P < 0.001) CN (R = 0.39, P = 0.047), and PUT (R = 0.73, P < 0.001) (Fig.2) and significantly positive correlation with theoretical age-related iron content (GP: R = 0.97, P = 0.001; CN: R = 0.86, P = 0.028; PUT: R = 0.98, P < 0.001). The susceptibility values significantly negative correlations on IC (R = -0.59, P = 0.001) and optic radiation (R = -0.67, P < 0.001) (Fig.3).Discussion
Our results are consistent with the previous reports and theoretical hypothesis that susceptibility values in the deep gray matter increase with subjects’ age and those in white matter structures decrease. These results in white matter structures also show that susceptibility values could reflects the normal maturation of white matter. Significant decrease of susceptibility values are shown in IC and optic radiation but the other ROIs. Tissue anisotropy and heterogeneity in white matter may complicate susceptibility. Further studies are necessary for maturation of white matter.
Iron deposition shows the important neural development in early childhood on deep gray matters. In these setting, QSM can provide us more useful quantitative values about brain development compared with conventional T1 and T2 weighted images.
Conclusion
QSM could demonstrate quantitative values associated with neural development in the early childhood.Acknowledgements
No acknowledgement found.References
1. Holland D, Chang L, Ernst TM, et al. Structural growth trajectories and rates of change in the first 3 months of infant brain development. JAMA Neurol 2014;71:1266–74 2. Barkovich AJ1, Kjos BO, Jackson DE Jr, et al. Normal maturation of the neonatal and infant brain: MR imaging at 1.5 T. Radiology 1988;166:173-80. 3. Aoki S, Okada Y, Nishimura K, et al. Normal deposition of brain iron in childhood and adolescence: MR imaging at 1.5 T. Radiology 1989;172:381-5. 4. Liu C, Li W, Wu B, Jiang Y, Johnson GA. 3D fiber tractography with susceptibility tensor imaging. Neuroimage. 2012 Jan 16;59:1290-8. 5. Hallgren B, Sourander P. J Neurochem. 1958;3:41-51. The effect of age on the non-haemin iron in the human brain. 6. Li W, Avram AV, Wu B, et al. Integrated Laplacian-based phase unwrapping and background phase removal for quantitative susceptibility mapping. NMR Biomed. 2014; 27:219-27 7. Wei H, Dibb R, Zhou Y, et al. Streaking artifact reduction for quantitative susceptibility mapping of sources with large dynamic range. NMR Biomed. 2015;28:1294-303.Figures
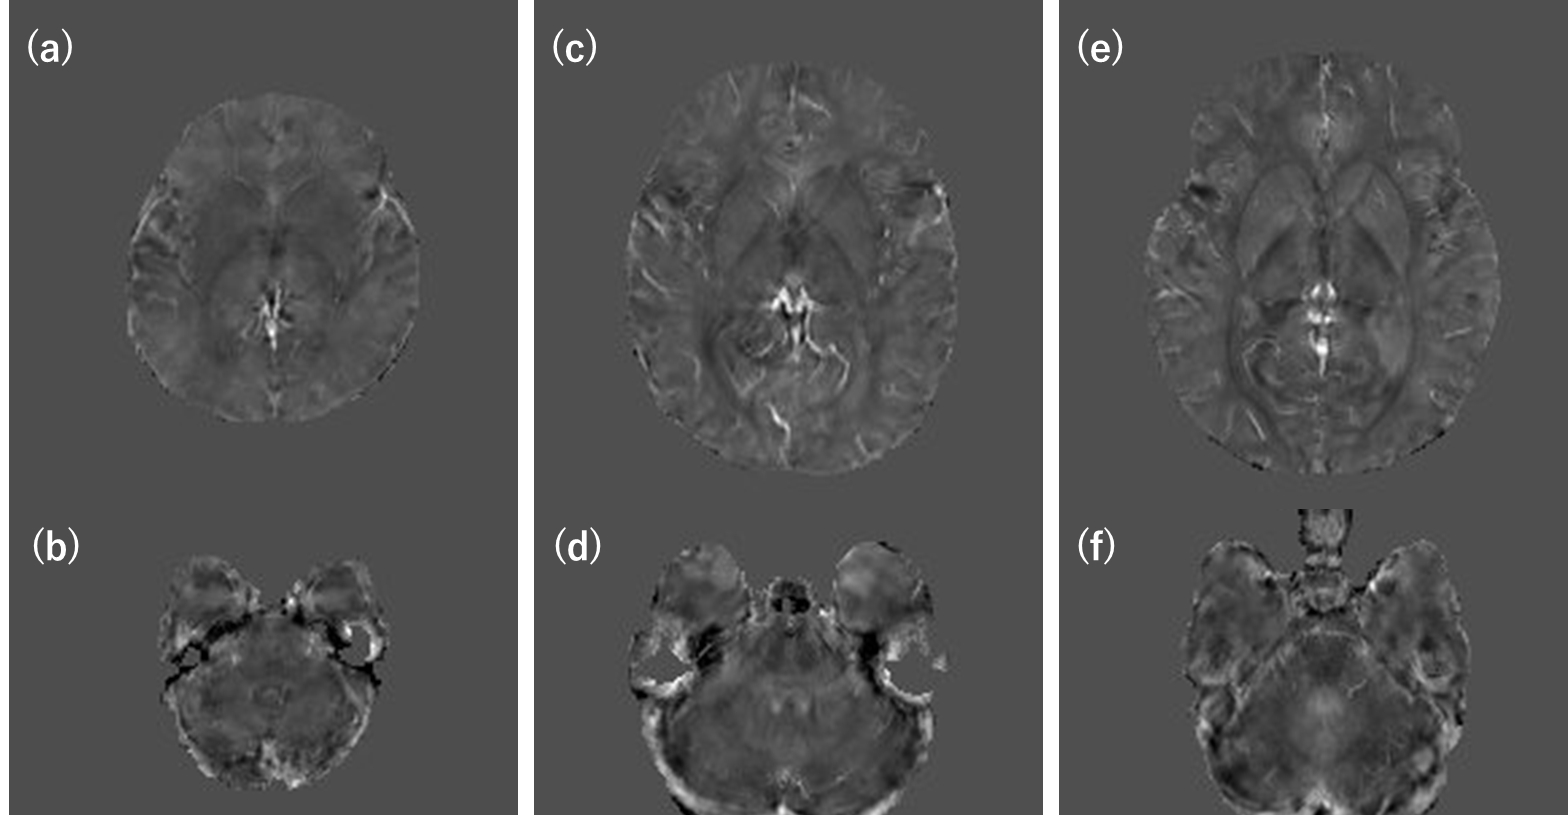
Representative QSM images of basal ganglias and posterior fossa. (a, b) a 0 months old male (Group 0). (c, d) a 11 months old boy (Group 3). (e, f) a 37 months old girl (Group 5).