4092
Imaging of glutamate alterations in a mouse model of temporal lobe epilepsy1Dept. of Radiology, Medical Physics, University Medical Center Freiburg, Freiburg, Germany, 2Dept. of Neurosurgery, Experimental Epilepsy, University Medical Center Freiburg, 3Institute of Microstructure Technology, Karlsruhe Institute of Technology
Synopsis
Hippocampal sclerosis involves neuronal loss in hippocampal subfields and is a common characteristic of temporal lobe epilepsy (TLE). Investigation of the metabolic alterations following a status epilepticus may lead to a better understanding of epileptogenesis and can reveal biomarkers for TLE. Overcoming the major disadvantages of single voxel 1H MR spectroscopy, namely a low spatial and temporal resolution, this study investigates the capability of the glutamate chemical exchange saturation transfer (GluCEST) method to map endogenous glutamate alterations in a mouse model of TLE.
Purpose
Hippocampal sclerosis is one important hallmark in temporal lobe epilepsy (TLE) and involves cell death in hippocampal subfields CA1 and CA3-4. Neuronal loss and its associated reductions in concentrations of the neurotransmitters gamma-aminobutyric acid (GABA) and glutamate (Glu) can be quantified by 1H MR spectroscopy. An investigation in the intrahippocampal kainic acid (KA) mouse model of mesial TLE demonstrated longitudinal changes in Glu concentrations that could act as a biomarker of epileptogenesis1.
In contrast to single voxel spectroscopy, the glutamate chemical exchange saturation transfer (GluCEST) method can yield spatially resolved maps sensitive to Glu concentrations2,3. So far, one publication has already indicated the capability of GluCEST to lateralize the epileptic foci in nonlesional TLE4.
The goal of this study was to optimize the CEST pulse in order to maximize the GluCEST effect and investigate the capability of GluCEST to reveal alterations in experimental TLE.
Methods
CEST images were acquired with a modified RARE sequence. The frequency of the saturation pulse was incremented from -5 to 5ppm in steps of 0.2ppm. Experiments were performed with various saturation pulse durations (0.5-3 s) and amplitudes (1-30 µT). B0 inhomogeneities were corrected pixel wise, in phantom experiments by shifting the minimum of the interpolated CEST spectra to 0 ppm, and in vivo by applying WASSR (Water Saturation Shift Referencing5). The GluCEST effect was evaluated at 3 ppm.
Experiments were performed on a preclinical 7T MRI system (Bruker BioSpec) equipped with a cryoprobe (Bruker, Germany). Imaging parameters: resolution 0.25 x 0.25 x 1 mm3, FOV 12 x 8 mm2, MTX 48 (read) x 32 (phase), RARE factor 32, TE 4.62ms, TRphantom = duration of CEST pulse plus additional 2s, TRin vivo = CEST pulse (2s) plus additional 3s, NAphantom = 1, NAin vivo = 2, TAphantom per CEST spectrum = 2-4min, TAin vivo = 8m40s.
In vivo experiments were performed in the KA mouse model of TLE. Unilateral injection of KA into the septal part of right hippocampus (HC) provoked a status epilepticus. Mice (n=2) were scanned 1 day before, 1 day after, and 8 days after KA injection.
Results
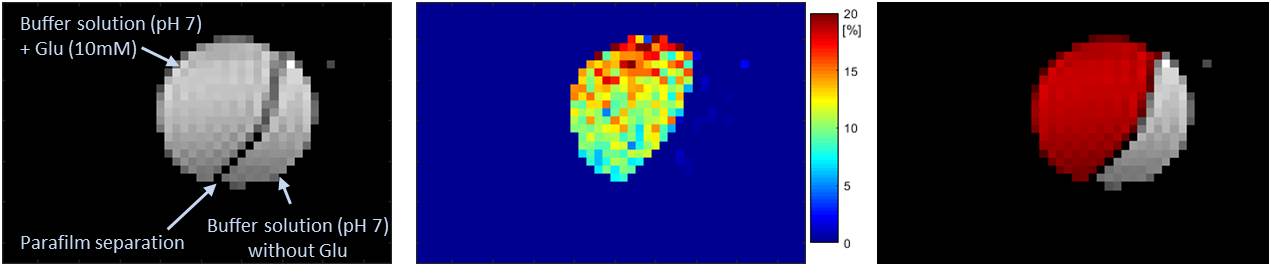
As a proof of principle, figure 1 shows GluCEST mapping of glutamate at the physiological concentration of 10mM in a buffer solution at pH 7.
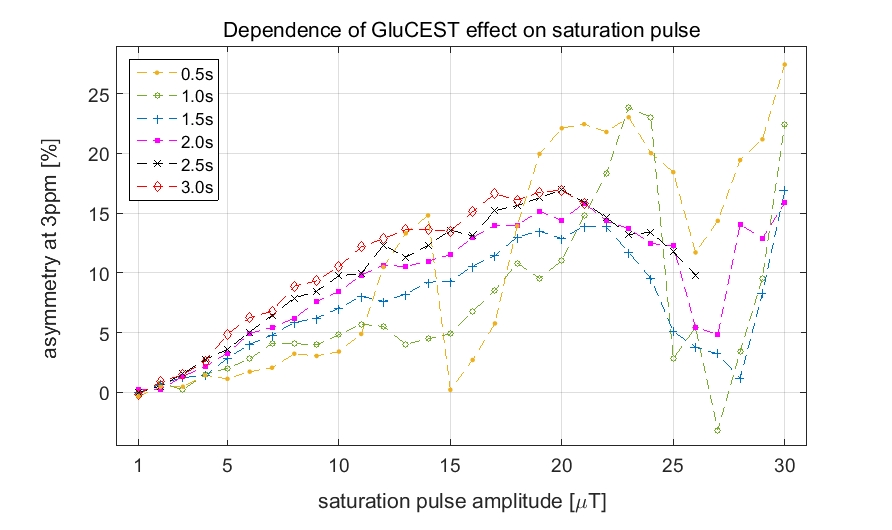
The GluCEST effect increased steadily with increasing saturation power reaching a maximum at approximately 20µT (Figure 2).
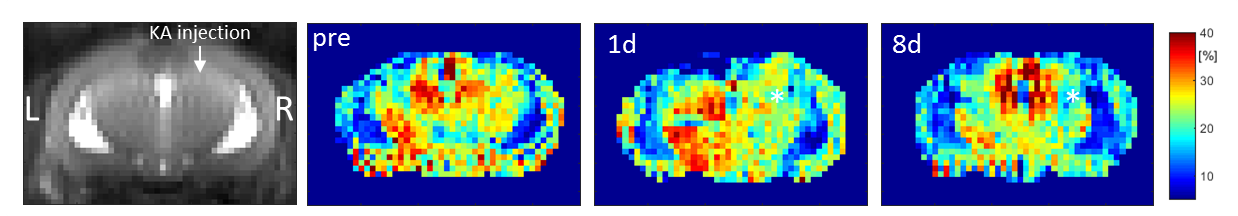
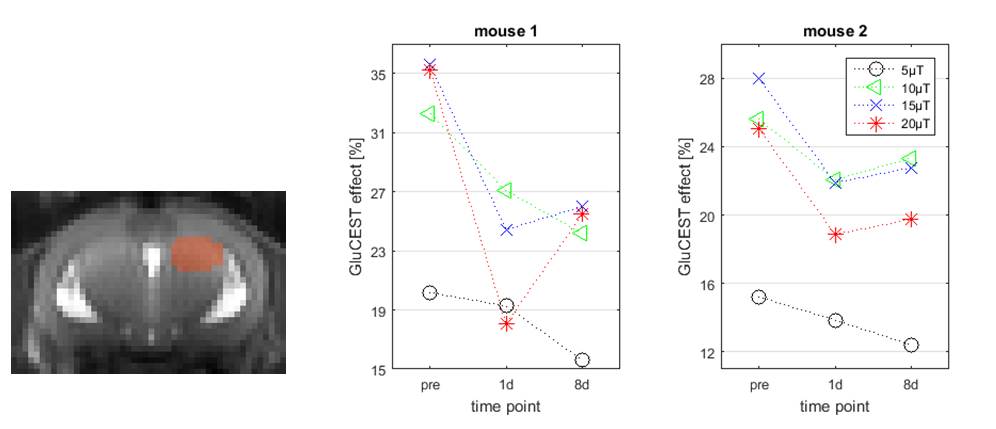
In vivo GluCEST maps discriminate brain CSF, gray and white mater (Figure 3) and show a reduction of the mean GluCEST effect in the septal part of the right HC following KA injection (Figure 4).
Discussion
It is well established that the KA injection and subsequent status epilepticus leads to cell death in the treated HC. Investigation by 1H MR spectroscopy revealed reduced concentrations of creatine (Cr), N-acetyl aspartate (NAA), GABA and Glu1. With NAA showing virtually no CEST effect at 3ppm and Cr and GABA contributing only a little2, the reduction of the GluCEST effect can mainly be attributed to reduced Glu concentrations.
A saturation amplitude of 10-20µT was necessary to detect these relatively small changes. As has been reported before, the GluCEST effect increases with the saturation amplitude, but eventually a plateau is reached. In vivo the B1 amplitude is additionally limited by SNR and SAR considerations.
Conclusion
We have demonstrated that GluCEST is able to detect changes of Glu concentrations following status epilepticus in mice. By using single voxel spectroscopy, it had been indicated that Glu concentrations in the HC can be used as biomarker for epileptogenesis. We can now investigate Glu in the whole brain at a much higher spatial resolution, leading to a better understanding of metabolic alterations in TLE. Hippocampal-subfield-specific alterations will be the subject of future investigations.Acknowledgements
This work was supported by the “BrainLinks-BrainTools” Cluster of Excellence EXC-1086, German Research Foundation (DFG).References
[1] Schwaderlapp et al. MRI monitoring of epileptogenesis with direct histological validation. Proc. Intl. Soc. Mag. Reson. Med. 24 (2016)
[2] Cai et al. Magnetic resonance imaging of glutamate. Nature Medicine 2012
[3] Pépin et al. In vivo imaging of brain glutamate defects in a knock-in mouse model of Huntington's disease. Neuroimage 2016
[4] Davis et al. Glutamate imaging (GluCEST) lateralizes epileptic foci in nonlesional temporal lobe epilepsy. Science Translational Medicine 2015
[5] Kim et al. Water saturation shift referencing (WASSR) for chemical exchange saturation transfer (CEST) experiments. Magn. Reson. Med. 2009
Figures