4088
Preclinical detection of leptomeningeal inflammation using contrast-enhanced FLAIR at 9.4T in the EAE-MOG mouse model of Multiple Sclerosis1Buffalo Neuroimaging Analysis Center, Department of Neurology, Jacobs School of Medicine and Biomedical Sciences, University at Buffalo, The State University of New York, Buffalo, NY, United States, 2MRI Clinical and Translational Research Center, Jacobs School of Medicine and Biomedical Sciences, University at Buffalo, The State University of New York, Buffalo, NY, United States
Synopsis
Persistent clusters of inflammatory cells in the leptomeningeal compartment are thought to contribute directly to subpial cortical demyelination and neurodegeneration in MS patients. In human patients, post-contrast 3D T2-FLAIR allows the detection of leakage of contrast agent into inflammatory foci and the subarachnoid space. We propose a pulse sequence for LMI imaging in rodents and demonstrate its applicability in the EAE-MOG model of MS at 9.4T.
PURPOSE
It has recently been recognized that the pathogenesis of Multiple Sclerosis (MS) involves cortical gray matter damage1. In particular, persistent clusters of inflammatory cells in the leptomeningeal compartment are thought to contribute directly to subpial cortical demyelination and neurodegeneration2,3,4,5,6,7. Clinical post-contrast 3D-T2-FLAIR MRI at 3T allows detecting the inflammation-related leakage of contrast agent into inflammatory foci and the subarachnoid space8. However, despite the significant research implications, MRI-based detection of leptomeningeal inflammation (LMI) has not been demonstrated in rodent models of MS. We present a pulse sequence for LMI imaging in rodents and demonstrate its applicability in the EAE-MOG model of MS at 9.4T.METHODS
Animals: In this IACUC-approved study we immunized 10 C57BL/6J mice with MOG peptide fragment and injected 4 controls with saline.
MRI experiment and histology: 6 MOG and 4 saline Isoflurane-anesthetized animals were scanned between one and two weeks after induction (a window in which peak inflammation has been reported histologically9) at 9.4T (Biospec, Bruker Biospin) with a 4-channel surface Rx-coil (volume Tx-coil). Attenuation of cerebrospinal fluid (CSF) was achieved by adding an inversion recovery (IR) pulse to a 2D-RARE sequence (TR/TE=3500/5.44ms;RARE-factor=2;averages=3;22 slices of 600µm; matrix=170x180;2x zero-filled in-plane resolution=52.5x52.5µm2;TA=15m45s). We set TI=1162ms to null signal from cerebrospinal fluid (FLAIR-RARE; T1CSF=2450ms at 9.4T10). To determine the optimal post-contrast acquisition time we applied the FLAIR-RARE sequence 3x immediately following a tail-vein injection of 0.2µmol/g gadobutrol. To understand the importance of the IR pulse, we replaced in two of the six EAE-MOG animals the last FLAIR-RARE by both a RARE without IR-pulse (TR=1500ms) and a T1-weighted FLASH sequence (TR/TE=313/2.9ms;flip=30°) with otherwise identical sequence parameters. After MRI, we perfused all animals within 48 hours and assessed stage-matched brain cryosections for the cellular density of Iba1 positive macrophage/microglia. To investigate the window of peak visibility of LMI on MRI we scanned the 4 MOG animals with the FLAIR-RARE sequence at pre-immunization and at 1, 2, and 4 weeks post-immunization.
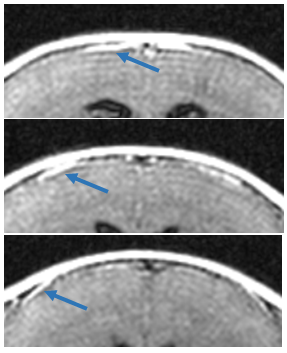
Analysis: Scans were presented in random order to three trained, blinded analysts (R1,R2,and R3) who were asked to identify LMI based on the presence of one of the following: i) clear enhancement of meninges as a bright membrane around the cortex with no small vessels discernible in the same area, ii) significant localized thickening of enhanced meninges, or iii) focal, enhancing spots extending into the arachnoid space. If raters were unsure about the presence (“definite LMI”) or absence (“no LMI”) of either of these markers, LMI was defined as uncertain presence of at least two of them (“probable LMI”). To avoid confusion with veins, raters were asked to inspect adjacent slices with respect to tubular structures and focus the evaluation on the lateral LM (Fig.1).
RESULTS
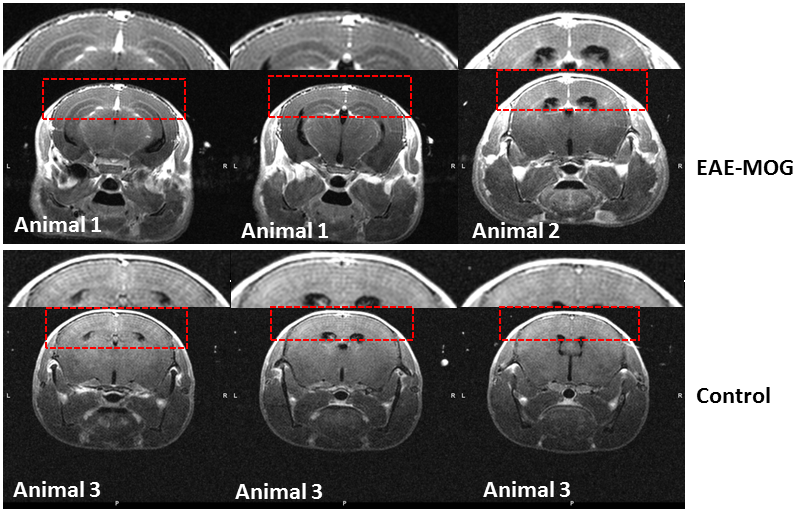
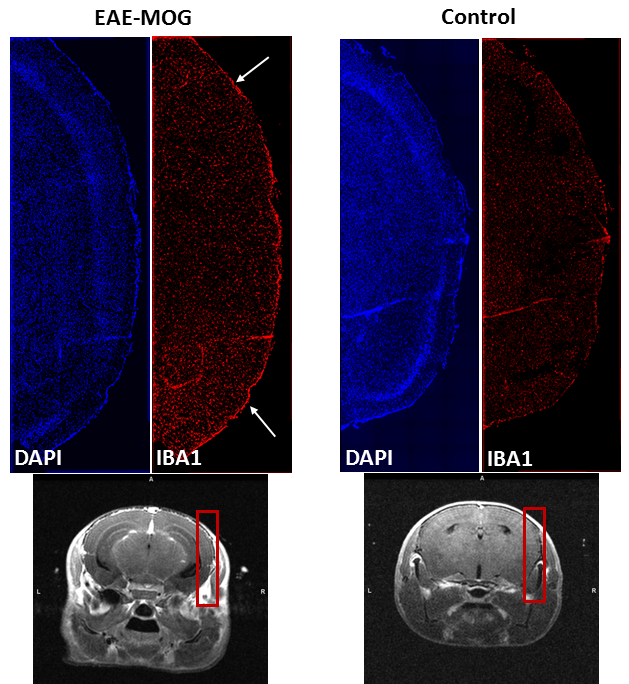
The conventional RARE and T1-FLASH sequences did not unambiguously identify enhancement of the meninges (Fig.2). Figure 3 illustrates typical imaging findings with FLAIR-RARE. Considering “definite LMI” and “probable LMI”, raters R1 and R2 identified LMI in all EAE-MOG animals (R3 all but two); R1 and R3 reported no LMI in the controls animals (R2 found LMI in two), resulting in a specificity of 94% and sensitivity of 95%. No significant differences in detection of LMI were found between the three consecutive post-Gad scans (p=0.81). Histology confirmed a higher density of immune response cells in the meninges of the EAE-MOG animals (Fig.4). Peak visibility of LMI on FLAIR was obtained at one-week post-immunization with decreasing intensity through weeks 2 to 4 (Fig.5). Three of the 28 FLAIR-RARE (10.7%) had to be excluded from the analyses due to motion artifacts.DISCUSSION
CSF-nulling in the FLAIR-RARE sequence improves the detection of contrast agent accumulation in the meninges. However, despite high specificity and sensitivity for LMI in the present study, the accuracy of the technique depends on a careful assessment of the images to avoid interpretation of large vessels and Gibbs-ringing as thickening of the meninges. The negligible difference of LMI visualization between the three consecutive scans can be explained by the high blood flow and a resulting faster leakage of the contrast agent through a thinner LM compared to humans. Unlike in humans, where a FLAIR is usually acquired 20 minutes after the contrast administration, a sufficient enhancement was obtained immediately after injection in the present study, providing the basis for a rapid LMI-screening of animals. The different imaging phenotypes of LMI (Fig.4) will be the subject of future research.CONCLUSION
The presented 15 minutes post-contrast FLAIR-RARE enables the pre-clinical detection of LMI with high sensitivity and specificity, providing a new avenue for the preclinical investigation of MS-related pathology and drug development.Acknowledgements
Research reported in this publication was funded by the National Center for Advancing Translational Sciences of the National Institutes of Health under Award Number UL1TR001412. The content is solely the responsibility of the authors and does not necessarily represent the official views of the NIH.References
1. Schutzer, Steven E., et al. "Gray matter is targeted in first-attack multiple sclerosis." PloS one 8.9 (2013): e66117.
2. Lucchinetti CF, Popescu BF, Bunyan RF, et al. Inflammatory cortical demyelination in early multiple sclerosis. N Engl J Med 2011;365:2188–2197
3. Serafini B, Rosicarelli B, Magliozzi R, Stigliano E, Aloisi F. Detection of ectopic B-cell follicles with germinal centers in the meninges of patients with secondary progressive multiple sclerosis. Brain Pathol 2004;14:164–174.
4. Magliozzi R, Howell O, Vora A, et al. Meningeal B-cell follicles in secondary progressive multiple sclerosis associates with early onset of disease and severe cortical pathology. Brain 2007;130:1089–1104.
5. Magliozzi R, Howell OW, Reeves C, et al. A gradient of neuronal loss and meningeal inflammation in multiple sclerosis. Ann Neurol 2010;68:477–493.
6. Howell OW, Reeves CA, Nicholas R, et al. Meningeal inflammation is widespread and linked to cortical pathology in multiple sclerosis. Brain 2011;134:2755–2771.
7. Choi SR,HowellOW, CarassitiD, et al. Meningeal inflammation plays a role in the pathology of primary progressive multiple sclerosis. Brain 2012;135:2925–2937
8. Absinta, Martina, et al. "Gadolinium-based MRI characterization of leptomeningeal inflammation in multiple sclerosis." Neurology 85.1 (2015): 18-28.
9. Lassmann, H. "Experimental models of multiple sclerosis." Revue neurologique163.6 (2007): 651-655.
10. van de Ven, Rob CG, et al. "T1 relaxation in in vivo mouse brain at ultra-high field." Magnetic resonance in medicine 58.2 (2007): 390-395.
Figures