4081
Characterizing the evolving property of de-and re-myelination in a mouse model using NODDI and MRI texture1University of Calgary, Calgary, AB, Canada, 2Queens University, Kingston, ON
Synopsis
Myelin injury and repair are associated with many neurological diseases including multiple sclerosis. We evaluated the utility of NODDI and MRI texture analysis for assessing myelin integrity using a mouse model of de- and re-myelination. Following lesion induction in mouse spinal cord, 9.4T MRI was conduced during demyelination (day 7) and ongoing remyelination (days 14, 28, and 35). With histological verification, both texture heterogeneity and neurite orientation dispersion (ODI) increased when demyelination occurs. But the latter showed persistent recovery with remyelination, similar to lesion size. These findings suggest the utility of ODI and texture heterogeneity as measures of myelin integrity.
Purpose
To evaluate the potential of NODDI (neurite orientation dispersion and density index) and MRI texture heterogeneity for assessing de- and re-myelination induced in mouse spinal cord, followed by histological validation.Method
Animal model and Histology
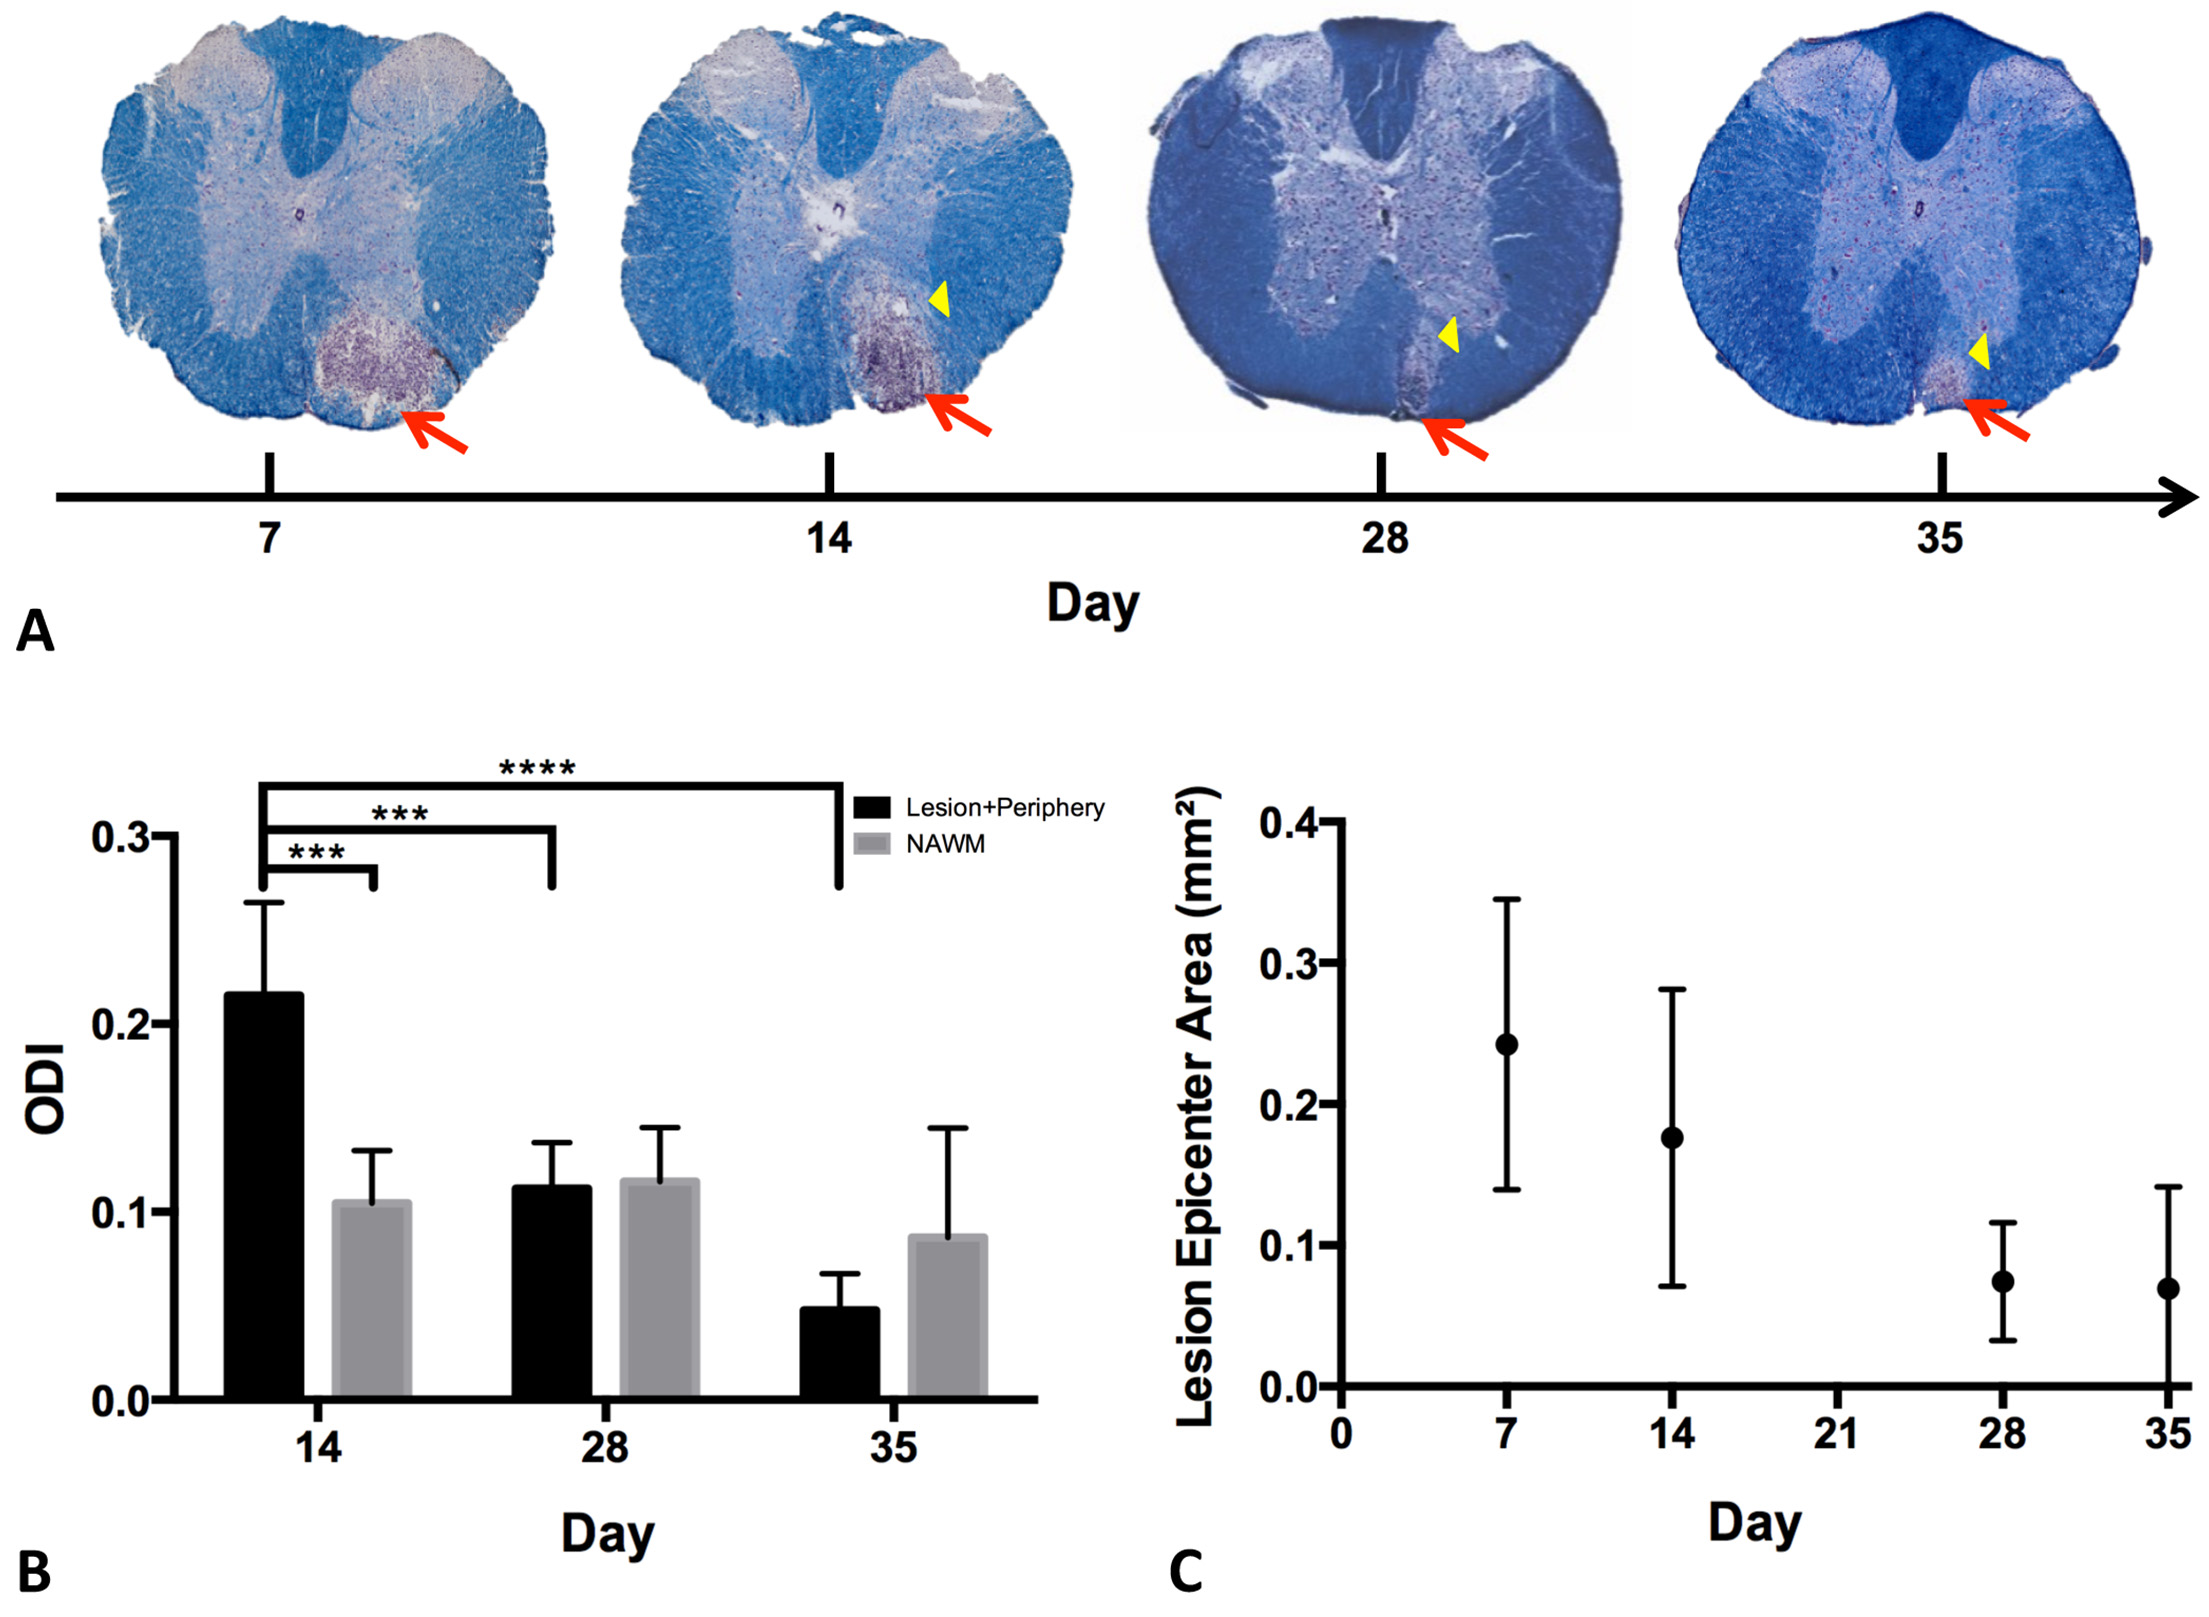
Demyelination was induced in 22 mice in the ventral white matter of thoracic spinal cord (T3/4) using a chemical toxin, lysolecithin. Based on prior evidence,1 this mouse model features spontaneous remyelination post injury, and prominent lesion repair was seen starting from day14 in histology. To determine the imaging outcomes, the animals were scanned at sequential timepoints and sacrificed immediately thereafter for histology. This included immunohistochemistry (myelin basic protein) and eriochrome cyanine staining for myelin characteristics.
MR Imaging
All animals were imaged with a high-resolution 9.4T scanner. Cohorts of 6 mice were imaged in situ over periods of demyelination (day 7) and ongoing remyelination (days 14 to 40).1 Imaging protocol included: RARE T2-weighted MRI for lesion identification and texture analysis (TR/TE = 2500/15ms; slice thickness = 0.75mm; FOV = 1.5x1.5cm; matrix = 256x256; 7 slices), and 2-shell HARDI (b1/b2 = 1000/2000: 5 b0; 15 directions each; TR/TE = 5000/36ms; matrix = 128x128; FOV = 1.5X1.5 cm; slice thickness = 0.75mm) for NODDI at corresponding slice locations to T2-weighted MRI. Additionally, 2 mice each were imaged in vivo on days 35 and 40 for comparison using the same protocol.
Image Analysis
We used a Matlab toolbox obtained online2 to compute NODDI outcomes including orientation dispersion index (ODI) and neurite density index (NDI) of nerve fibers,3 and a local-designed software to compute texture heterogeneity based on a multi-resolution spatial frequency assessment method. MRI texture refers to the organizing pattern of MRI voxels, and texture heterogeneity is shown to be correlated with the severity of demyelination in previous studies.4 Image pre-processing was done using ImageJ (NIH,USA).
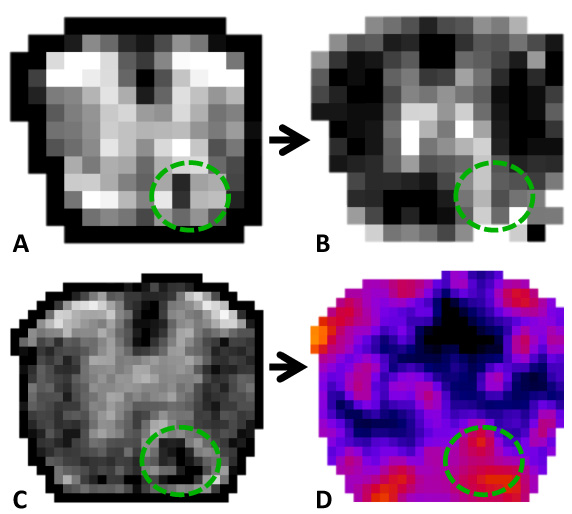
Measurements were acquired from the lesion to assess de- and re-myelination and from the dorsal column of spinal cord to evaluate normal appearing white matter (NAWM). Regions of interest (ROIs) in lesions and NAWM were drawn according to T2-weighted images and then verified by comparing to histology (Figure 1). Furthermore, in order to assess how remyelination impacts tissue structure past day 7, enlarged ROIs were also measured that included both lesion epicenter and the surrounding tissue, which is determined by the size of the correspondent lesion on day 7 and the remyelination property in histology. Outcomes were evaluated using 2-way ANOVA, where p ≤ 0.05 was considered significant.
Results
The induction of demyelinated lesions was successful in 21 of 22 animals studied. All lesions were detected in correspondent locations of NODDI, texture analysis, and histological images (Figures 1 & 2). Visually, in situ MRI showed slightly greater delineation of lesions than in vivo MRI. Outcomes from day 40 were grouped to day 35 due to the small sample size and similarity in histology.
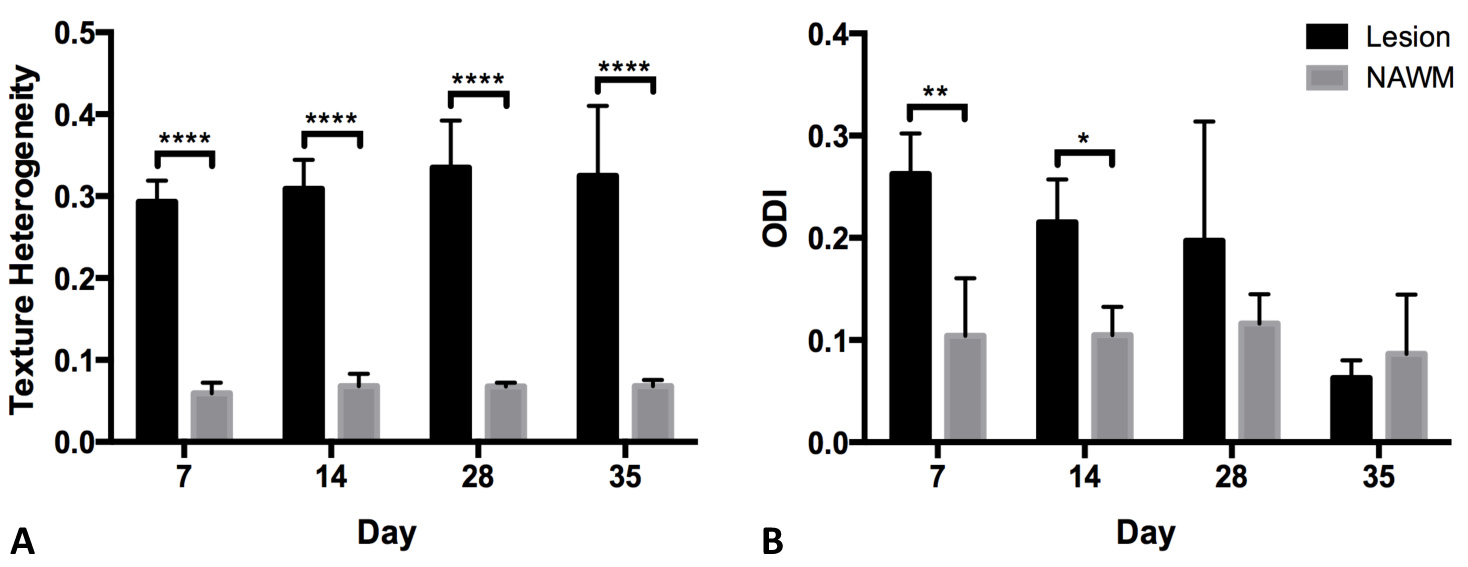
Significant differences were found between lesions and NAWM on all days in texture heterogeneity and on days 7 and 14 for ODI. Over time, while there were no significant changes in the lesion epicenter in texture heterogeneity, we found a persistent decline in ODI in both epicenter and enlarged ROIs. This was consistent with the progressive reduction in lesion size (Figures 3-4). NDI did not show differences over time or between lesions and NAWM. Imaging outcomes of NAWM remained stable across time points.
Discussion
NODDI represents a recent advance in diffusion imaging. In contrast to diffusion tensor imaging (DTI), NODDI features enhanced specificity by identifying the contributing components of DTI. ODI detects the regularity of nerve fibers. While demyelination led to increased ODI at days 7 and 14, its recovery over time suggests ongoing nerve recovery with remyelination. Multi-resolution MRI texture analysis studies the scale-specific structural property of a tissue. Changes in de- and re-myelination cause disruptions in the alignment, integrity, and regularity of nerve fibers. This unavoidably will lead to increased texture heterogeneity in demyelinated lesions. The lack of change in texture over time in lesion epicenter may indicate the persistence of myelin and axonal damage, or lack of repair in exhausted axons. As evidenced in histology, remyelination occurs preferably from the periphery instead of epicenter of a lesion.Conclusion
Our findings suggest that NODDI ODI and MRI texture heterogeneity are complimentary measures of de- and remyelination. Further studies are warranted to clarify their potential in assessing de- and re-myelination in patients with multiple sclerosis and other demyelinating disorders.Acknowledgements
We thank the summer studentship support (LUO) from the University Teaching and Learning Funding Committee, Office of the Provost, University of Calgary, and funding supports for the project from the Natural Sciences and Engineering Council of Canada (NSERC), MS society of Canada, and Alberta Innovates - Health Solutions, Alberta, Canada.References
1. Keough MB, Jensen SK, Yong WV. Experimental demyelination and remyelination of murine spinal cord by focal injection of lysolecithin. J Vis Exp. 2015 Mar; 26 (97).
2. NODDI Matlab Toolbox. 2015. Retrieved from: http://mig.cs.ucl.ac.uk/mig/mig/index.php/?n=Tutorial.NODDImatlab.
3. Zhang H, Schneider T, Wheeler-Kingshott CA, Alexander DC. NODDI: practical in vivio neurite orientation dispersion and density imaging of the human brain. Neuroimage. 2012 Jul; 61 (2):1000-16.
4. Zhang Y, Moore GR, Laule C, Bjarnason TA, Kozlowski P, Traboulsee A, Li DK. Pathological correlates of magnetic resonance imaging texture heterogeneity in multiple sclerosis. Ann Neurol. 2013 Jul; 74(1): 91-9.
Figures